


When we look back at 2023 its really a tail of two vary different trajectories as the first quarter saw higher rates shudder a few banks most notably Silicon Valley Bank. This led to a massive curve steepening as yields plunged and the US govt 10Y was driven from 4.13% down to 3.28%. However the equity markets weren’t really seeing risk being withdrawn as the SPX went from 4078 down to 3808 and never looked back and by July it was back above 4600. The Bond yield curves steepened through March and into the highs by May, to only flatten to the lows again in early July.
However as you can see from the following yield curve chart of the various US yield curves, the bond market continues to re-steepen:
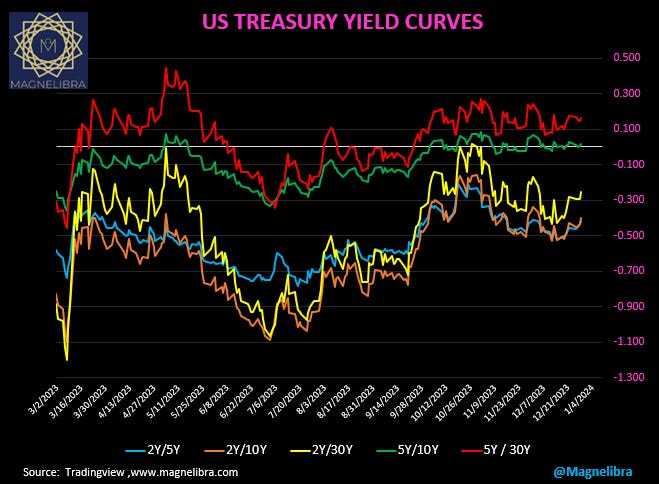
This happens because of the time that has passed since the last rate hike and since Powell caved at the December meeting, virtually signaling the next move would be rate cuts, not a matter of if, but when.
So the US yield curve remains heavily inverted at the front end due to the Fed Funds anchor but we suspect once rate cuts start this curve chart will be well into full steeping mode across the maturity spectrum:
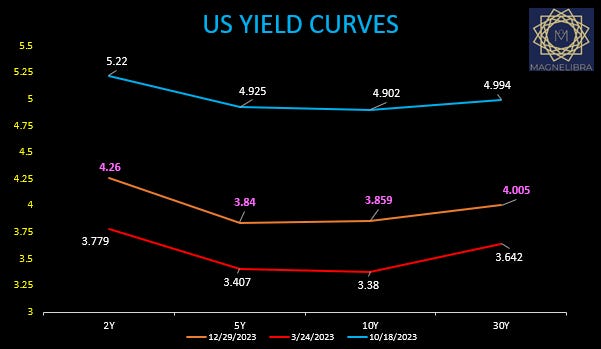
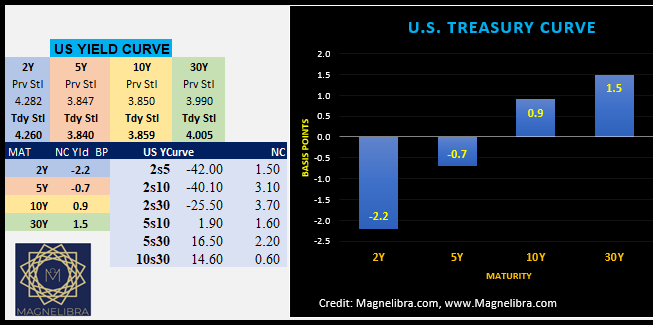
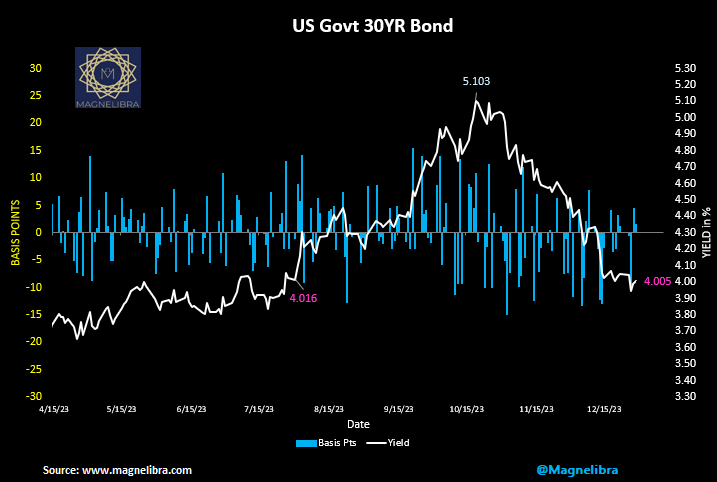
So let’s stay with the bond theme and see where things settled out on the 29th:
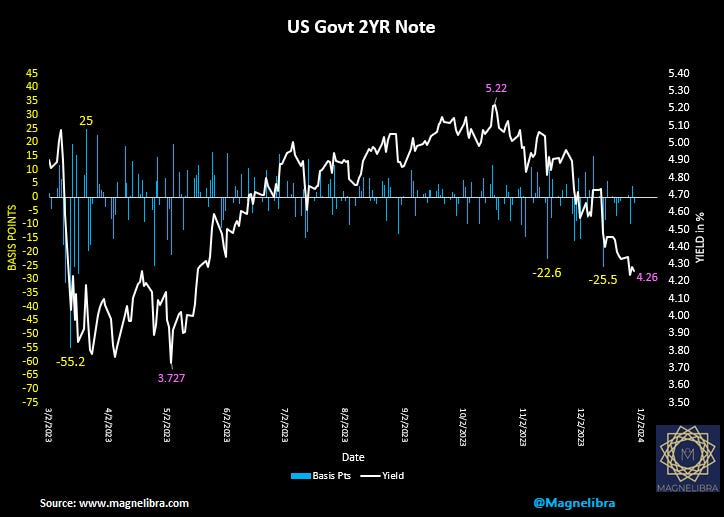
Here is the US Govt 2Y settling out at 4.26% at the same level as mid April:
Here is the 30Y Chart settling out 2023 at 4.005% basically the same level as early June:
We know that the pace of the rate hikes has really put the banking sector in a precarious position due to their HTM (Held to Maturity) position marks, but we feel that time will alleviate this especially if these banks can make it through as the FOMC starts to drastically cut rates. We have seen this total unrealized loss chart on social media quite often and the lower rate trajectory should see this subside over time. Please understand that HTM securities are not held on the banks books at market to market but rather at historical cost, however it doesn’t change the charts reality:
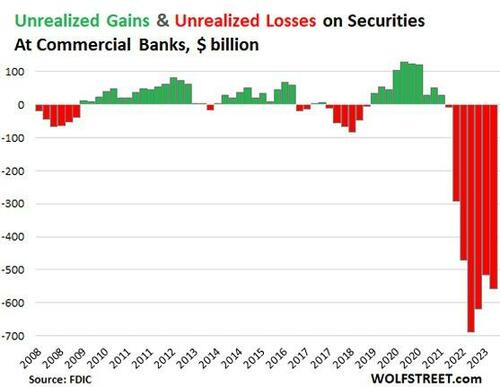
The marketplace keeps track of these HTM unrealized losses but from the banks perspective, HTM (Held-to-Maturity) securities are a category of investments that banks intend to hold until they mature. Under accounting rules (specifically, FAS 115), these are accounted for at their historical cost, not at their current market value. This means that any unrealized gains or losses on HTM securities are not reflected in the bank's current income statement. Instead, they are accumulated in a separate equity account until the security matures or is sold.
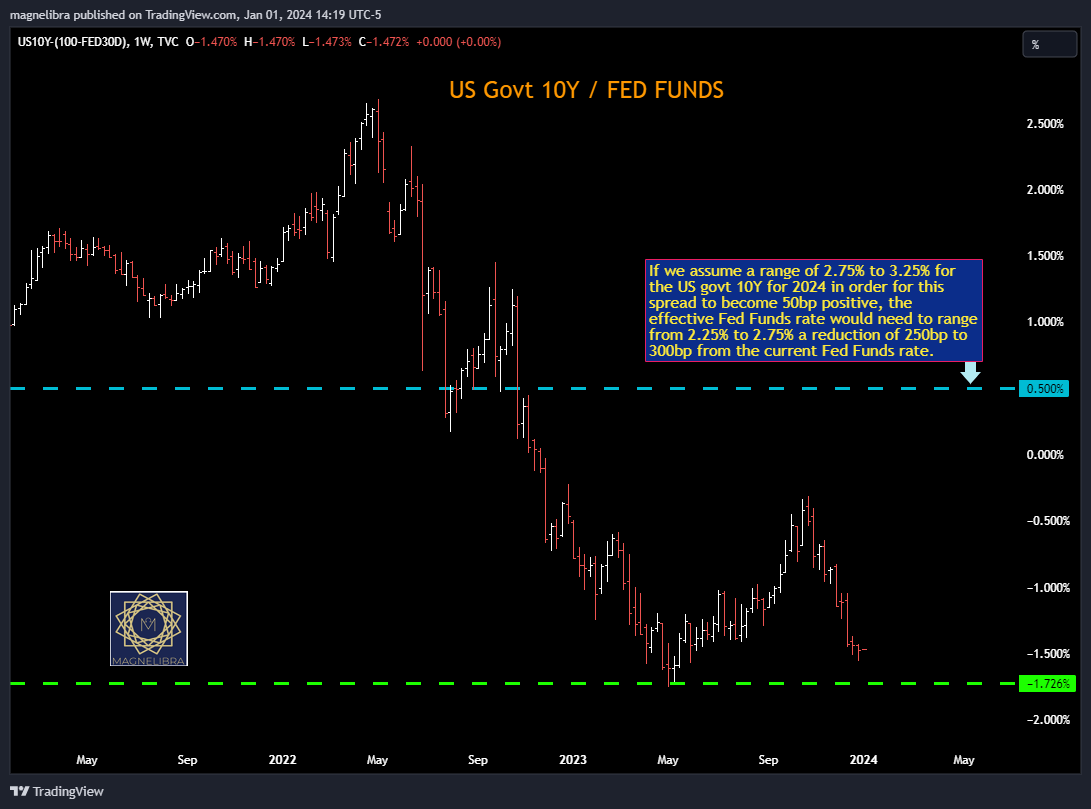
So this doesn’t mean the banks are subject to mark to market unrealized losses but this does not free them from this problem because, if their deposit base shrinks and or write offs in other loan segments start to accelerate, then this could be an issue as HTM could easily turn into have to sell, but we don’t see that as plausible unless we get a major contraction in 2024. We are in the camp that the FOMC will cut rates at 50bp clips over 2024 and most likely end up dropping the Federal Funds Rate back to 2.5%.
This graphic shows where the 10y/FF spread would be if it moved to a positive 50bp level and if we consider a 3% 10Y this means Fed Funds would have to be 2.5% or some 275bp lower than current levels:
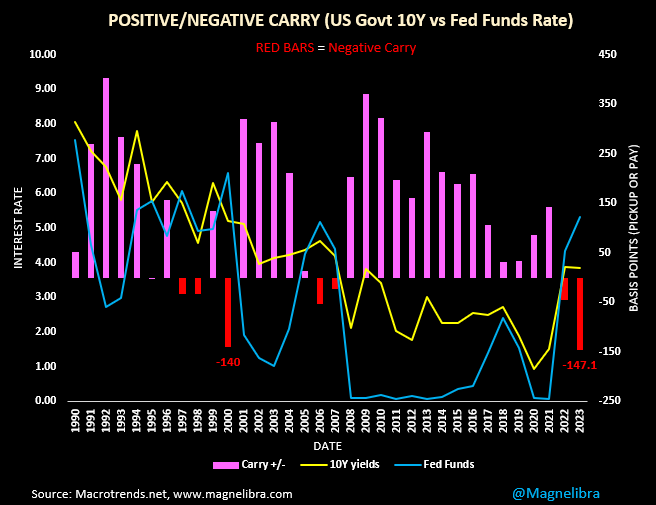
With 2023 now behind us we find ourselves staring at back to back negative carry years, something that does not historically bode well for risk assets and the global economies in general as the 10Y/FFunds spread ends 2023 at -147.1bp the largest gap we have seen in some 40 years. To say that the bond market is waging war on the FOMC Fed Funds rate is an understatement:
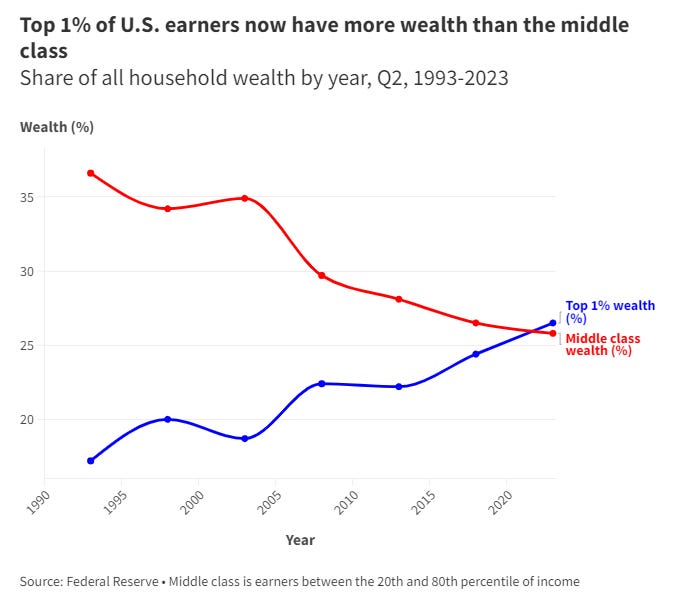
Another chart we want to point out and something that we believe is going to have major geopolitical ramifications going forward is the wealth disparity data. The recent chart which we have shown before and have included here demonstrates that a higher inflation environment, benefits the few at the cost to the many. The widening gap in the wealth disparity in the United States shows that the top 1% now own a higher percentage of wealth than the entire middle class:
We know that risk assets have been supported by the billions in risk free net interest pick up from the higher fixed rates, but more importantly risk has seen heavy flows exit the Reverse Repo Program which has more than offset the quantitative tightening (QT) the Federal Reserve has done over the course of 2023. We posted this chart displaying the net difference between the Federal Reserve QT and the RRP drain:
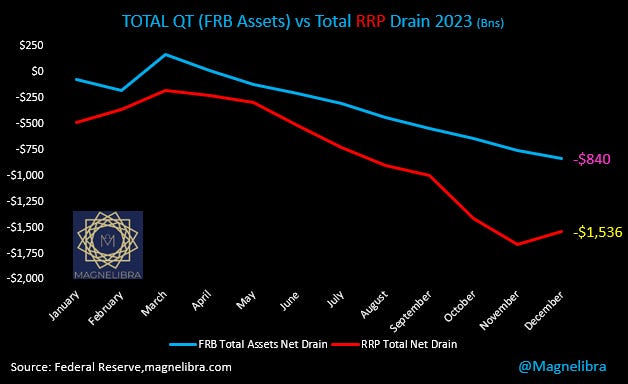
This is a positive addition of $696 billion coming out of the RRP vs liquidity withdrawn via the QT program. This for us is a major contributing factor for the equities performance this year, in addition to the AI mania boost of course.
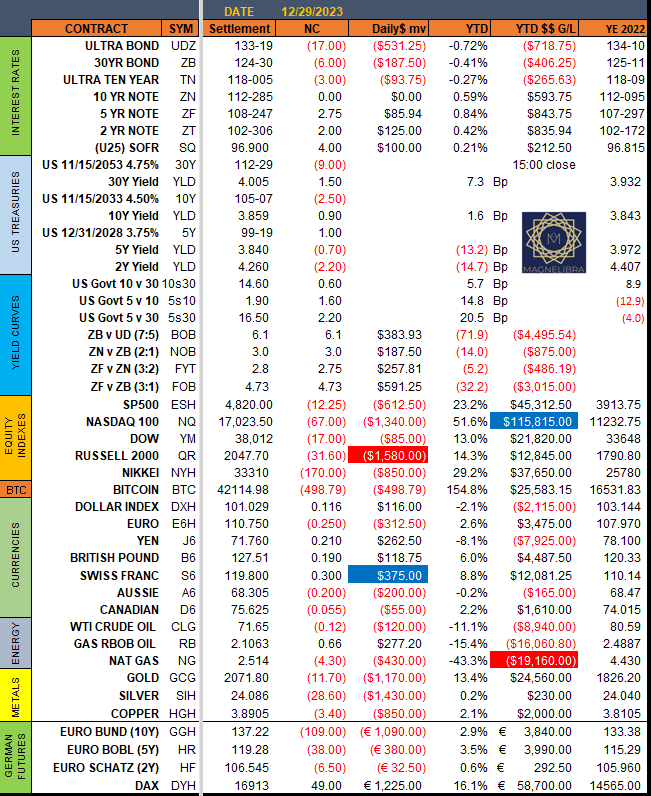
So when we look at where things ended 2023 let’s first look at our settlement page which is always included in our subscriber only posts:
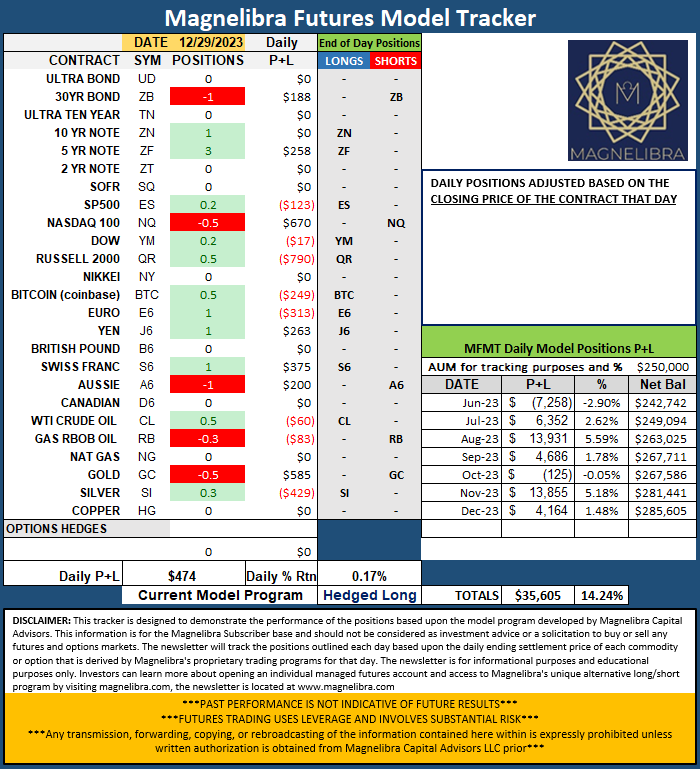
Also included for our subscribers is our Futures Model Tracker, where we try to provide our subscribers with our futures market sentiment and positioning that our commodity trading advisory employs. This is an educational only tool but it provides a nice mock up of how we view the various market segments on an individual basis and our overall sentiment long or short or neutral. We tie a profit and loss to this tracker and we review positions daily and adjust the tracker on closing prices only if there are any changes for that given day. This tracker is designed for a participant to follow along if they so choose and develop their own alternative futures trading strategy. We will continue providing our subscribers with this data and we will look to improve on the trackers 14.24% return profile it posted this year:
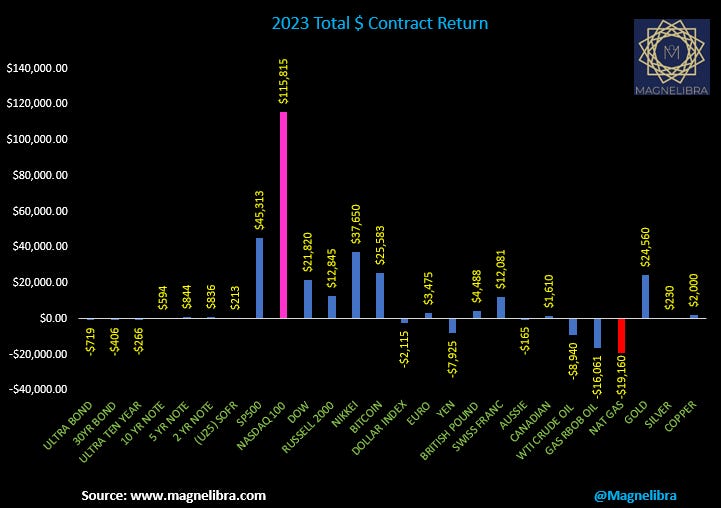
When we look at 2023 in regards to total performance of the markets that we cover, we present the data in total single contract dollar value return. The top dollar value futures market return came from the Nasdaq as it gained $115,815 and the worst performer was Nat Gas futures as it lost $19,160:
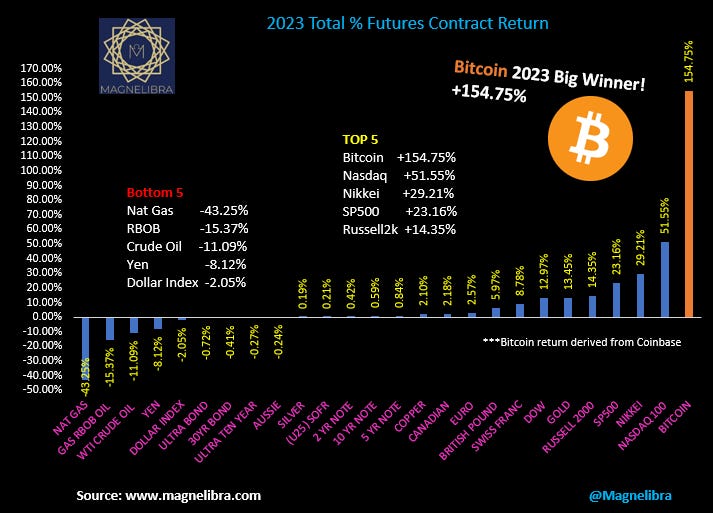
When we look at the futures markets we follow and Bitcoin for 2023 on a percentage basis we see Bitcoin was the big winner +154.75%:
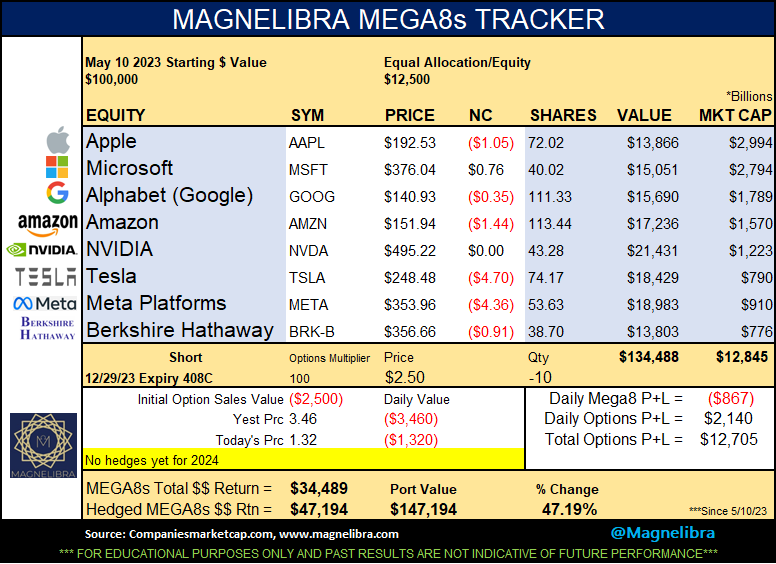
Alright, lets move over to the MEGA8s Tracker and see where they finished. So the MEGA8s tracker finished +47.19% on a hedged basis. Our subscribers receive this data on a daily basis and we offer our insight as to the use of selling call options to hedge a portfolio like this. This educational tool provides our subscriber with a daily performance update of this group including any hedges that we may put on to assist in any adverse move against these static long positions. Like everything we post its for educational purposes so that you can either follow along with how we look at things, or add your own elements or tools to try and track a certain basket of stocks. Our goal with the MEGA8s was to see if we can pinpoint a reversal in overall market sentiment in hopes of seeing a change in investor appetite for these high flyers:
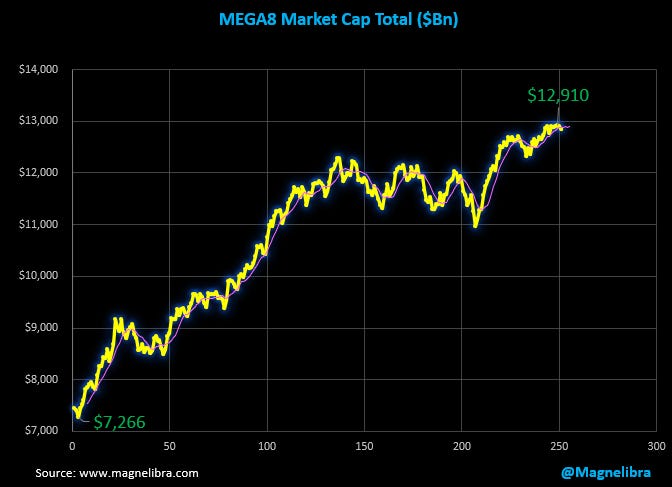
As a group the ended 2023 just below their all time market cap highs at $12.7T:
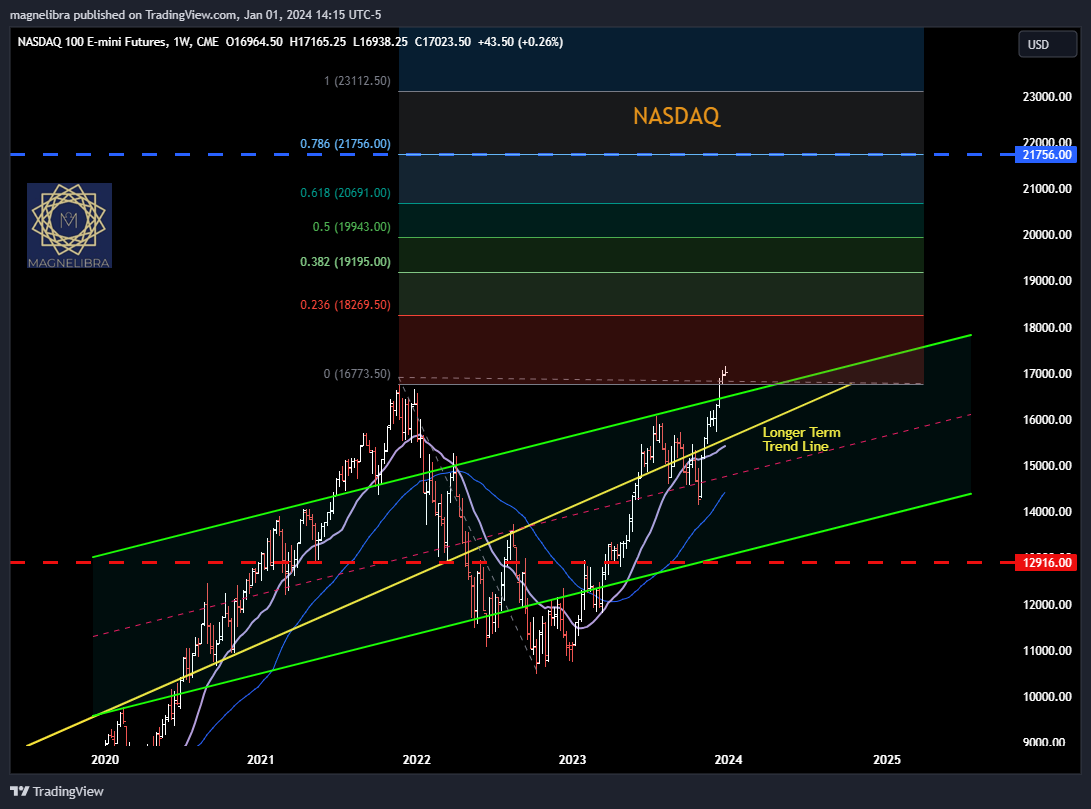
Ok onto a few technical charts and what we see in store for these various markets in 2024. First up the Nasdaq futures, we suspect a 25% return would see the 21756 area, which is also the 0.786Fib extension level, we may see this level sometime in 2024 but it is not our base case, only the top of our range. At the bottom end of our range is 12916. Obviously the incoming data each month will determine the path, if the economy can chug along and the FOMC keep rates steady, then we would suspect the markets to stagnate as well. However if they do cut rates then we could see a month or two long push into the 20k area which would then see selling due to reality setting in that the economy has taken a turn for the worse:
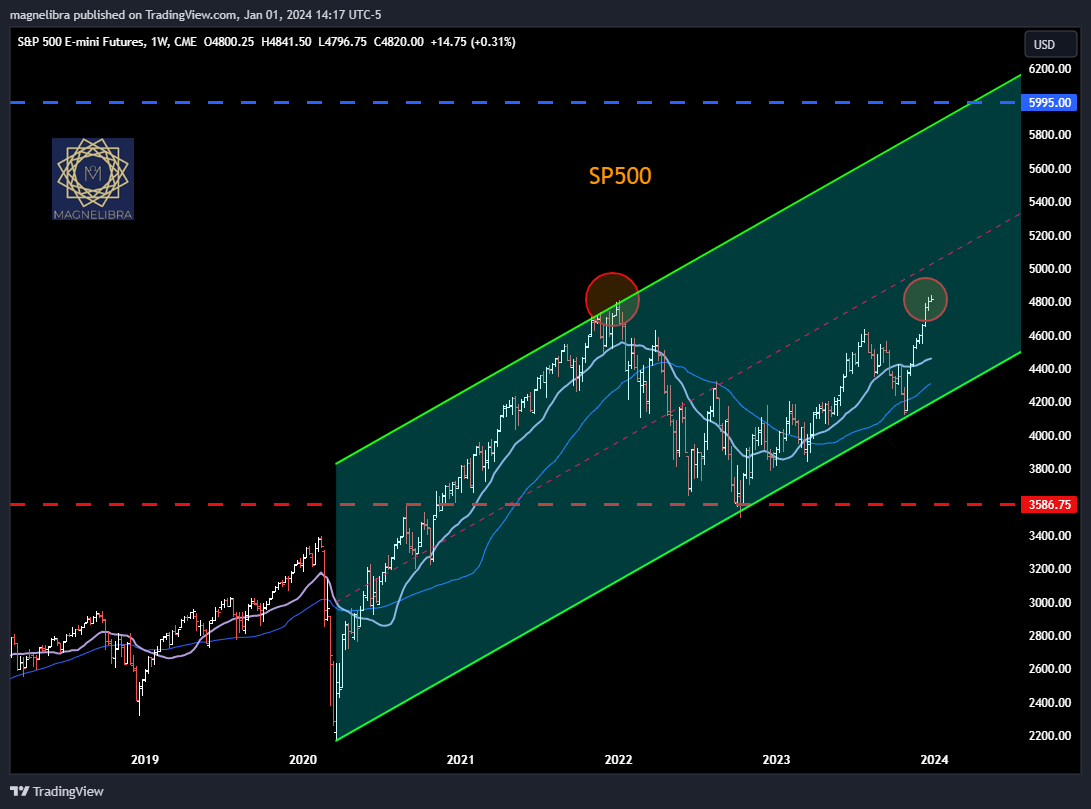
This same theme is set for the SP500 as well with 6000 on the high side and 3586 on the low side, all of which is data and trajectory dependent upon the FOMC in early 2024:
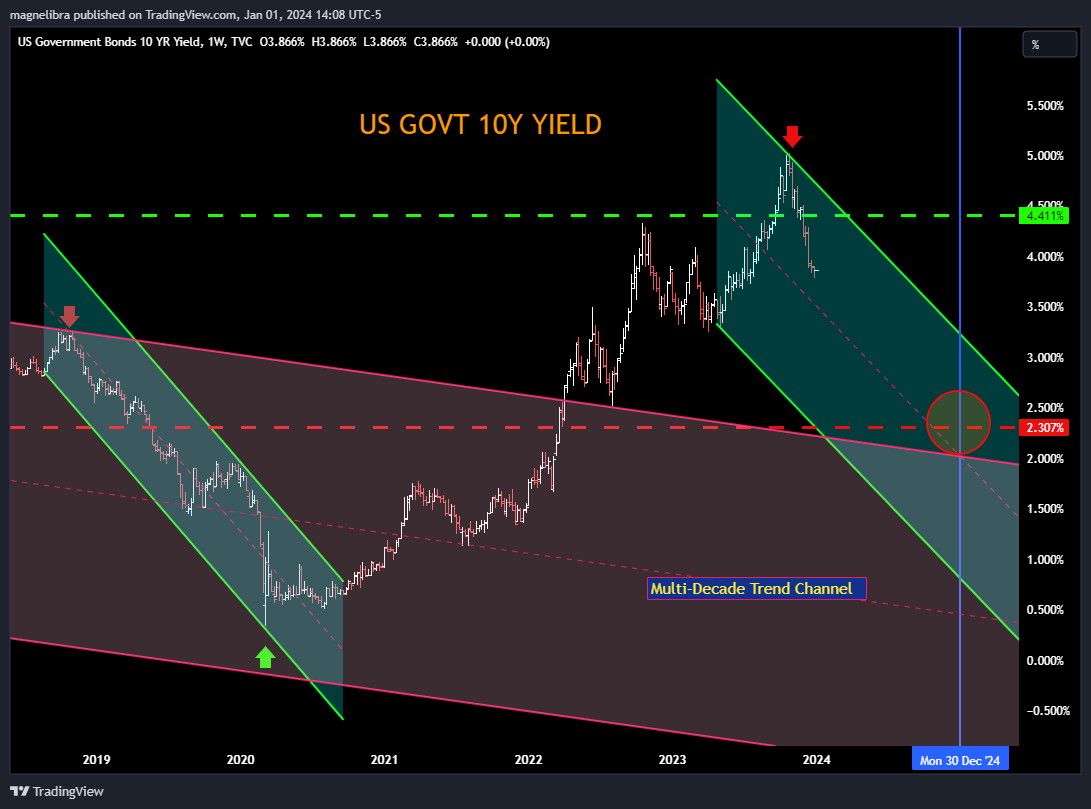
When we look at the Bond yields, in particular the 10Y we believe the decade high is in for the 10 and 4.41% should cap 2024 with the target being somewhere near 2.30% at the end of 2024:
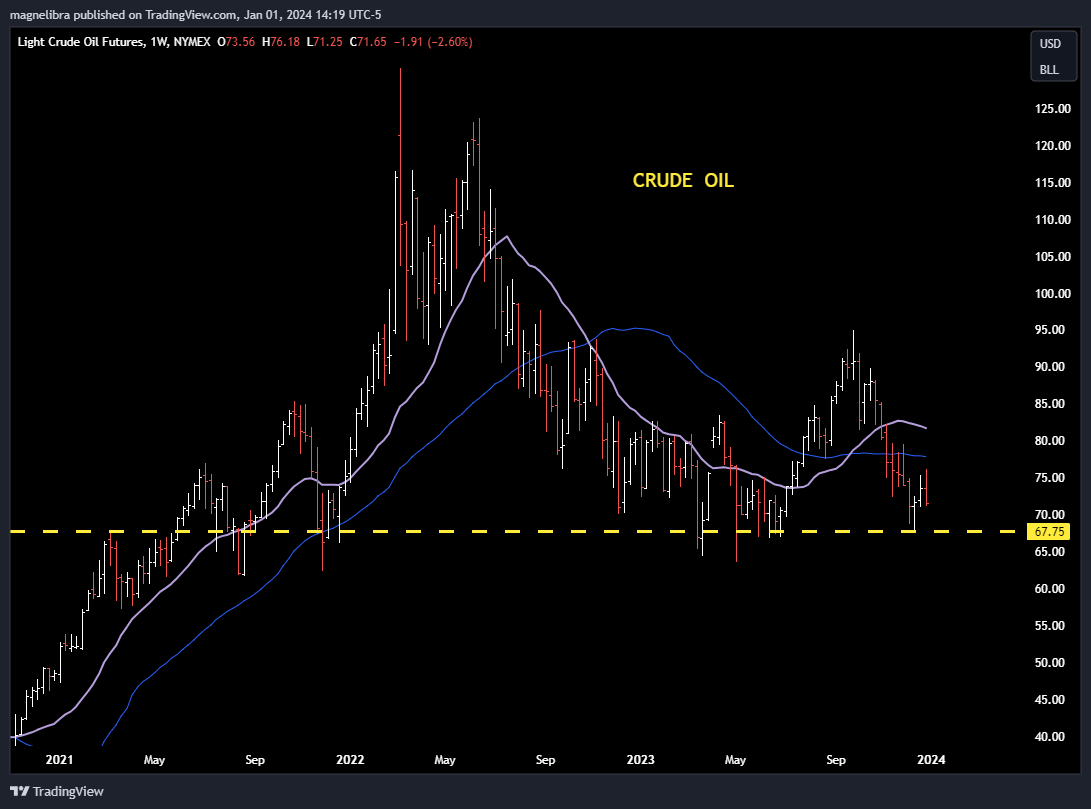
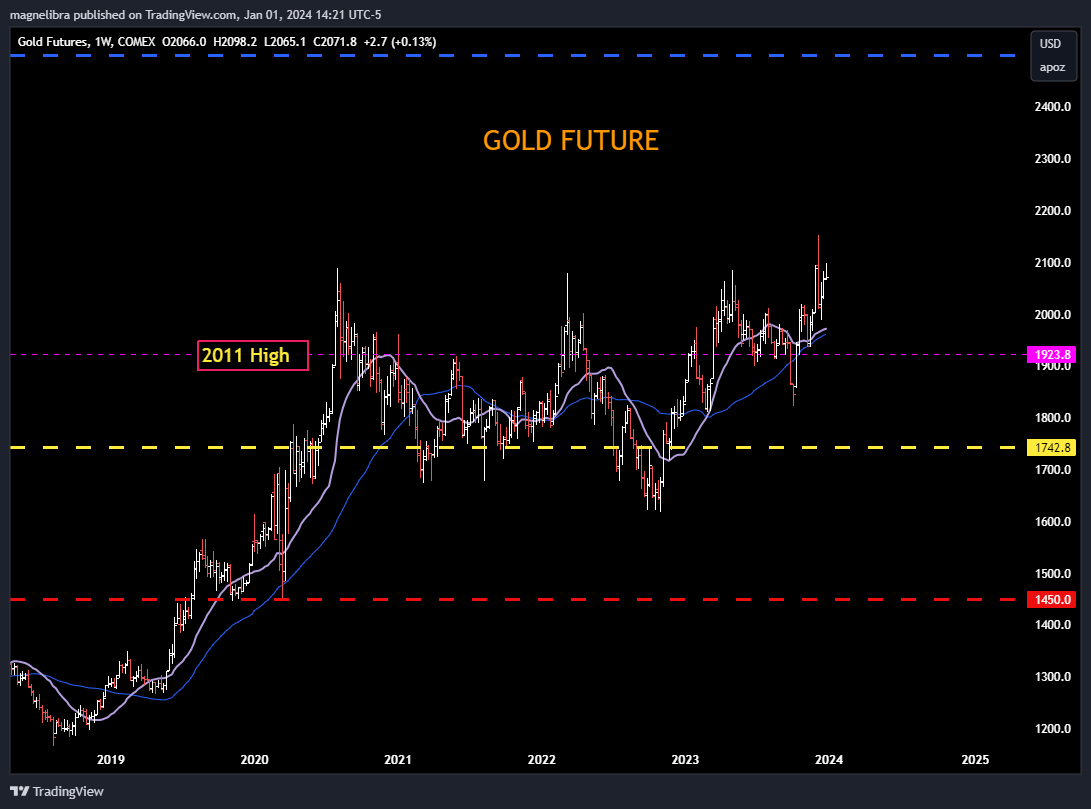
Let’s look at Crude and Gold for our last charts, Crude has a very important level in 67.75 and this is our base case bull/bear level for 2024:
As far as Gold it is highly dependent upon the FOMC and the economy, if the FOMC can refrain from cutting rates massively then Gold could trade to 2500. If the economy turns and the FOMC has to cut dramatically then we would suspect a drop below $1742 could see $1450:
We do not like to make predictions in regards to where the price of something will be by x point in time, its futile. Rather we look at markets from a range parameter perspective because honestly the markets are dynamic and fluid, and mainly data dependent. The trajectories of most markets will be highly dependent upon the monthly incoming data. This data will drive the FOMC decision process which will then drive market flows, which then dictate pricing. Traders biggest mistakes often come when the believe a given market should be at point “X” and then do not maintain proper risk parameters either with position sizing or exit strategies. Don’t get us wrong, you need a conviction, you need a valuation but we believe timing above all else is the key to a traders and investors success. One way we can combat risk is by position size and having a scaled in approach. This takes planning and proper market volatility assessments. It is not easy and its a reason why we employ so many different data points and analytics into what we do, because we believe you can never have too much data!
With that said, we wish you all the best in the coming year. We hope you continue to support and share our work as it is vital that we grow our audience so that we can educate as many people as possible as to how and why financial markets move the way that they do. We hope the insight, the data, and above all else that the conviction that we have shows up in our work each and every day. We spend a lot of time compiling this and we hope that if you can support what we do, you will and if not always share it with someone, or simply give it a like. Thank you to each and everyone of you and remember 2024 is about positivity, we view our realm as a binary construct of positive and negative and that each and everyone of us plays a bigger role then we think. We have the power to choose the output and its connotation will have a negative or positive reverberation, its up to you to choose the positive outcome…Let’s always try to focus on the positive and let’s see if we can shape our reality together!
Till next time…


