
5 Wave Major Top Formation Means Risk Reduction Mechanisms Required
We break down over a decade of major cyclical top wave patterns

Let’s start this letter off with a little review of where it is the risk markets were preCovid, to where they are today. Our best proxy for this is not the SP500 future, but rather let’s look at the Nasdaq futures and the move that led up to February 2020 and then through today.
We can call the period of run up from 2018 to early 2020 as WAVE 1 and then the subsequent move down immediately following the covid pandemic we shall call this period, WAVE 2:
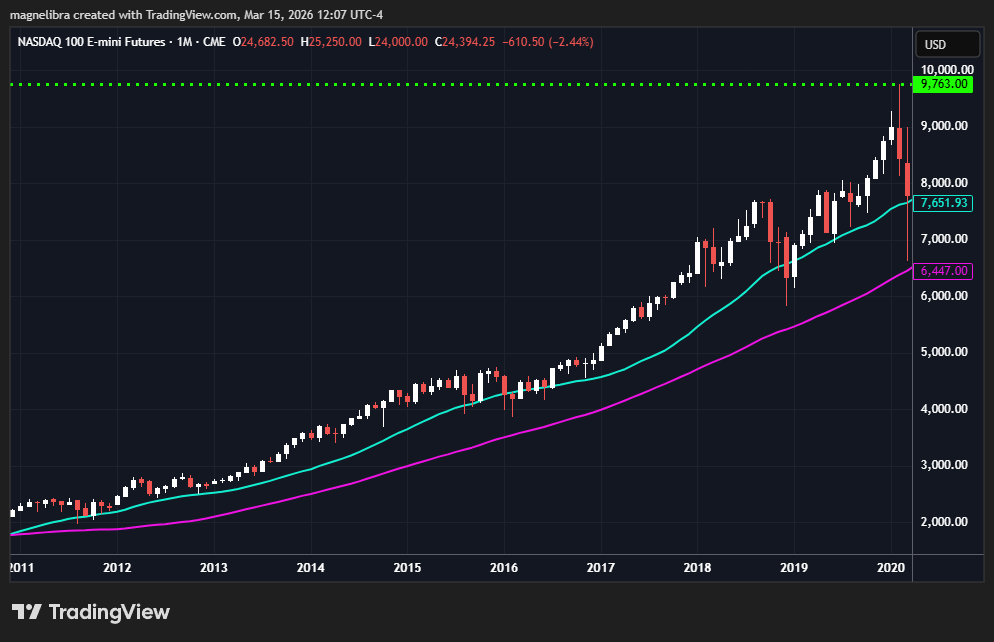
What we saw and what most investors would have felt up until preCovid was a move that what many would have considered a pretty decent run up for risk assets from 2017 to early 2020. Many would have assumed and probably correctly that the Q4 2018 top was a longer term top formation, but to only see a move to new highs right up to Covid. The Nasdaq moved from 6000 up to 9700 until the pandemic set in and panic selling dropped the index down toward 6600 a decline of 32%.
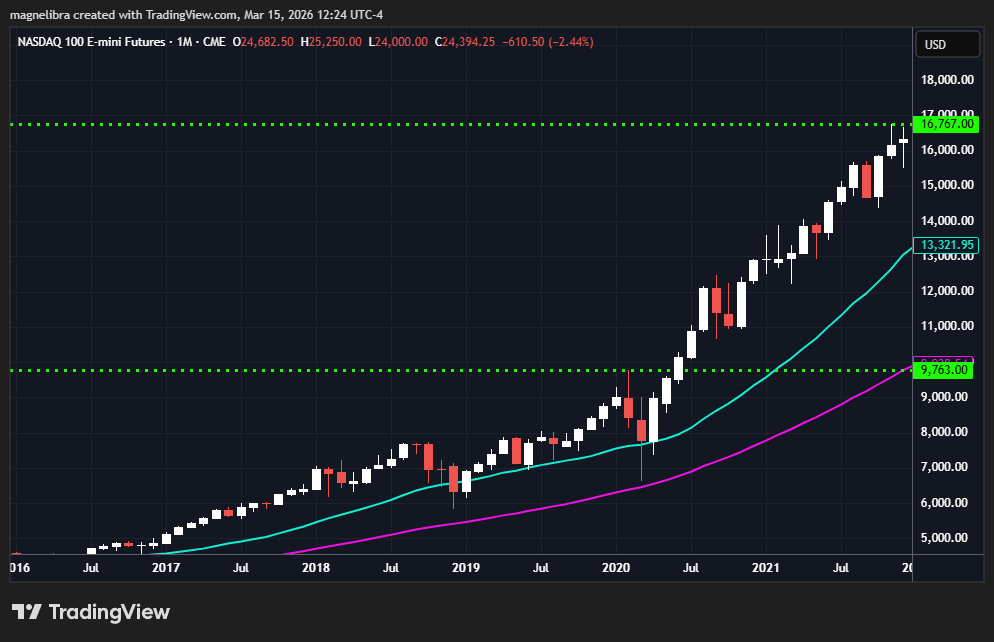
WAVE 3
Then the massive global monetary spigots were released and trillions upon trillions of new base money to be levered up hit the financial markets and boom, all of a sudden we see an explosion in risk asset prices, which looked at differently is merely a reflection of the devalued intrinsic value of the fiat currency knowns as the U.S. Dollar. The Nasdaq futures rose from the low of 6600 toward the highs near 16800 or an expansion of 1.54x:
If you want to continue reading the rest of our analysis and technical charts and data, please subscribe and if not, well we genuinely hope you reconsider as our goal is simple, to make you a superior student of the markets and unlock the real reasons of why assets move the way they do!
