

There is not much on tap in regards to numbers this week as we are hitting the dog days of summer here as families get in last minute vacations before school starts. We wanted to start off today’s note with a look at the massive increase in the global debt pile. What Magnelibra readers have come to know is that debt is our defacto money and without an increase in such debt, we wouldn’t be able to increase the fiat “value” of assets. With that said, we conclude that debt is money and since money is debt, you can certainly see why global central banks, US regulators and the controllers of our debt system, do not, repeat DO NOT want anything like an immutable blockchain ledger technology like Bitcoin…( you can’t just misplace trillions of defense spending)
Anyway let’s look at the global debt pile shall we:
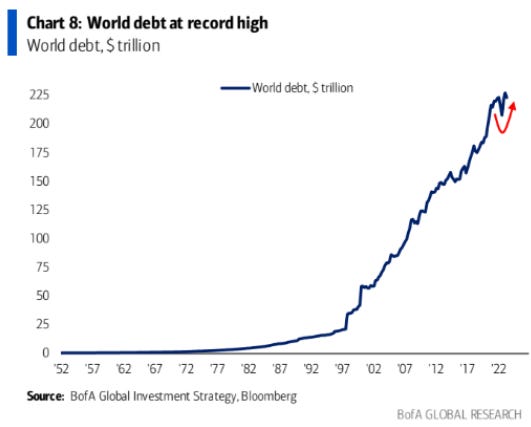
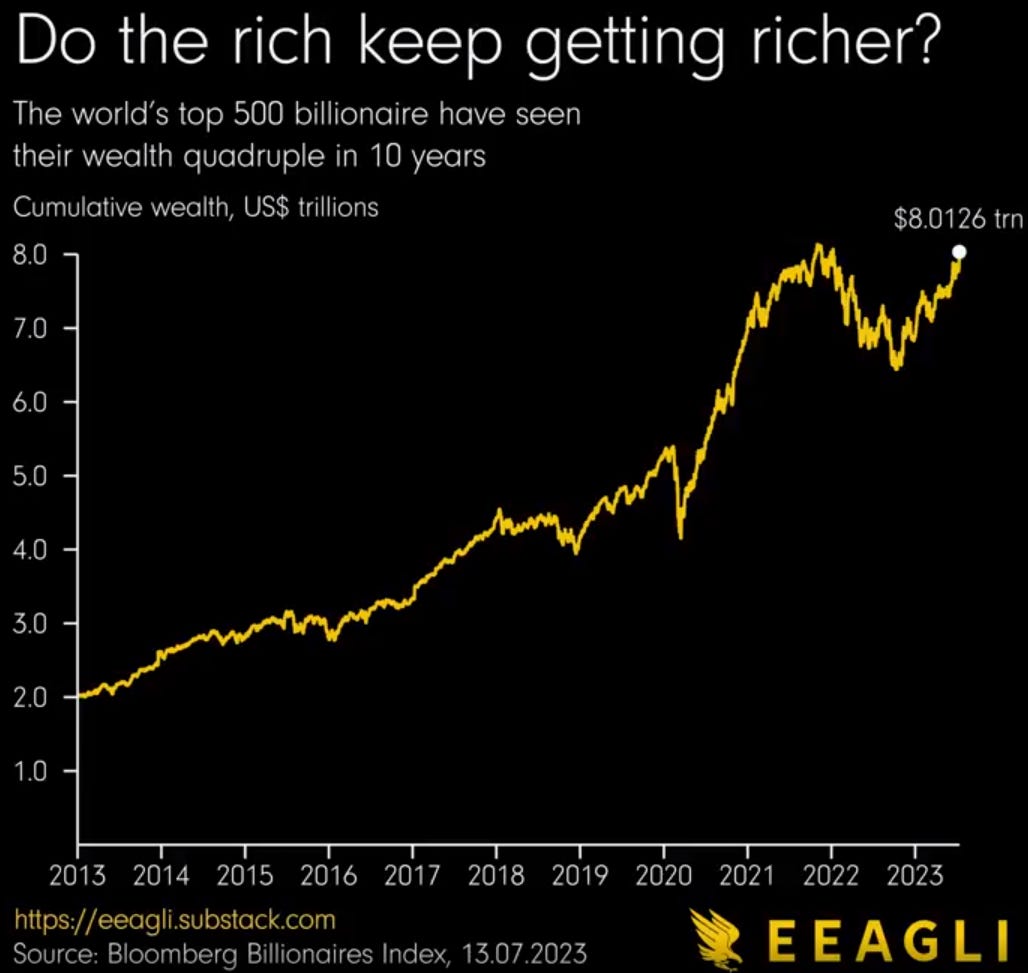
A mere 9x increase since 2000 and with this progression, its no wonder the billionaire class has virtually mopped up everything. Its the reason we see the massive inflation that we do, its obvious in this chart and to the victor (those closest to the central bank spigots) goes all the riches. Why else do you see the luxuries doing so well, everything has turned into a two tiered society…we used to make this very simple, those that can afford to eat out every day and those that cannot. We made this clear to someone on Twitter the other day when they said nobody would pay $9 for a Starbucks drink if they raise the minimum wages to then raise the drink prices to pass this extra cost to the consumer…our reply was simple, those paying for those drinks do not care about the price of the coffee, IT DOESNT MATTER. Not when you see charts like the 9x juicy one from above! This chart below should drive home the concentration of wealth multiplier that is a direct result of the prior debt expansion chart:
Secondly look at this debt securities chart:
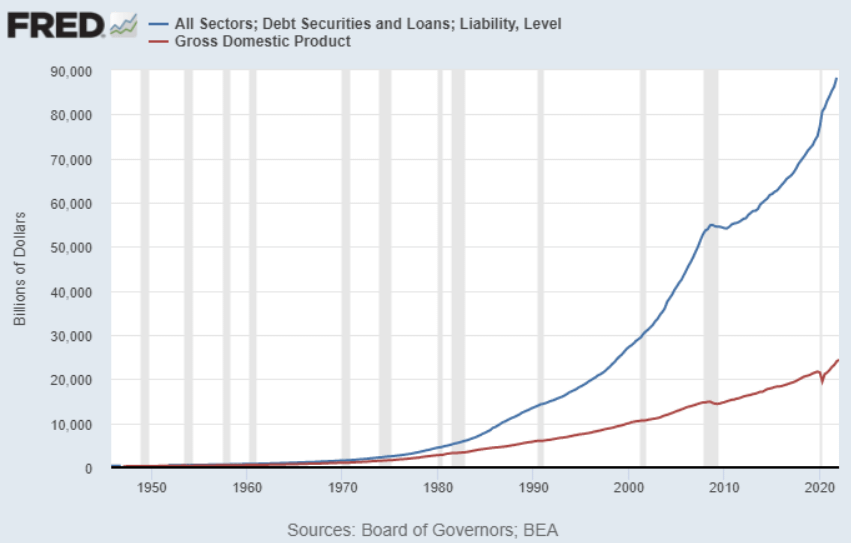
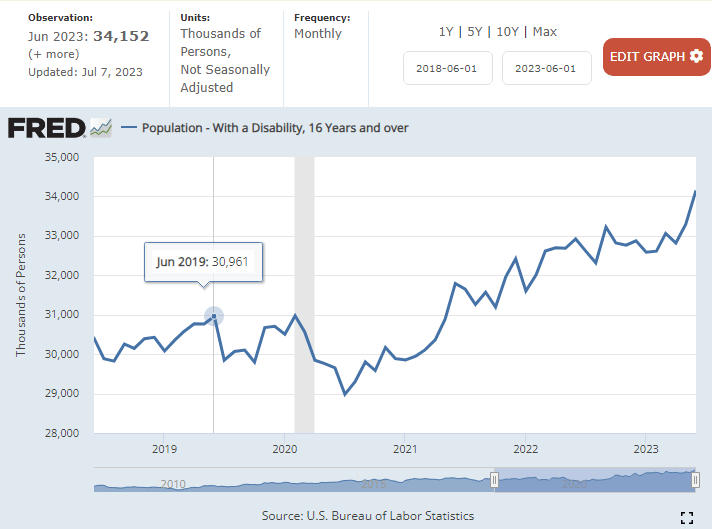
Another 9x run since 2000 (correlation anyone?) Yet do you see the GDP (redline)? This GDP is the output that is supposed to be able to cover our debt liabilities…it should be obvious by now how big the Ponzi scheme has gotten. This is 1929 stuff, this is a very big deal and eventually I think you know what happens. Money becomes devalued, yea the wealthy can buy everything, but what happens when the commoner stops participating, starts asking for Socialist style handouts, starts going on let’s say disability, which in this next chart, you can see how so many are actually affording things (barely) as the ranks of disabled has grown, in just 2 years this number has risen by 5.17 million or 18%! By the way, you want to know where all those excess jobs numbers has come from and why unemployment isn’t 8% instead of 4%? Its because 5.17m are no longer counted as “unemployed” but rather “disabled” which exempts them from the unemployment count!
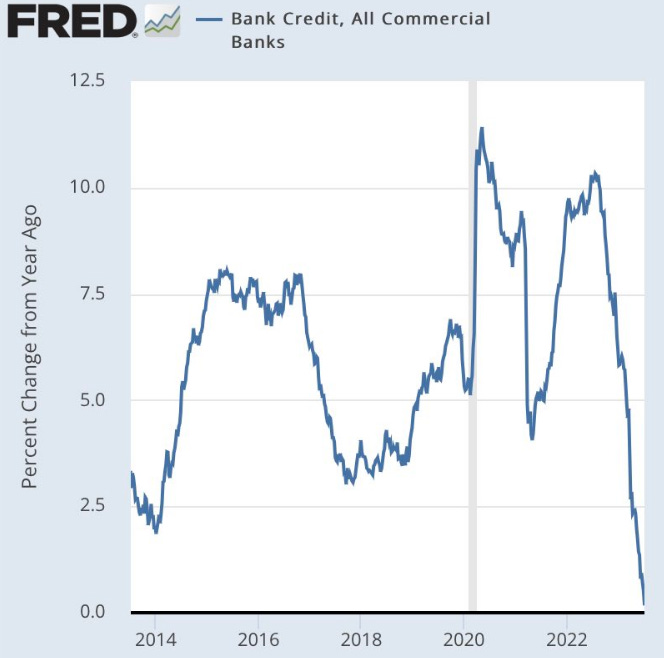
Now take a look at Bank Credit, it is in absolute crater mode and this is where the commoner is going to get destroyed in the next downturn as funding gets snuffed out and no we do not care that 70% of mortgages are 4% or below and how this is restricting supply of available homes, rather know this, that INTEREST RATES DO NOT MATTER, if one loses their job and cannot pay:
Nobody can say for certain what the future holds, but one thing seems very clear, we are in the midst of an absolute consumer re-evaluation of monetary sustainability. Not only that, but the financial environment, the absolute over extension of asset prices and the ability to continue this ascent is improbable without two very succinct inputs, that is higher and higher debt levels and the sustainability of global US dollar utility and globalization. For the latter its no wonder the push by NATO is so strong in Ukraine, its not about Ukraine, but more about US dollar dominance. We know the BRICs are coming on strong and we know that if the BRICs actually allow the default of IMF loans to then be able to get a BRIC loan, that a major conflict will most certainly ensue. This is what worries Magnelibra as we understand all historical wars as banker wars and with the two tiered threat of BRICs and Bitcoin, or B-Squared, the US dollar and its corresponding debt hoard, must be protected at all costs!
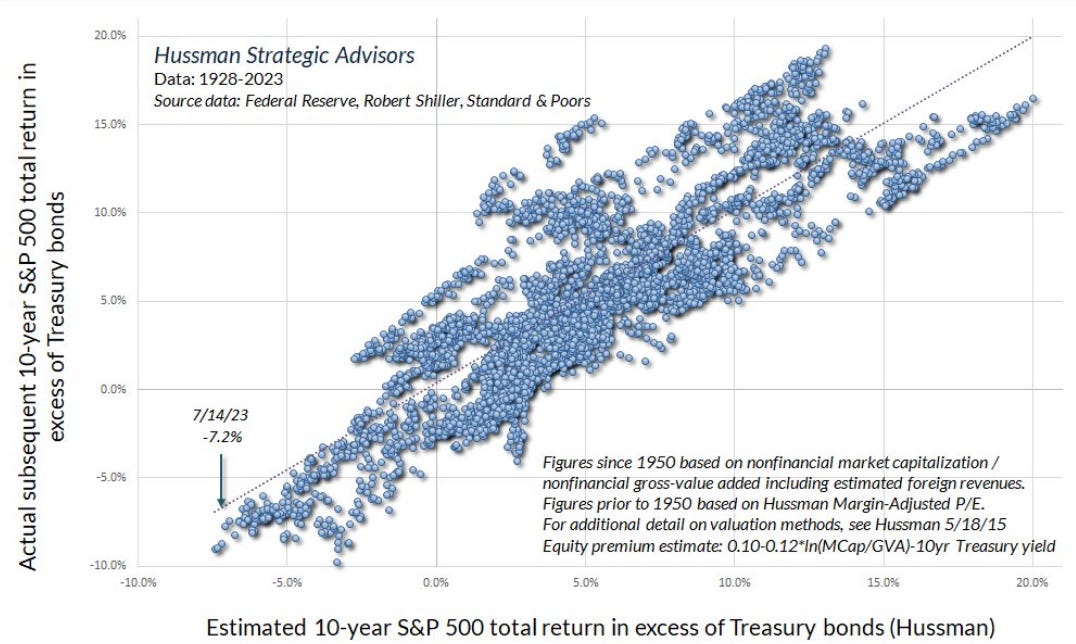
With this in mind, its no wonder JHussman posted this chart of the subsequent 10 year S&P500 total return in excess of Treasury bonds, which is now at the far tail end of the linear projection, sitting at a -7.2%, this should scare the hell out of all investors:
So keep digging, keep reading our work and keep ahead of what is coming down the pipes, yea AI sounds great, but in reality, it will be censored and even still is far from perfect and might never be able to accurately contextualize, but time will tell. Look AI cannot print food or jobs for that matter, and in the real world where the majority operate, its jobs, its opportunity and its real value for their work that matters the most!
Alright let’s move on to this great Bitcoin chart and if you don’t follow this guy you should:
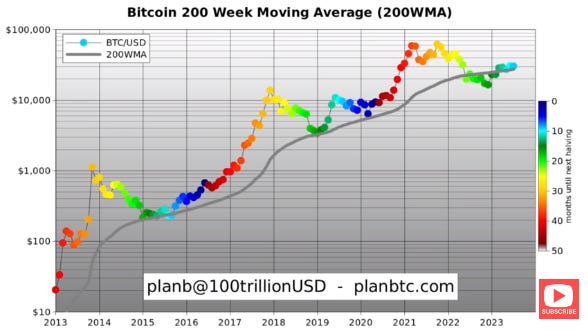
We view Bitcoin as the future of all money in some way but we aren’t exactly sure how it will play out, nobody is, but its kinda like being an atheist, we get it but if you aren’t really sure, or 100% sure, wouldn’t you rather at least participate in some fashion just in case you are wrong in the end??? With the halving coming in 2024 and with addresses and hash rates increasing, we can only say that the risks of not playing are far worse than tossing a few bucks in just in case!
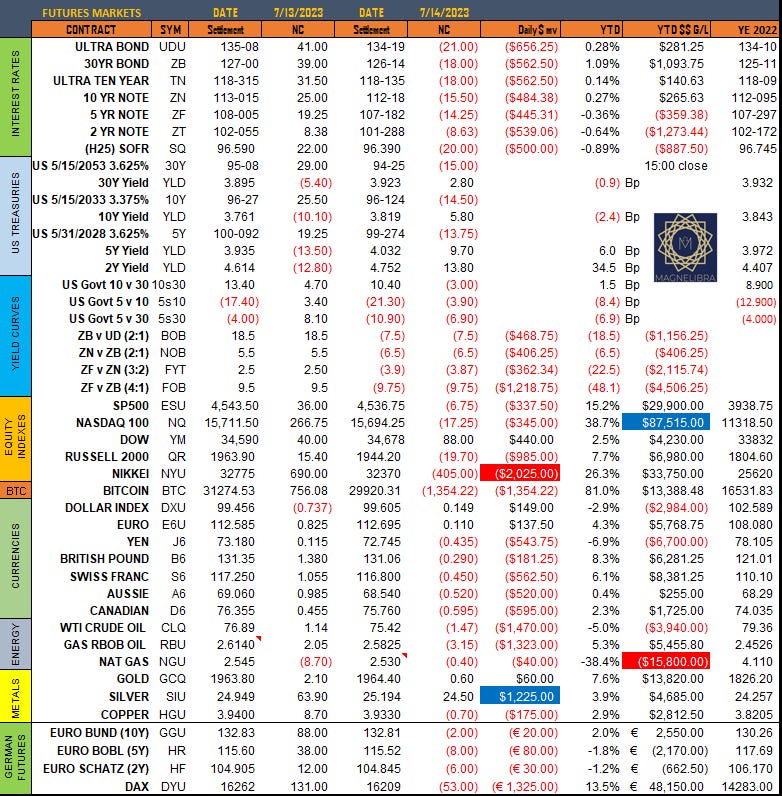
As far as last weeks settles here they are as Thursday’s risk on, was somewhat dampened by Friday’s profit taking. We included Thursday as we corrected the EU data:
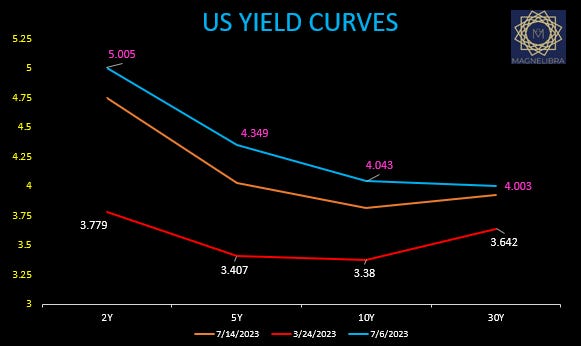
The US yield curve seems to be in a range now and we have the chart here:
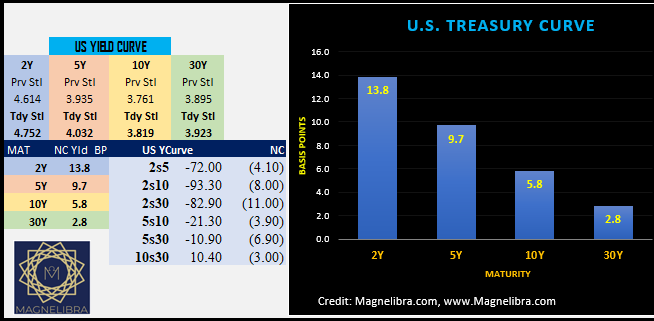
As far as Friday’s US yield curve picture for settlements, here is Magnelibra’s data showing the 2Y the weak link on Friday and curves flattened across the board:
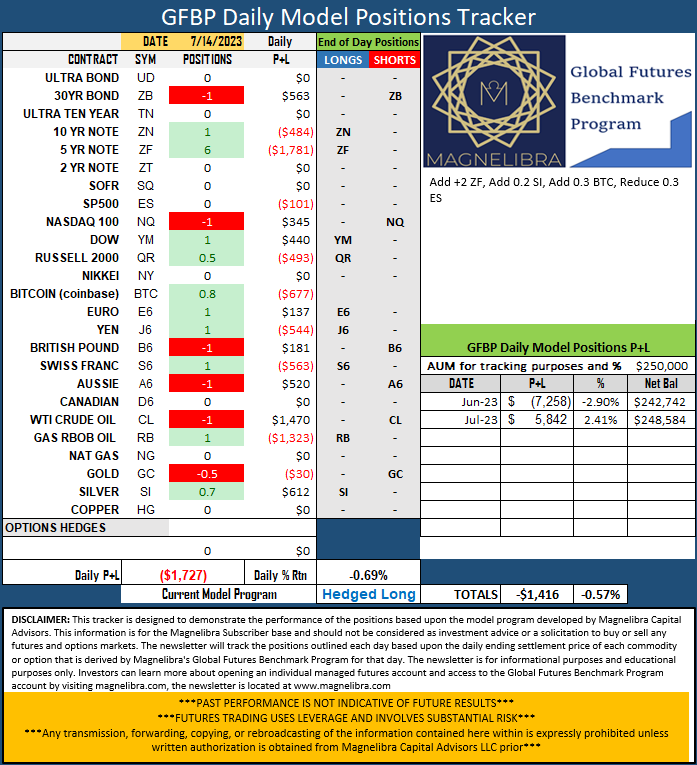
As far as the GFBP Tracker we have a few additions/subtractions to note:
When we look at the equities and the Magnelibra MEGA8s we can see that the option hedge ate up a lot of the up move in the out rights but as we noted last week, this is a tutorial on hedging and we know everyone’s appetite for risk varies and you can tweak your hedges as you see fit. We added the 382C hedge for next week expiry:
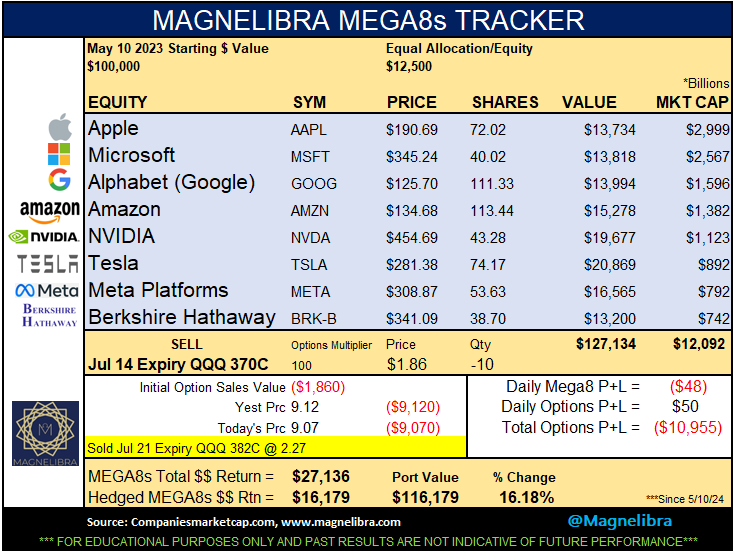
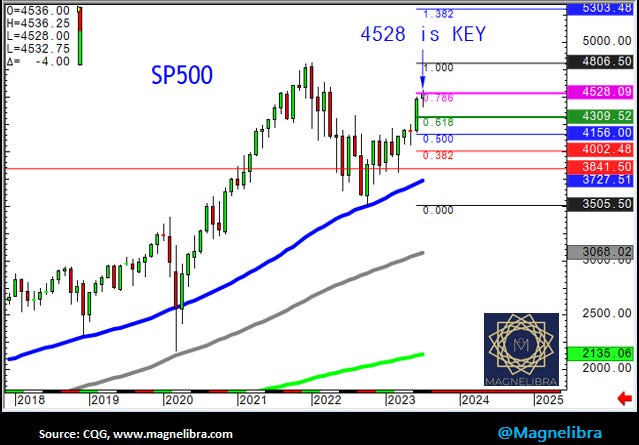
Just note that the MEGA8s are + $1.09 Trillion since May 10th, what a run! The technical charts are running into some resistance in equity land right now and we can show this with the SP500 futures chart. This monthly candle is key and is right at the 0.786 Fib Retrace level which historically is massive resistance:
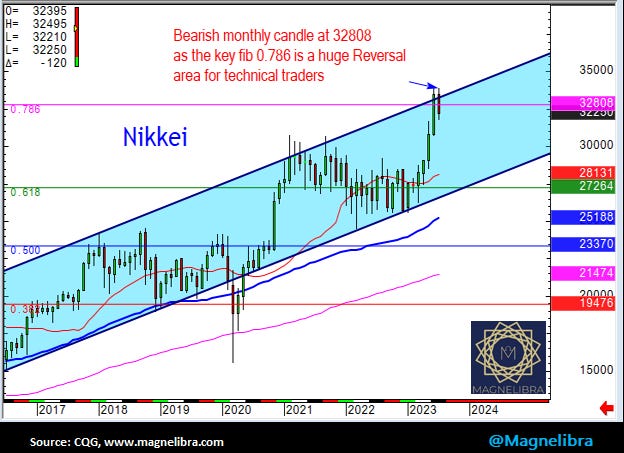
As far as the Nikkei, we are seeing a similar set up for the monthly and you can see the uptrend channel continues to hamper further probes higher right now:
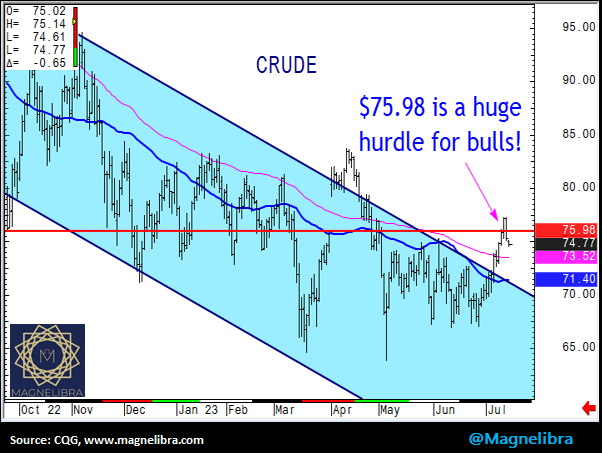
We also wanted to highlight Crude where the August futures are once again hampered by the $76 level:
Finally, we wanted to let our readers know that Magnelibra’s proprietary excess liquidity metric sits right around $1.7T and with the RRP now dropping toward this area, we have to present a word of caution for long only equity players. This RRP fall off is consistent with liquidity being removed from the market place and we all know, especially in this higher rate environment, access to good quality liquidity is paramount, so we will be eagerly watching the volatility in the equities and in the MOVE index as well for any hints of stress as we get closer to that $1.7T marker in the RRP, the latest FRB data is shown here:
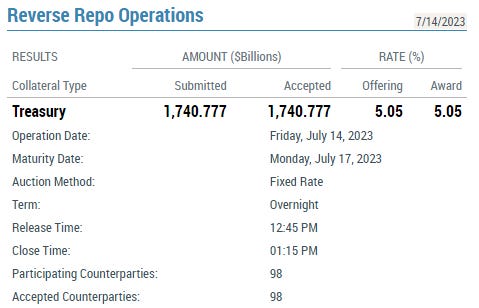
So just about $40Bn away, in today’s world that’s nothing, so we shall see how things start to rattle around. We will also be watching the BOJ for any tinkering of their YCC as well as any upticks in cluster bomb usage out of Ukraine, our sources tell us Ukraine has started using them and no doubt Russia will be bringing this up in the next Security Council meeting and it will fall on deaf ears, which means Russia will most likely respond in kind…things are getting very unstable at this point and we know pressure is on Kiev to make headway or risk funding, at least that is what we are hearing…ok till next time! BTW we made this article a freebie, just to show the masses how we process data and interpret for our readers. Please share our work, think about supporting it and we hope you learn from the work that we put in. A knowledgeable society is a powerful society and its why we do what we do!
DISCLAIMER: For educational purposes only. This is not a solicitation to buy or sell commodity futures or options. The risk of trading securities, futures and options can be substantial and is not for everyone. Such investments may not be appropriate for the recipient. The valuation of futures and options may fluctuate, and, as a result, clients may lose more than their original investment. Nothing contained in this message may be construed as an express or an implied promise, guarantee or implication by, of, or from the author Michael Agne owner of Magnelibra Capital Advisors. Magnelibra the CTA and its Global Futures Benchmark Program may hold long and or short positions in the various futures and markets that Magnelibra covers. We will never claim that you will profit or that losses can or will be limited in any manner whatsoever. Past performance is not necessarily indicative of future results. Although care has been taken to assure the accuracy, completeness and reliability of the information contained herein, we make no warranty, express or implied, or assume any legal liability or responsibility for the accuracy, completeness, reliability or usefulness of any information, product, service or process disclosed.
ALL RIGHTS RESERVED 2023