

Investors will now be focusing upon the employment report, which is slated for tomorrow and we expect the usual Bidenomic optimistic boost followed of course by revisions lower later on. This has been the trend and why should we expect anything different?
We know payrolls is the next shoe to drop and we have been waiting for consecutive negative prints, this will solidify the end to the FRBs rate hike cycle. JPowell and Co. like to pretend they are here for maximum employment and price stability, when in reality we know they are in the business of expanding their balance sheet across decades, trillions of dollars at a time. We suspect this next QE cycle will see the FRBs balance sheet >$10T, they know it, we know it and our data confirms that this has been their long standing position.
We have often shared this chart showing their 12% annualized growth the last 24 years of their balance sheet assets and its no secret, yes this is the true source of inflation and the real inflation foundation. Well we have updated it to include this years data and for the first time we have seen a double digit drawdown, hitting 10.36% thus far for the last two years combined. The 2015-2018 drawdown hit 9.62%. However even with the last two years of balance sheet run off, their annualized growth rate is still a whopping 11.25%:
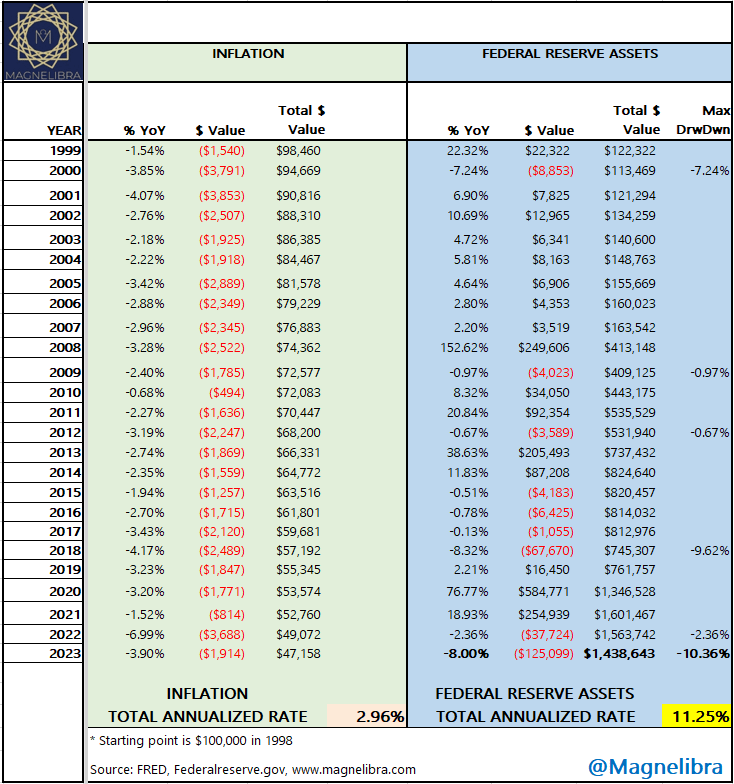
In this data we also include the real inflation rate as it pertains to the loss of value since 1998. The rate that we see is an annualized 2.96% which after 25 years has turned that original $100k into $47k!
What strikes us as odd is that sometimes and especially in a fiat world, the more you have of something the less value it has. For instance zero fiat money is just zero, worthless, yet sometimes as in the case of Weimar Germany in 1924, 100 million Deutsche Marks is also worthless. The point we are trying to make is both extremes of the number line from 0 to ∞ can at times both be worthless. This is the problem of fractional reserve central bank fiat money systems. Eventually no matter how you try to finesse it, eventually it all becomes worthless. The FRB is at that point of deciding how it slows the worthless tide, yet they are stuck between having to always use quantitative easing but in reality all this does is devalue current dollars that exist and it creates a massive amount of new debt and new interest to pay. All of this accelerates the singularity, that moment in time where it all just becomes worthless.
This is why the Bitcoin network and decentralized technology is such a grave enemy and we saw Jaime Dimon of JPM Chase once again in front of congress try to devalue Bitcoin stating this:
“I’ve always been deeply opposed to crypto, bitcoin, the only true use case for it is criminals, drug traffickers, money laundering, tax avoidance. If I was the government, I’d close it down.” -Jaime Dimon CEO JPM Chase
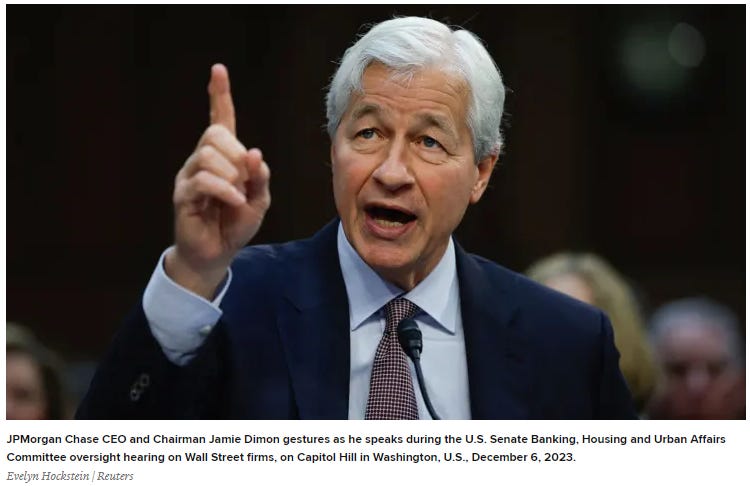
Well we all know the US dollar and the Euro are by far the asset of choice for those Mr. Dimon speaks of. The reality is Bitcoin immutable, trustless ledger based technology is superior in all facets and especially at transfer ability and as a store of wealth. Every wallet can be tracked and quantified and the reality is, you can’t play the kind of monetary rigged games that banks and Wall Street employ. This is the real reason he abhors it, we know it and now you know it.
Anyway let’s move on to a couple of charts, the first one is the spread between the US govt 10Y and the Federal Funds rate. We have seen nearly a 100bps of flattening over the last month. The bond market has gone from higher for longer to cutting rates as quick as possible. Sorry all this is stating is that there is really no liquidity in the markets, which is scarry when it comes to the bond market because it is larger than the equity market. What we want our readers to understand is that this entire move is the fall in yields for the 10Y going from 4.9% to 4.13% while the Fed Funds went from a ceiling of 5.25% to 5.50%. The markets irrational move up toward 5% and back down to 4% is an indication of both uncertainty and even worse an absolute lack of liquidity:
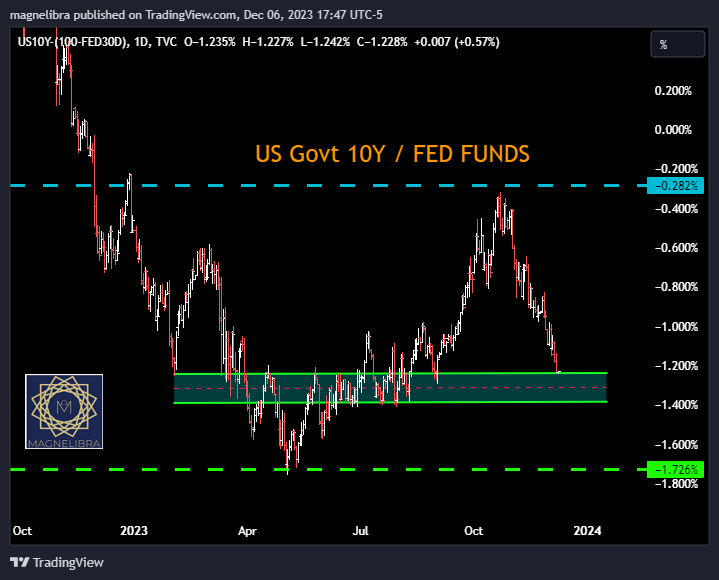
Anyway the area that we have highlighted should put a pause to the markets for now, basically the US bond market players are expecting 100bp to 150bp in cuts next year. We view this as highly unlikely and it would require an economy that absolutely falls off a cliff and unemployment shoots up higher than 5%. So maybe this can happen, but the way Powell has been pounding the sand on inflation and higher for longer, we doubt it. The reality is there are $3 trillion plus in excess reserves still and despite CRE having its issues, the system is flush with reserves and the only problem becomes, who has access to those reserves. The higher interest rate environment is the natural way of things, ZIRP or zero rates is not, that is an artificial subsidy that should have never transpired. The likes of Jaime Dimon and the rest of the defunct old way of commerce banks need it because of their business model, yet in reality, all it does is skew risk and allow for massive, misallocation of resources and capital.
Ok let’s move on to our trackers for our subscriber base. First up yesterday’s settlements. Please note the adjustments on the YTD numbers, we brought them in line with a few other data sources:
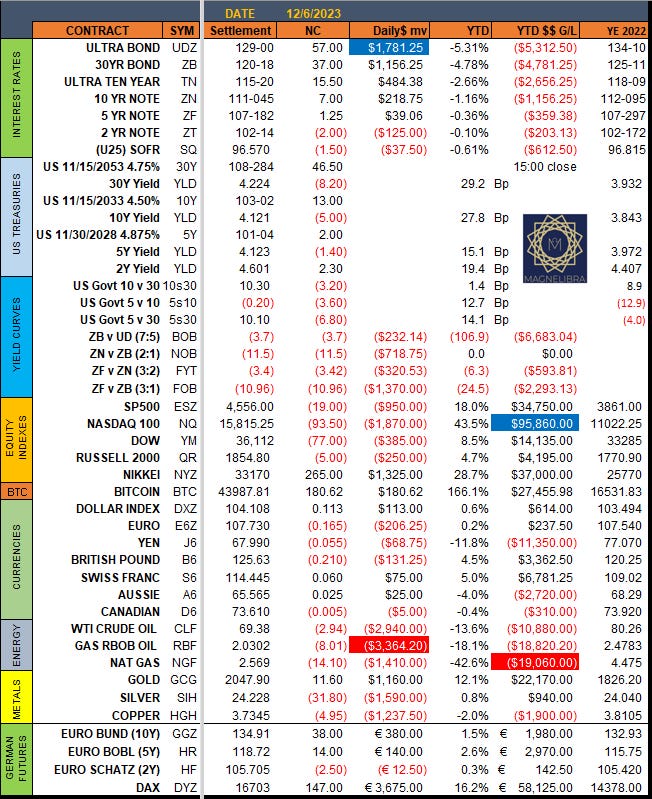
The energy sector continues to get pounded as we noted below $73 could open the spigots and it sure has! When does it spill over into metals and equities?
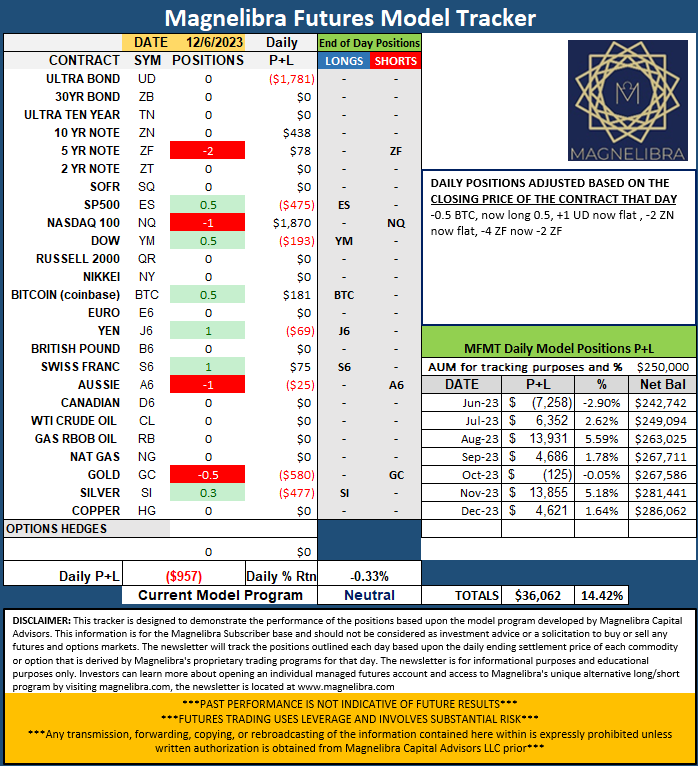
When we look at the Futures Model Tracker there are a few changes as fixed income has now moved to a negative outlook and the tracker as a whole has moved to neutral from a hedged long position:
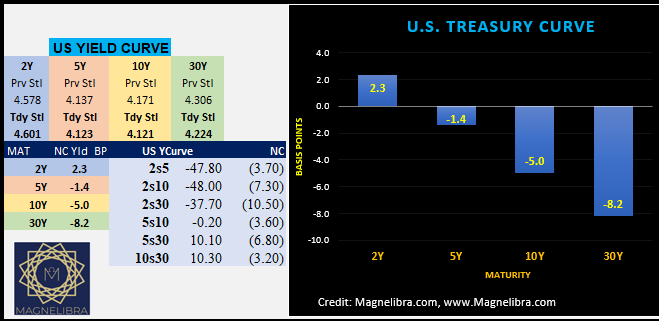
When we look at yesterday’s yield curve, we can see the long end of the yield curve continues to outperform as the 30Y bond was -8.2bp while the 2Y was + 2.3bp:
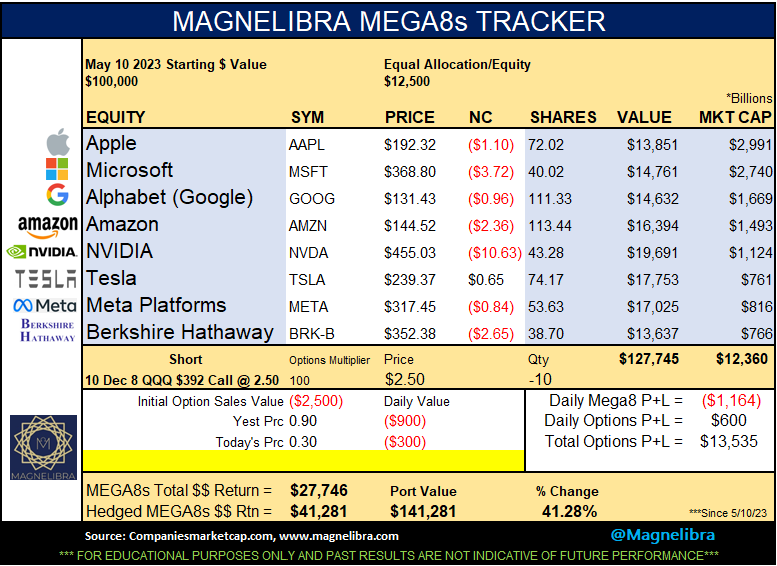
When we look at the MEGA8s, we are starting to see a bit of a transition but we continue to believe the AI mania will be used to push this group well into the future. The option hedge is helping out the tracker this week to offset some of the underperformance of the sector. We will cover this on a close below 0.20 for the 392C and re-short a call option with next weeks expiration:
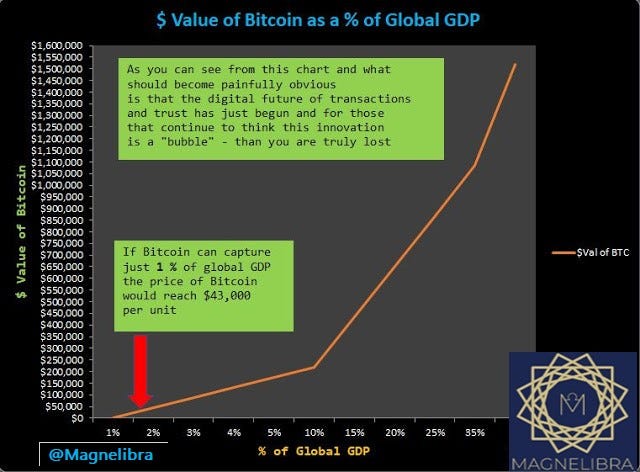
We also want to reshare our Bitcoin valuation chart which we posted yesterday which came from an old note we wrote 6 years ago. We figured we will continue to stand by this call for Bitcoin to be valued based upon its adoption and overall transaction value vs total global fiat GDP. We believe we are the first to ever post a valuation for it like this and thus will share it once again with you here. Honestly we have touted Bitcoin as a great investment vs the over production of fiat currencies and we continue to believe this to be the case. We informed so many since 2013 and on and we remember the days when BTC was just $200 and our associates called us crazy to think it had any value. Well, we knew it had value then, and we know it has value now and the more central banks print, the higher the value will go, its just math!
We leave you with two links to interviews that we believe our readers will benefit from, one is Michael Saylor of MicroStrategy the other Lawrence Lepard of Equity Mgmt. Assoc., another voice of advocacy for the adoption of Bitcoin.
Michael Saylor Case for Bitcoin
Ok that is it for now, please share our work, please like it if you can, recommend it to others, support it if you have the resources and as we state time and time again, the content, the information and the way we convey it should allow for the type of continuing education that is truly priceless. For a mere 67 cents a day, you get a lifetime worth of continuing education, what is your knowledge worth? How much can you extrapolate from what we teach? Anyway we decided to make this a freebie to expose our work and not hide it behind a paywall! Somethings are just too important!