
All Eyes on Nvidia as Retail Front Runs Earnings
Subscriber Updates and ATM Straddle Tutorial

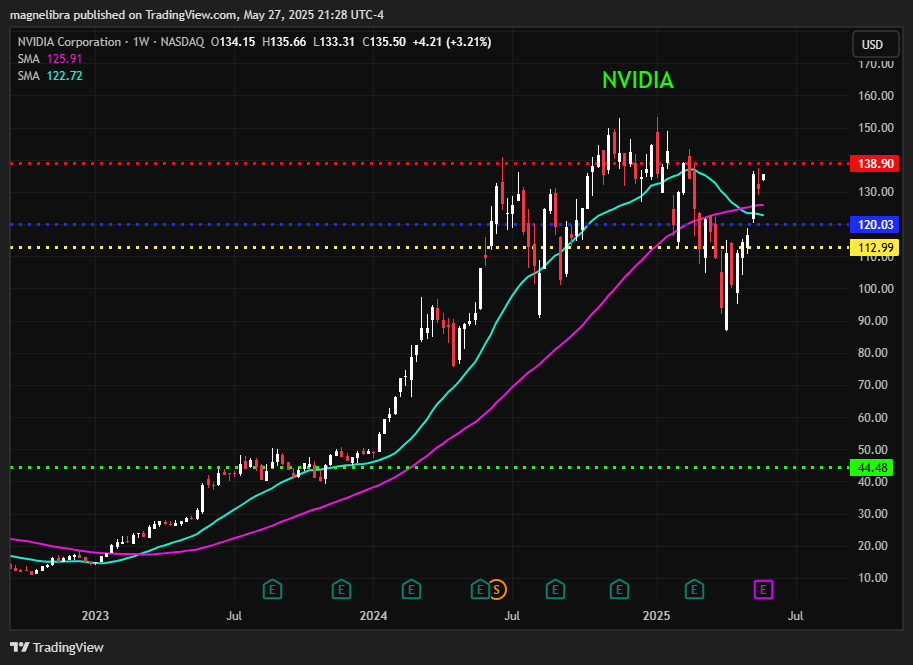
Markets path of least resistance today was higher, and no the EU delayed tariff is certainly not the reason for the rally, more retail levered bets on a Nvidia earnings beat more likely. Nvidia posts earnings tomorrow after the close, so let’s take a look at the options break-evens. With Nvidia trading around $135 the ATM $135 straddle for this Friday’s expiration is around $9.40, implying a move of 6.9%. Heavy call interest the whole way up from $100, obvious straddle plays on the bucks $120, $130 etc. Market makers most likely want to see a move below $120 area, so will see, either way the ATM straddle seems like a good play here. You basically need a move above $145 or below $125. This way you take the direction out of it, you just want a decent move either way, which we most likely will get. Here is the chart weekly resistance and Fib Reversal/Target level is $138:
Let’s go into a more in-depth breakdown, to provide a comprehensive overview and understanding for our readers:
A straddle involves buying both a call and a put option at the same strike price, here $135, costing $9.40 total. This strategy profits from large price swings in NVDA, regardless of direction, but loses if the price remains near $135 at expiration on May 30, 2025.
Break-Even and Maximum Loss
Break-Even Points: The position breaks even at $125.60 (lower) and $144.40 (upper), where gains offset the $9.40 cost.
Maximum Loss: If NVDA's price is exactly $135 at expiration, the loss is the full $9.40, as both options expire worthless.
Profit Potential
Profits occur if NVDA's price at expiration is below $125.60 or above $144.40.
The further the price moves from $135, the larger the profit, with no upper limit on gains.
Background on Straddles
A straddle is an options strategy where an investor purchases both a call option and a put option with the same strike price and expiration date. For this case, the strike price is $135, and the total premium (cost) is $9.40, reflecting the combined price of the call and put options. This strategy is typically employed when significant volatility is expected in the underlying stock, NVDA, but the direction of the move is uncertain.
The current stock price of NVDA is approximately $135.50, which is very close to the strike price, suggesting the straddle is currently near its maximum loss potential before considering time value, which diminishes as expiration approaches.
Profit/Loss Calculation at Expiration
The profit/loss (PL) at expiration for a long straddle can be expressed as:
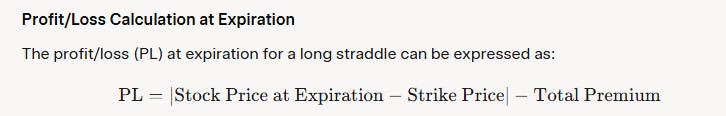
Here, the strike price is $135, and the total premium is $9.40. This formula accounts for the fact that:
If the stock price is above $135, the call option gains value, while the put expires worthless.
If the stock price is below $135, the put option gains value, while the call expires worthless.
If the stock price is exactly $135, both options expire worthless, resulting in a loss equal to the premium paid.
Break-Even Points
The break-even points, where the profit/loss is zero, are calculated as:
Lower Break-Even: Strike Price - Total Premium = $135 - $9.40 = $125.60
Upper Break-Even: Strike Price + Total Premium = $135 + $9.40 = $144.40
At these points, the gain from the in-the-money option exactly offsets the $9.40 cost. For example, if the stock price is $125.60, the put option's intrinsic value is $9.40 ($135 - $125.60), covering the premium.
Maximum Loss
The maximum loss occurs if the stock price at expiration is exactly $135. In this scenario, both the call and put options expire worthless, and the total loss is the premium paid, which is $9.40. This represents the worst-case scenario, where no movement occurs, and the time value has eroded to zero.
Profit Potential
Profits are realized if the stock price at expiration is either below $125.60 or above $144.40. The profit increases linearly as the stock price moves further from $135 in either direction:
For example, if the stock price is $120, PL = |$120 - $135| - $9.40 = $15 - $9.40 = $5.60 profit.
If the stock price is $150, PL = |$150 - $135| - $9.40 = $15 - $9.40 = $5.60 profit.
At $160, PL = |$160 - $135| - $9.40 = $25 - $9.40 = $15.60 profit.
There is no upper limit to potential profits on the upside, as the stock price can theoretically rise indefinitely, while the downside profit is substantial, limited only by the stock price falling to zero.
At the strike price ($135), the PL is at its lowest point, which is -$9.40 (maximum loss).
As the stock price moves away from $135 (either up or down), the PL increases linearly.
The PL crosses zero at the break-even points ($125.60 and $144.40), and beyond these points, the position generates profit.
To illustrate, here is a table of example profit/loss values at various stock prices at expiration:
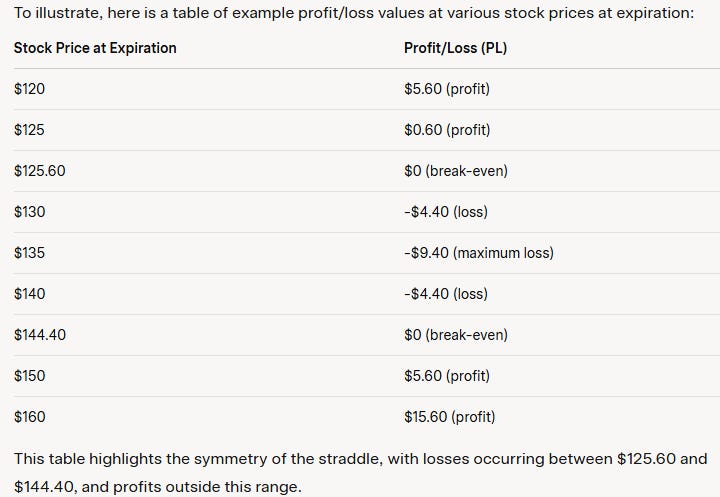
This table highlights the symmetry of the straddle, with losses occurring between $125.60 and $144.40, and profits outside this range.
Alright guys, we have all the MTR Subscriber data and trading trackers up next, we urge you to become a full subscriber and truly break through that barrier of understanding in regards to our global financial system.
We offer you a mindset that you cannot get anywhere else.
We offer you access to our data across a multitude of market segments and structured in a unique way for you to easily understand market movements and the values of those movements.
We offer a more in depth vantage point, to incorporate our work into your own investing and trading processes.
You won’t be disappointed! Sign on today and feel the power of being the smartest person in the room, when others pretend they know, YOU WILL KNOW!
