


Thank you for joining me for another edition of the Magnelibra Markets Podcast, I’m your host Mike Agne and today’s episode #13 is entitled “Analyzing Price Action and JPM Reports Friday”
DISCLAIMER: The following podcast is for educational purposes only. This is not a solicitation to buy or sell commodity futures or options. The risk of trading securities, futures and options can be substantial and is not for everyone. Such investments may not be appropriate for the recipient. The valuation of futures and options may fluctuate, and, as a result, clients may lose more than their original investment.
Ok, so we hear a lot of conflicting insight as to whether or not technical analysis really matters or not. In order to answer this objectively we would say that it is in our experience over the last 25 years, being an active trader that technical analysis is indeed very important. Now there are many forms of analysis that go into technical analysis of markets, of securities and with that, means there are many angles one can choose from when looking at the value of a given market or security. One of the most important attributes is of course time.
What do we mean by time?
Well in today’s trading world you have a multitude of trading decisions being made that span the spectrum of time, from high frequency millisecond traders and algorithms to longer term cycle type players. Then you have the whole host of investors and traders in between, 1 min chart types, hourly chart types etc. This is what makes trading and investing, sort of more akin to an artform rather than science.
At Magnelibra Markets, we like to look at markets from a historical and relationship standpoint, meaning we look at individual markets in relationship to other markets to formulate an opinion on a given sector or a given market in a particular sector. Often you will see that we like to look at say the SP500 vs the Nasdaq Future even though they are in the same sector they do trade differently at times. So given the time attribute in technical analysis, along with the market to market analysis, this gives individual investors a multitude of technical data to digest.
So it has been our experience to focus your attention on the time frames and attributes that compliment not only your goals, but actually what you believe to be the most comfortable for you. Trading and investing is hard enough, there are so many exogenous factors that you truly cannot take them all into consideration. Even the use of algorithms is limited because you will find that by incorporating so many data points, might lead to a confirmation bias of sorts and dilute your ability to effectively create trading signals.
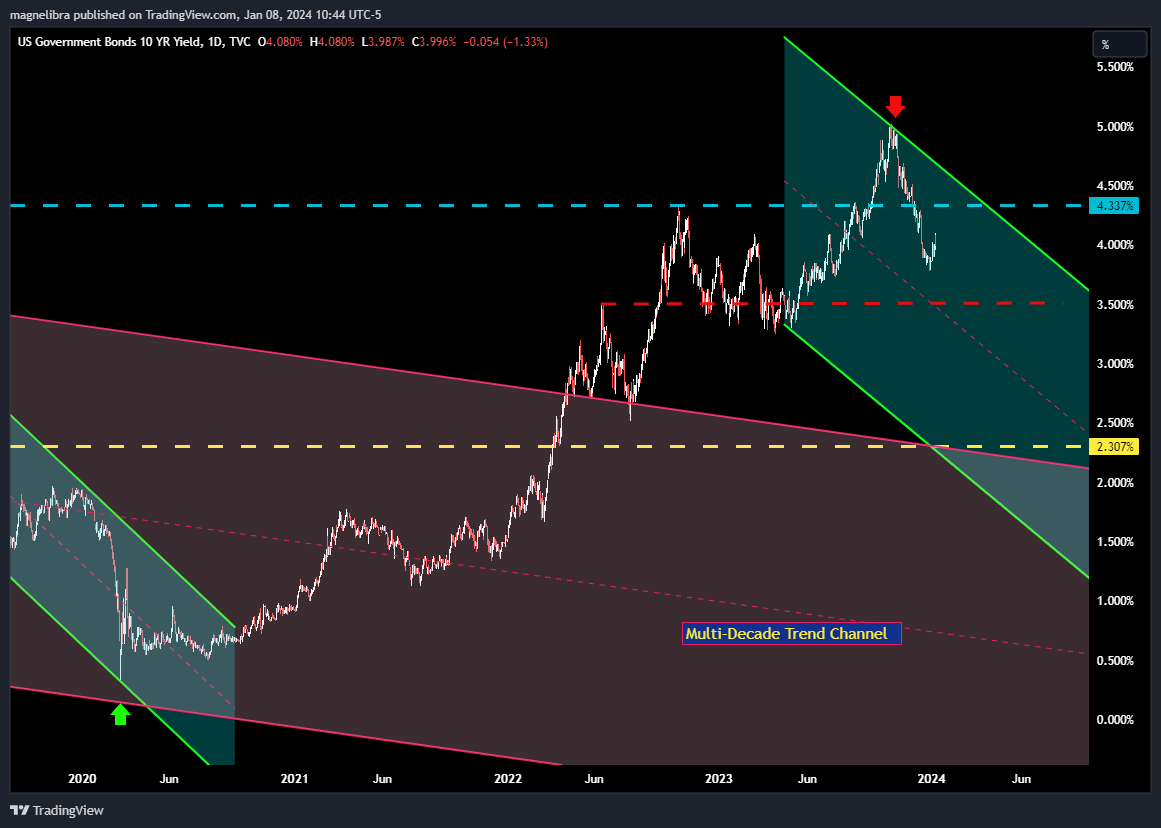
So from our perspective we try to keep things simple and find levels within markets that we feel are important on a multitude of time frames and see how the markets react once these levels are hit. So with that let’s take a look at the US Govt 10Y market in two different time frames. This first chart is a daily chart and we highlight the 4.337% area as our upside initial resistance and the 3.50% on the downside as yield support. You can also see that we have a downward parallel channel as our parameters which will be in place till it is broken:
Now when we tighten the lens to an hourly chart we know the support is down at 3.785% and our first real resistance is 4.25%. So for us right here right now, the trend in 10Y yields is lower but we have seen sellers here in the 10 driving yields higher to start the new year. This however doesn’t change our bias of lower yields, in fact this recent move should see buyers come in here to drive yields back lower if indeed the lower trend is to remain intact. We wouldn’t be concerned honestly until the 4.25% area gives away, then we would start to see the bond markets sentiment change and begin to price in higher rates:
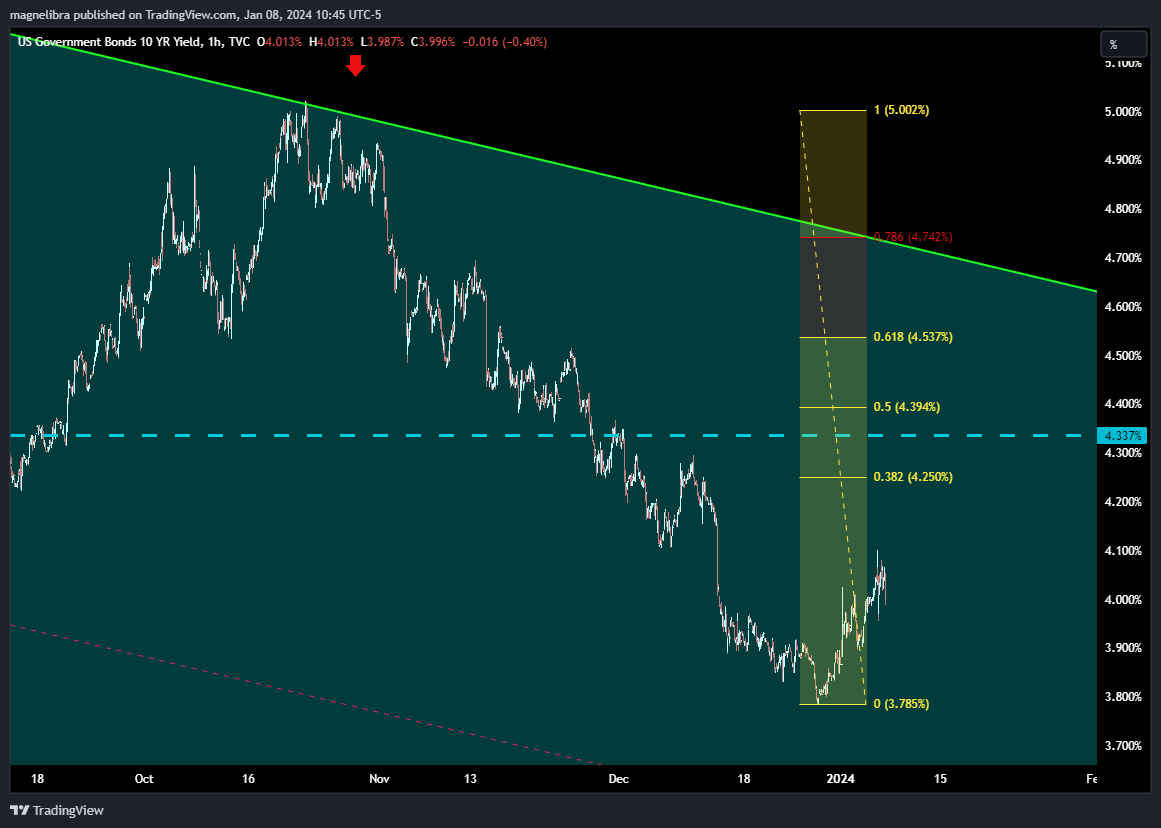
So you can see on both the daily and the hourly resistance in the 10Y is clear at 4.25% to 4.33% with an ideal basing or topping formation to occur over the next few months between 3.5% to 4.0%. So will see, many don’t believe that rates can fall or that the FOMC will cut rates sooner than later, but if this 10Y does indeed fail here and begin to take out that 3.785% low, rest assure the bond market is onto something.
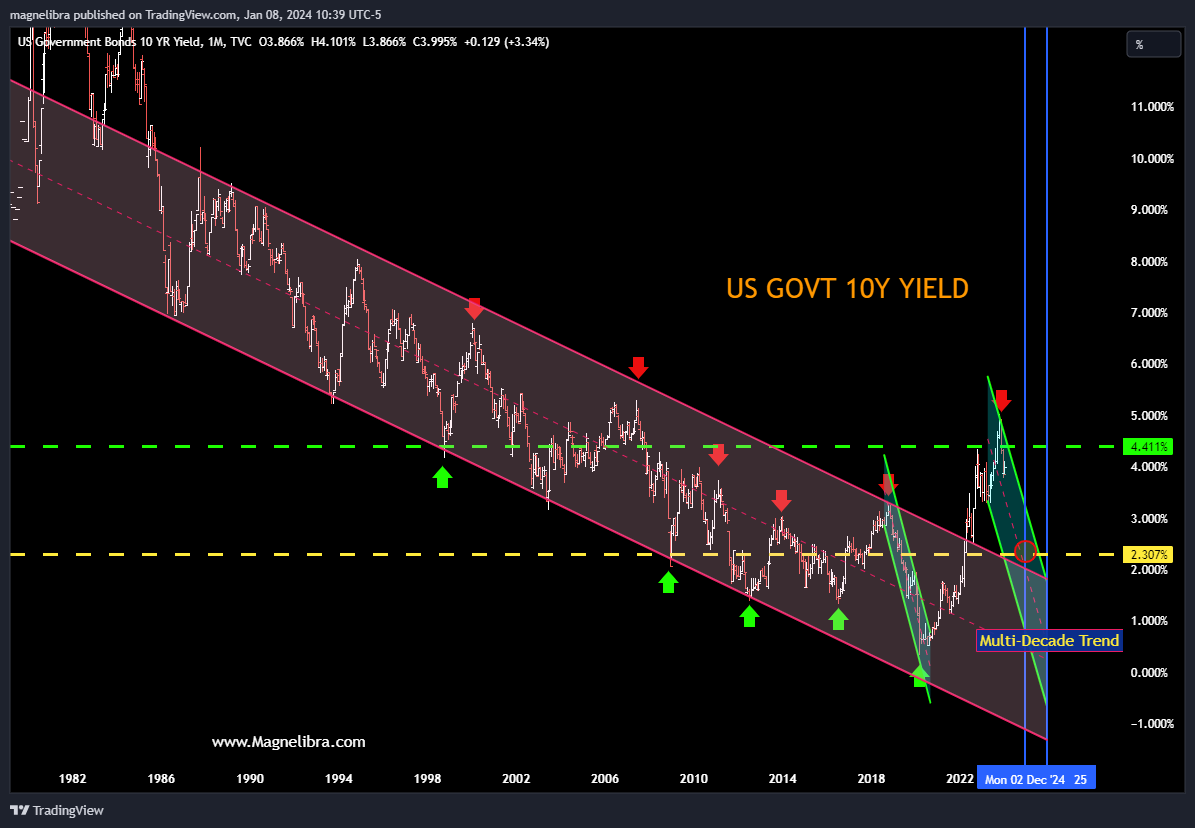
It is interesting to take a look at the monthly chart of the 10Y it really gives you a sense of the low rate regime that the market has been accustomed to for the last 40 years. Many feel that this the start of a higher rate environment, but for me, this move was the antithesis of the fiscal stimulus post covid. A necessary rise in yields to combat the massive amount of money that was printed in such a short time. Well that stimulus has already made it out of the weak hands and into the top 10% or more so 1% hoarding hands. With that money already spent and now hoarded inflation will have a hard time making its rounds and rather all this new debt from my vantage point is highly DEFLATIONARY. So looking at this monthly chart you can see our downward trend channel for 2024-2025 time period depicting what we feel will be a reversion back down ultimately to that 2.30% area:
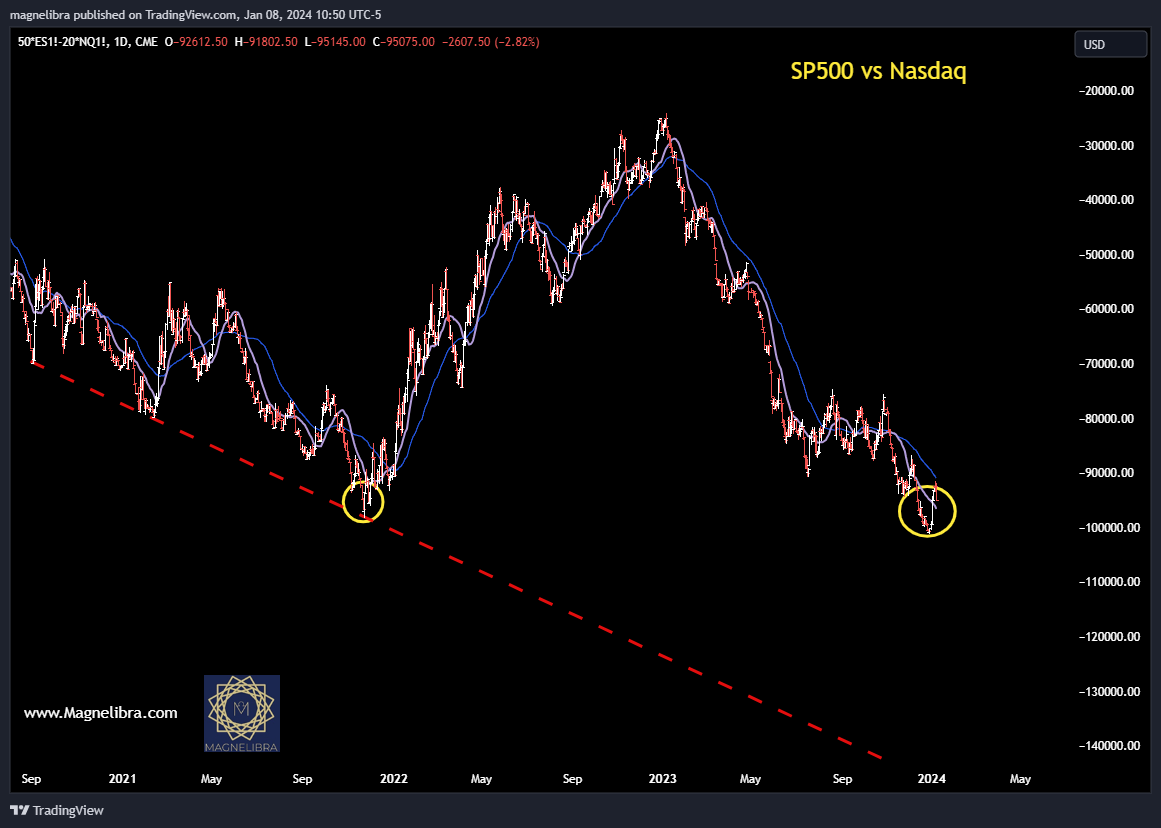
So we touched upon inter market relationships as well from a technical standpoint and this SP500 future vs the Nasdaq Futures chart is something we have been keeping an eye on. We know the Nasdaq was a massive outperformer last year and vs the SP500 it ran into the same spread valuation point as late 2021. We saw the SP500 bounce from this area again in late 2023. So the big question is, will this just be another buying opportunity of the Nasdaq or is this spread going to continue to revert and take away some of that Nasdaq performance? Well from a technical standpoint, you would be long the SP500 here vs Nasdaq unless this double bottom breaks, so technically you know your outs here and for many traders and investors, we feel its important to know your levels of risk at all times:
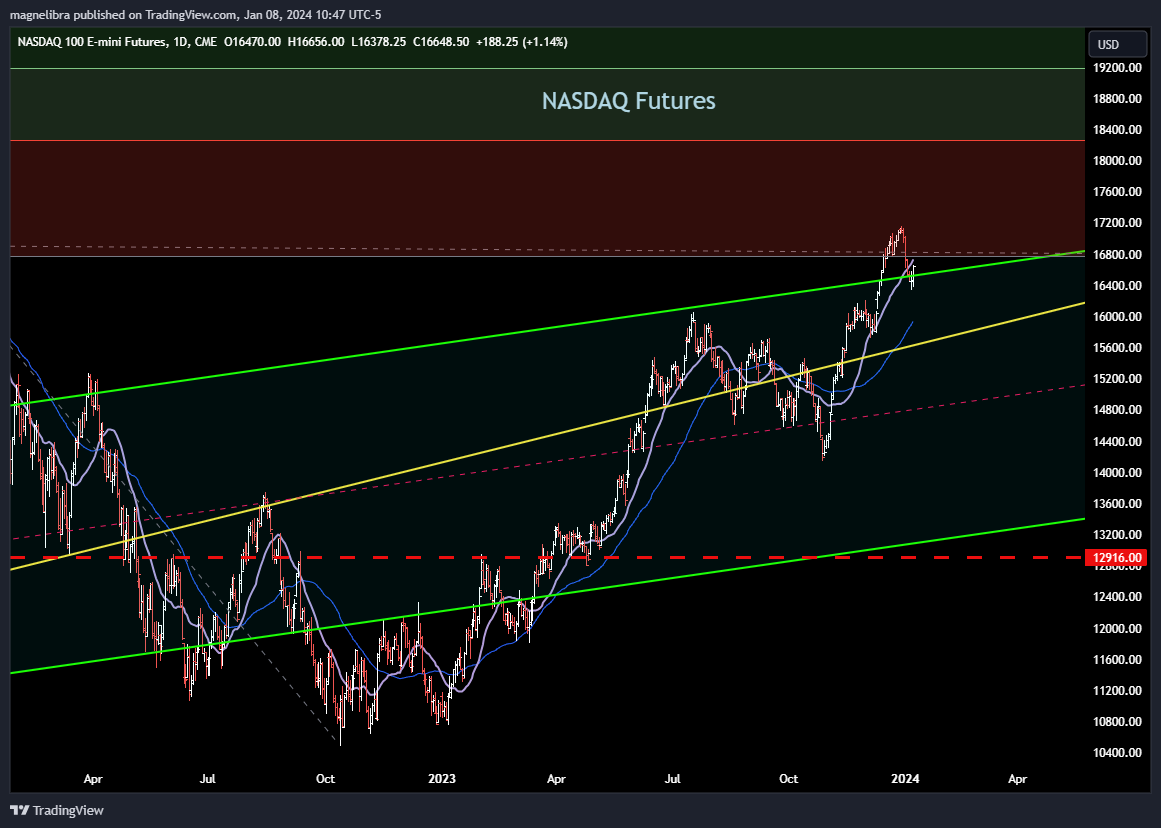
When we look at the Nasdaq specifically and considering the time frame differentials again let’s first look at the daily chart of the Nasdaq Futures. Obviously last week saw decent profit taking, and this week so far, we are seeing some support here early on. The top of the trend channel comes in around 16550 so technically a move and close above here on the daily would signal that a short term bottom may potentially be in. The trend is higher on most time frames and even with last weeks damage, the bulls have a short hurdle to overcome in order to reassert the bullish move:
On a tighter time frame, the hourly has seen this 16550 overtaken and will now become the markets support here for the remainder of the day. Bulls seem to be in control now and have started to build a nice bullish case on the hourly to start the week:
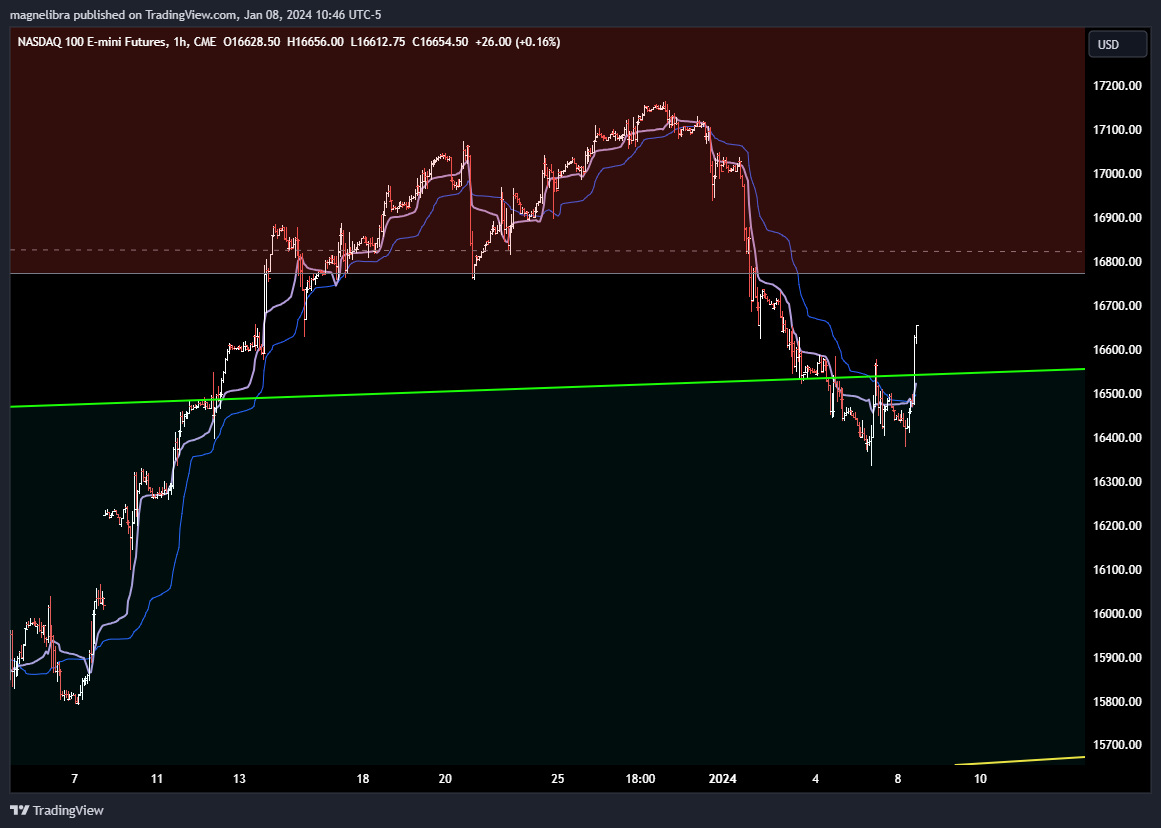
So all in all from both time frames perspective, the bulls are in control and a base is forming with 16550 as the initial support now, so let’s see how the daily closes today with the hourlies continuing to support the bullish action for now!
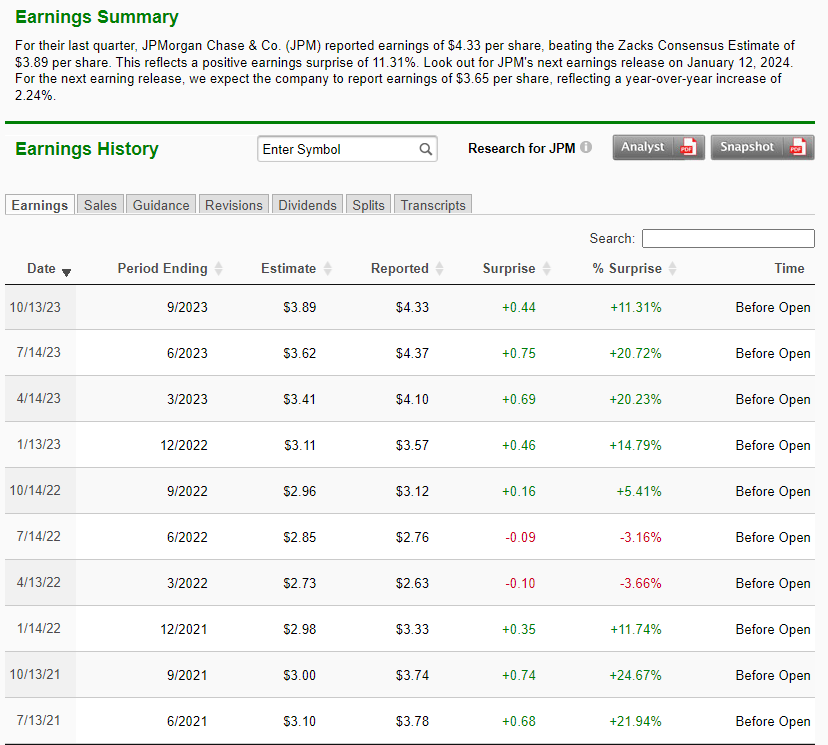
Finally we have JPM Chase earnings this Friday and we know thanks to Zachs.com that JPM generally beats expectations:
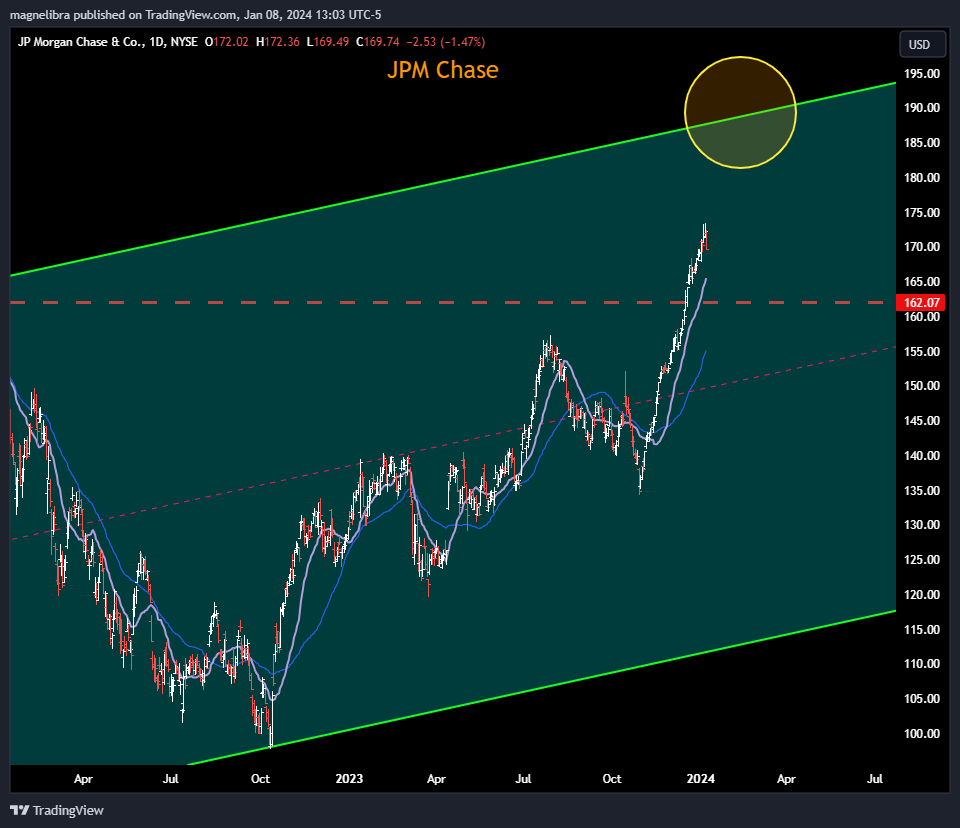
So will see if they can beat once again and set the stage for a run at the $190 area, or if they fail and the late Q4 buyers all go scrambling. We like the support at $162 shown on our chart here:
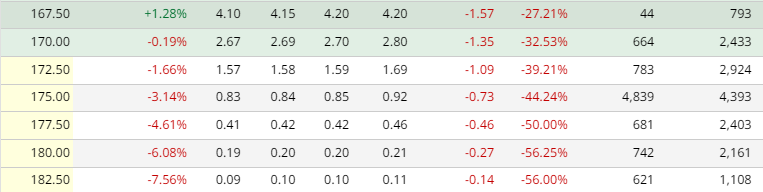
As far as the options for this Friday’s expiration the straddle for the $170 strike is looking at a 3% move with most of the open interest up at the $175 Call strike:
JPM Puts expiry 1/12/24
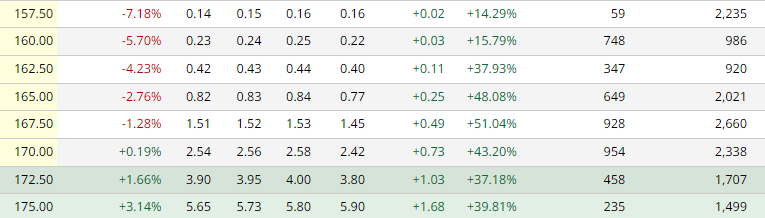
JPM Calls expiry 1/12/24
The big rise in JPM is most likely contributed to the move in the US bond market which is alleviating some of the massive HTM losses that the banking sector has been plagued with. With 5Y yields plunging from 5% down to 3.8%, the banks were all very thankful for this rate move. This however is not going to help all the commercial real estate and multifamily losses that are being seen with each and every new sale but for now the lower yields are helping overall. Time is the biggest key here and who can survive the longest, unrealized losses become realized when securities or assets are sold for less than acquisition and this seems to be the trend here now. This is why we believe the FOMC will be cutting sooner and faster than many believe.
Ok we will be back with our settlements and subscriber trackers later. If you haven’t listened to yesterday’s or last weeks posts please do, we have opened them up for free so you can listen in to what our subscribers get. Thank you to all of our current subscribers for supporting our work and if you cannot afford to subscribe, we understand so please just leave a like or share our work with some of your colleagues. Till next time…Cheers


