
April 7th Subscriber Data Trackers
Fib 50% Retrace and Big Nikkei Level puts a halt to selling for now

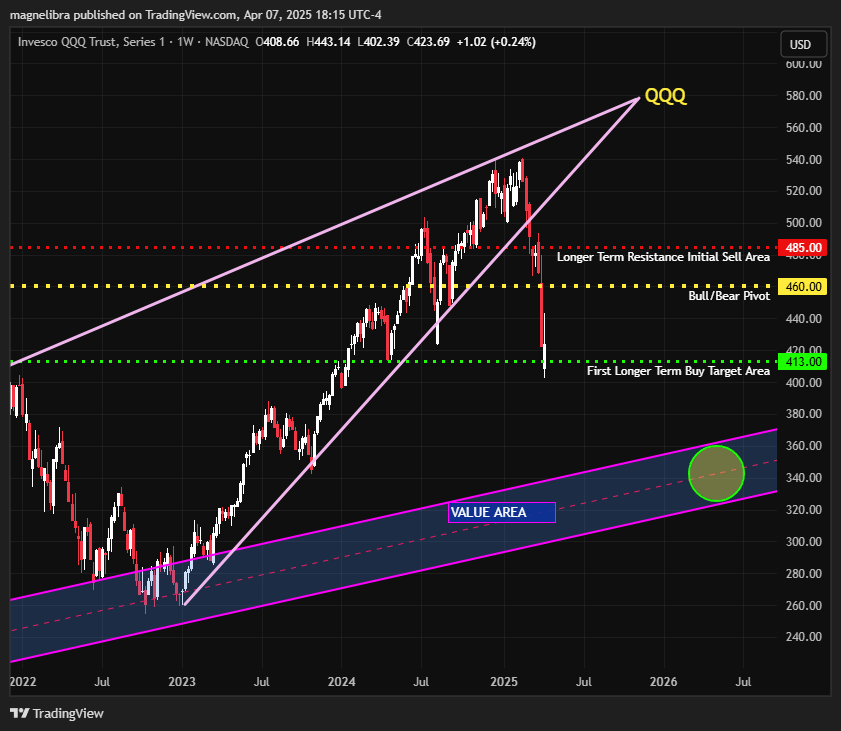
We wanted to share with our subscribers a few charts that we feel put the selling into perspective. The first one is the fact that many point out how disastrous a 20 to 25% market sell off takes precedent over the 113% plus bounce off the Covid lows. Here is the QQQ ETF, the low in 2022 was 254 and the highs in 2024 of 541! So 113% up but 22% decline as of today’s close:
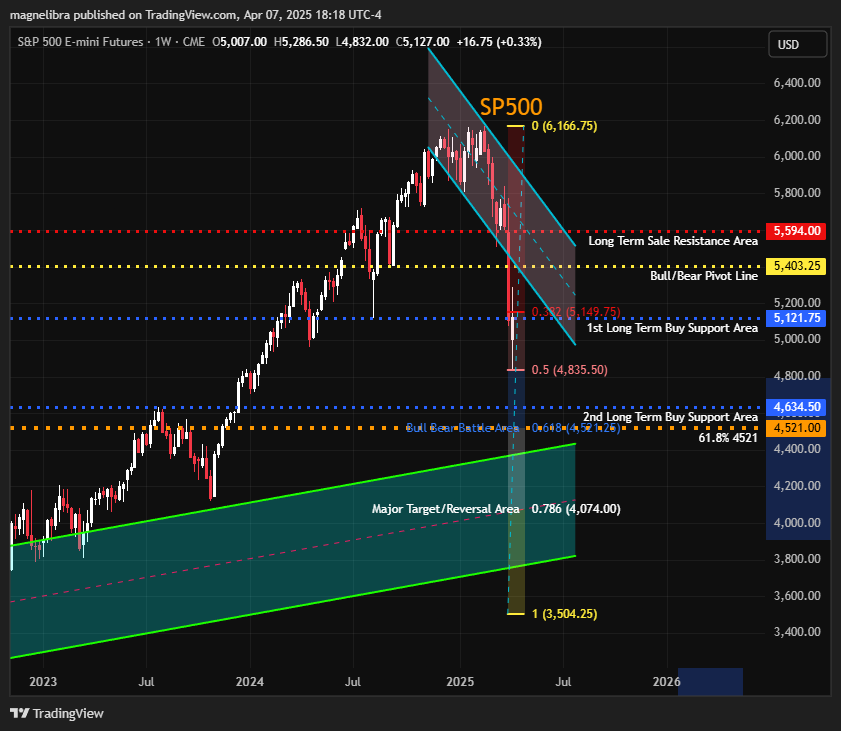
We feel it is important to keep things in perspective and we know that the markets for now hit some important levels as we have noted in our SP chart here now as it hit the 1st weekly buy level late last night and the 50% Fib retracement has halted the melt down, for now:
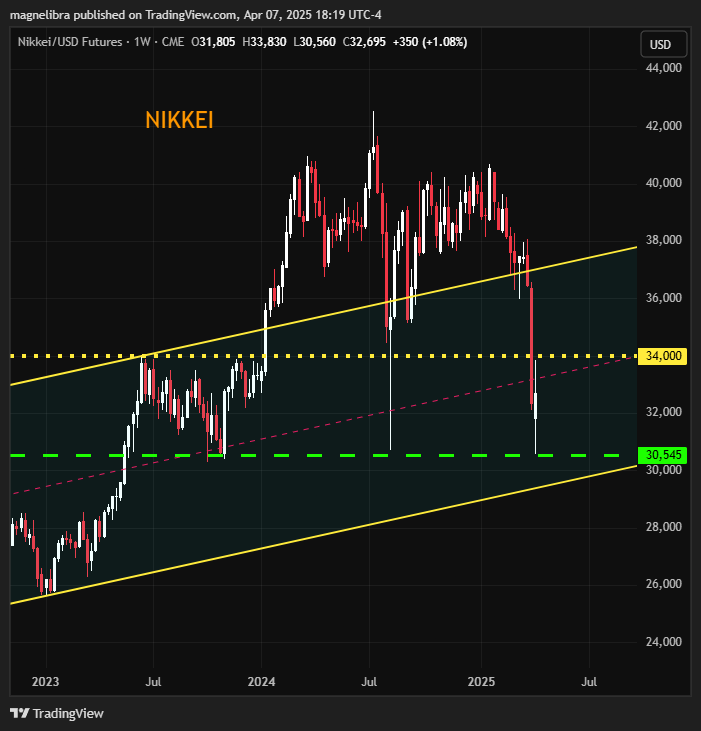
Here is the Nikkei where we know the big dogs are all buyers here with stops below 30545:
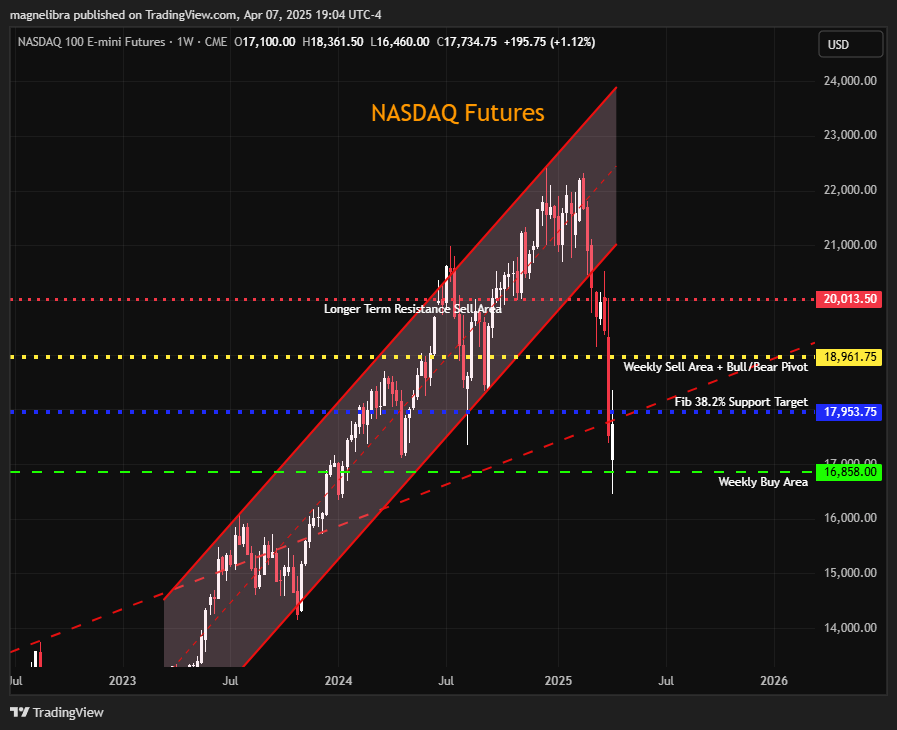
Here is the Nasdaq futures with a clear hit on the weekly buy zone at 16858 and investors should see longer term initial buyers here with a run to 17953 and then longer term sellers up at 18962:
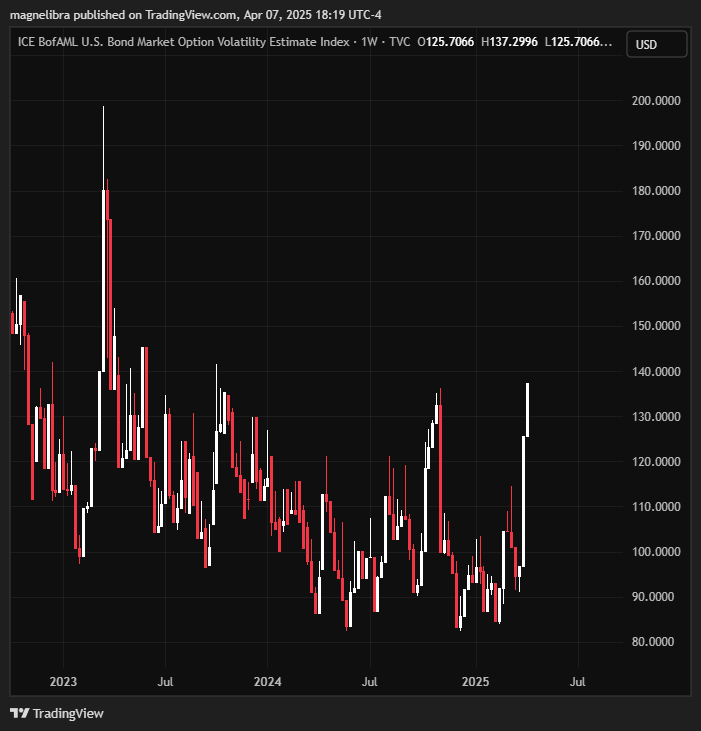
We also need to be aware of the Bond Market volatility as starting to ramp up and this is where the trouble is hiding and if volatility in bond land picks up, well look out!
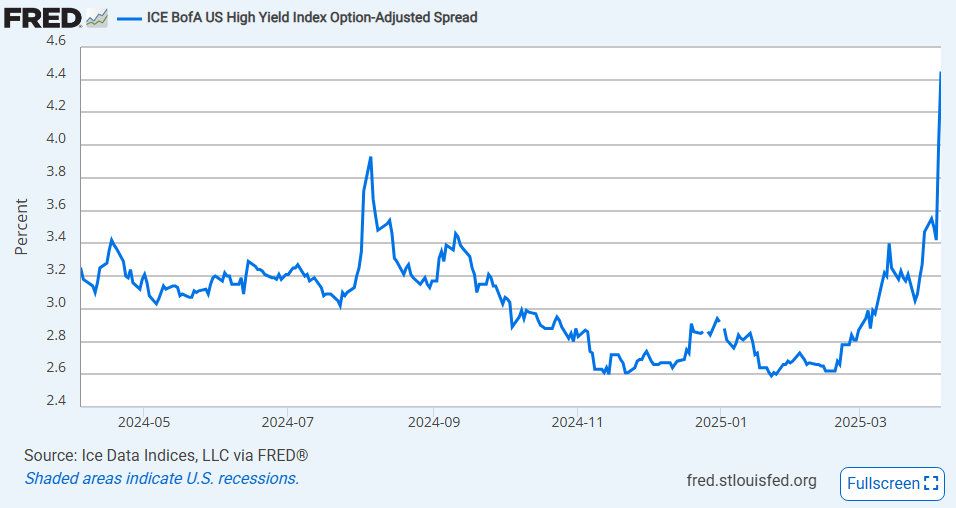
We can see that the HYOAS spread has jumped dramatically in just over a month going from a 2.66 spread to 4.45 today! This is a massive jump in risk 68% in just over a month:
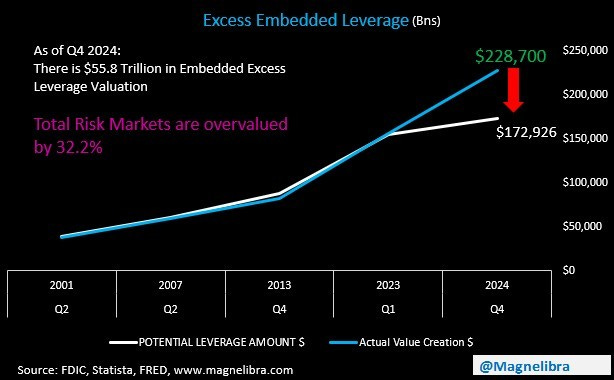
Magnelibra also has a proprietary indicator for leverage that we haven’t shown before but here it is, this is the gap we expect to be filled and it will be done with Equities and Real Estate repricing lower as we have about $55.8 Trillion in “EXCESS UNREALIZED GAINS,” that will get purged here as the economy turns toward a recession and assets are sold to raise cash:
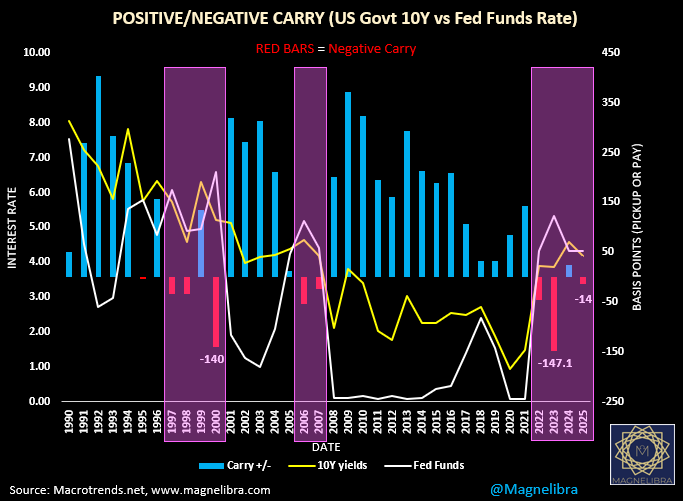
Another chart that you guys have seen which also tells us a major top will form and a market correction will take hold is this one. Its our inverted curve or what we call “Negative Carry,” this is when longer term rates are higher than short term rates which means you funding spreads are negative. Notice the time period of 1997-2000 and now. Well you know what happened during the tech bubble. Will the AI Mania bubble be any different, we highly doubt it?
Alright, so we suspect the market to take a little breather here from the onslaught of initial selling off the highs will take hold now and lead to a technical bounce. We do not think it will be anything other than that, a mere technical bounce. This should allow fresh sellers to be patient here and resume pressure at higher levels above as noted on our SP and Nasdaq futures charts.
Ok we have all the MTR Subscriber data and trackers up next, we urge you to become a full subscriber and truly break through that barrier of understanding in regards to our global financial system.
We offer you a mindset that you cannot get anywhere else
We offer you data across a multitude of market segments and structured in a unique way for you to easily understand market movements and the values of those movements.
We offer a more in depth vantage point, to incorporate our work into your own investing and trading processes.
You won’t be disappointed! Sign on today and feel the power of being the smartest person in the room, when others pretend they know, YOU WILL KNOW!
Keep reading with a 7-day free trial
Subscribe to Magnelibra Trading & Research to keep reading this post and get 7 days of free access to the full post archives.