
At A Crossroads


Good morning everyone and Happy Monday! We sent out the subscriber only data and trading sentiment insights last night. We hope you guys consider following along as we know the work we put out does offer unique insights to improve the way you view markets, the way you think about risk and so much more.
Well the Qubic attack as we noted last week was going to prove futile against the power of the decentralized Monero (XMR) community. It was a well oiled propaganda attack against the only true decentralized private crypto that exists and as we knew all along, the attempts to disrupt the power of the network, proved futile.
XMR has rebounded off the recent lows at $230 to put out a $301 print earlier this morning. As long time MTR readers know we stand 100% behind this network and what it has to offer. We believe not in looking at where it is priced today, tomorrow or even next week, but rather where it will be priced a decade from now. Every single attack on this network will make it stronger and will invigorate the community and make Monero that much stronger! Here is the chart:
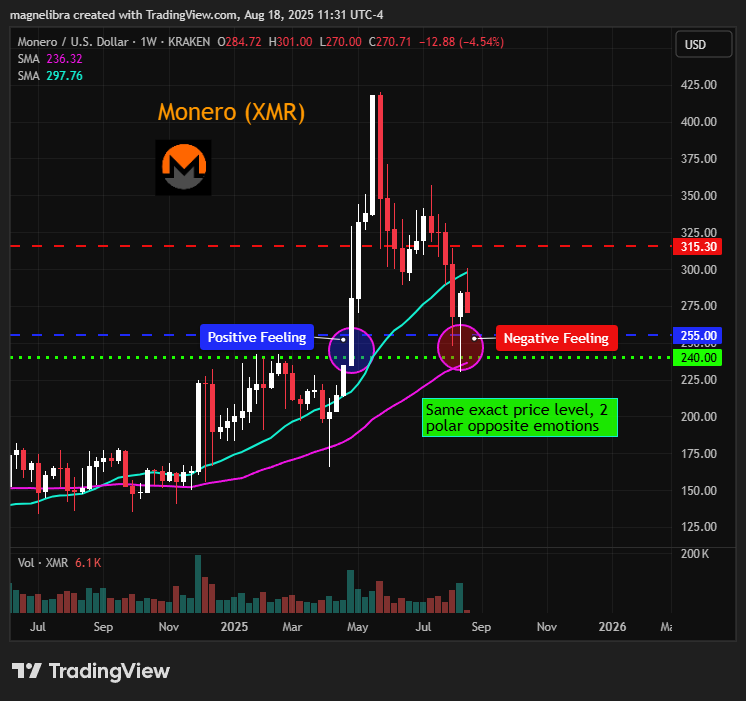
We kept our “Positive/Negative Feeling” tags in there as we used these tags in a prior post to describe the fickle demeanor of the average trader and prove that the very same price point can offer two very different connotations depending upon the context and timing by which they exist. On the way up $240 was the launching pad for further gains, but on the way down, they would lead to negative “toss in the towel” like thought processes. Which as you now know, would have been a mistake to sell below $240. Anyway this is how we like to visually present things, so you guys can learn and intuitively adapt to what it is we are saying, what it is we are presenting and outlining to you. We want you to improve your thought process to refrain from emotional based decision making and focus more so on the long game at hand!
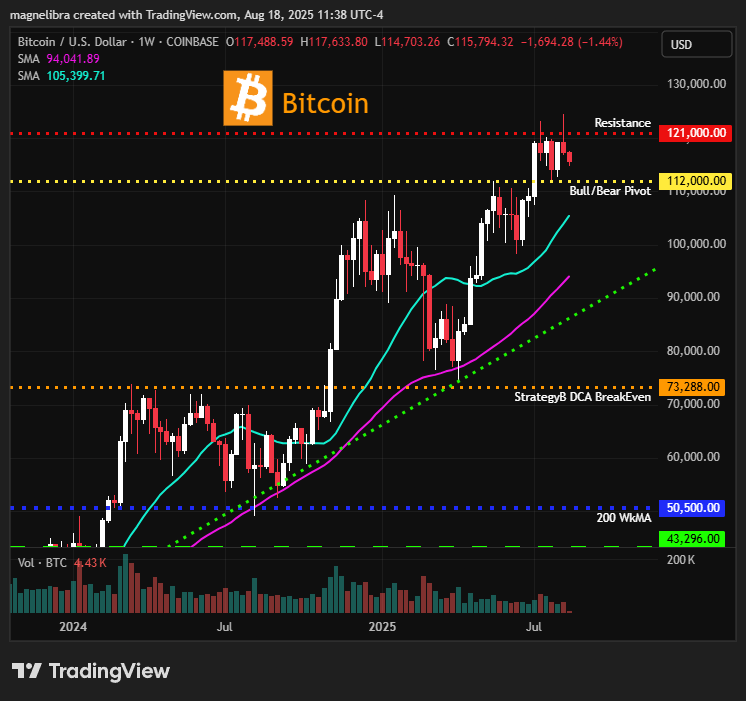
With that in mind let’s also take a look at the Bitcoin chart, yeah yeah we know all the billions in buying and even Strategy added to their holdings today, but Bitcoin continues to waffle at the $120k price tag:
Ok onto discussing the current valuations in the stock market, as we have seen a slew of data points highlighting the massive and ongoing fundamental overvaluation metrics. First up let’s just take a look at the price to book off the SP500:
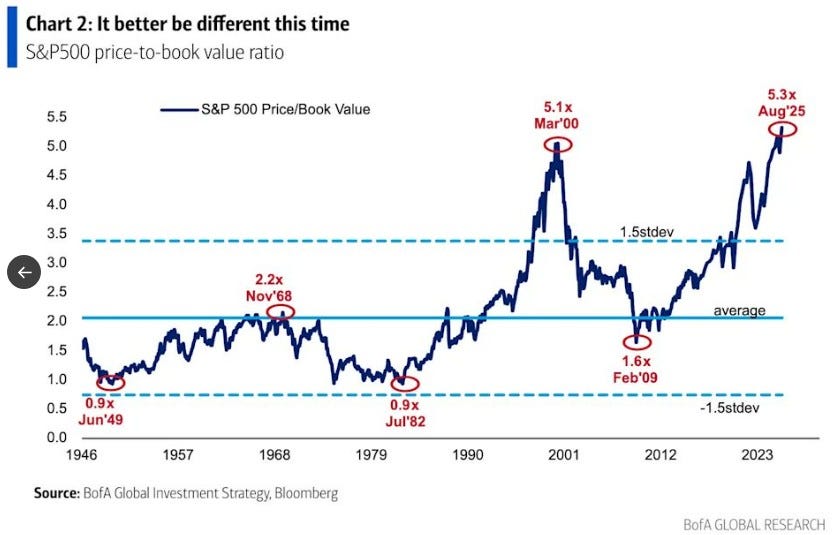
History has not dealt kind with these type of atmospheric reaches when it comes to risk assets. Yes time is funny, sometimes it seems like things transpire over decades and then out of nowhere poof, the cascade begins. Many will say you shouldn’t try to time the markets, just stay invested…well that is easy to say if you have the funds and if you have the time to do so. However imagine if you are still fully invested and your 50 or 60 years old and your “all in” still at this point in time. Take a good look at the chart above, how did 1968 to 1982 go? How did 1999 to 2010 go? Now ask yourself how will 2026 to 2036 and beyond go???
Think about that in your conscious mind, ask yourself today, can I afford to take the risk that 2026 to 2036 is going to offer negative returns vs the odds of it continuing into new highs?
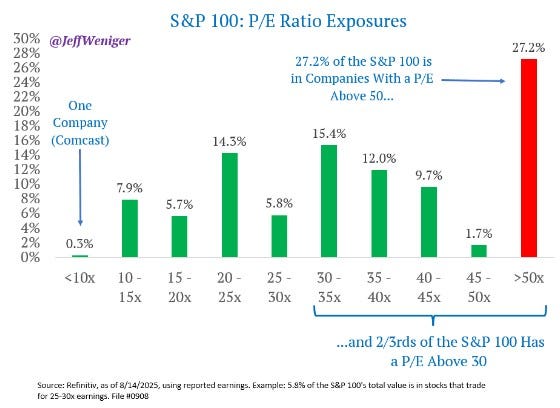
When we look at the distribution of the current SP100 PE levels, know that better than 27% of the companies have a PE >50 and 72% of the companies have a PE >25
Now look at this Elliot Wave analysis:
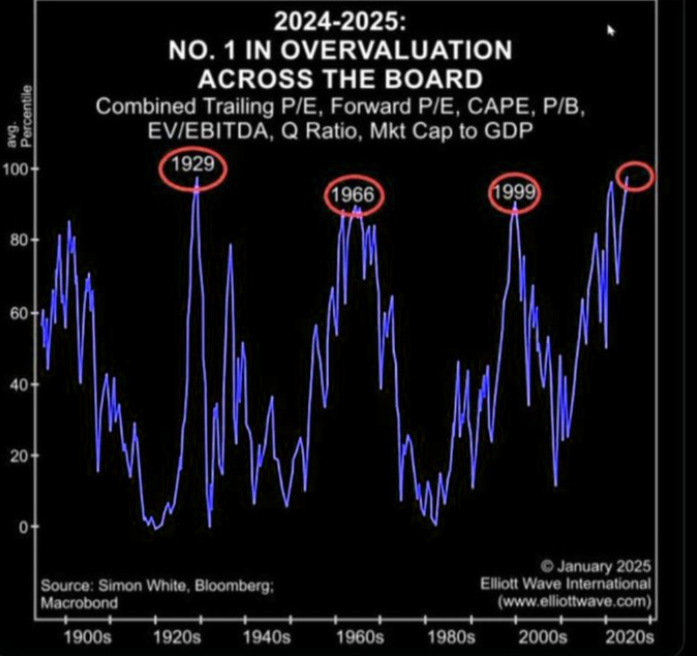
I don’t think we can be any clearer as to the risks that are embedded and validated by both price and time right now. We are at the far end of the spectrum of risk taking and history will eventually end this over zealousness, it always has and it always will. DO NOT think for one second that this is about timing the market, rather know this is about correctly evaluating relative risk.
Yes we know nobody wants a US Govt 10Y Note paying 4.25%, we get it, we get the thought that inflation gives us a minimal return profile on that, but there are some points in time where your focus should be more on return of capital and not RETURN ON CAPITAL.
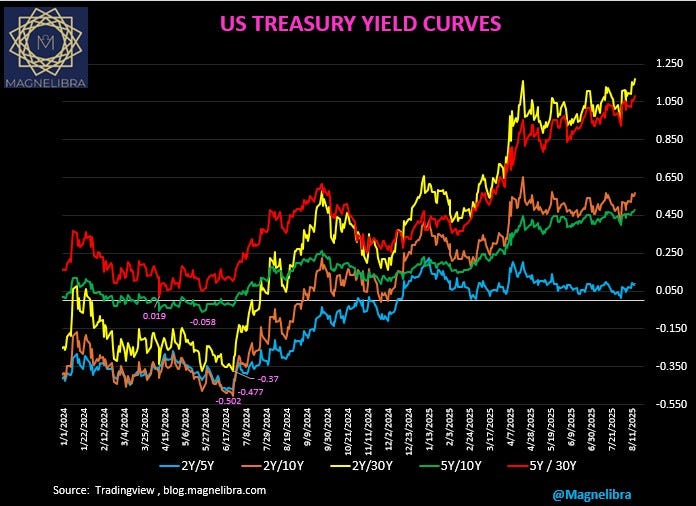
Ok our final chart is the US Bond Market Yield Curves. What this chart posts is the relationship of the spreads between the various maturities of the US bond market from the 2Y to the 30Y. The yield curves are steepening out meaning the spread between the yields between the maturities is increasing. For instance the 2Y yield is 3.76% and the 30Y yield is 4.94% so the spread between the two is 494 -376 = 118 or 118 basis points. Just so you our MTR readers know, we suspect this spread to widen out past 200bp just like the 5s30 will do as well. These wider spreads indicate that the Federal Reserve is falling behind the curve and will be forced to cut rates. What it further states is that the bond market is expecting the economy to stumble, which further validates our stock market over valuation theme:
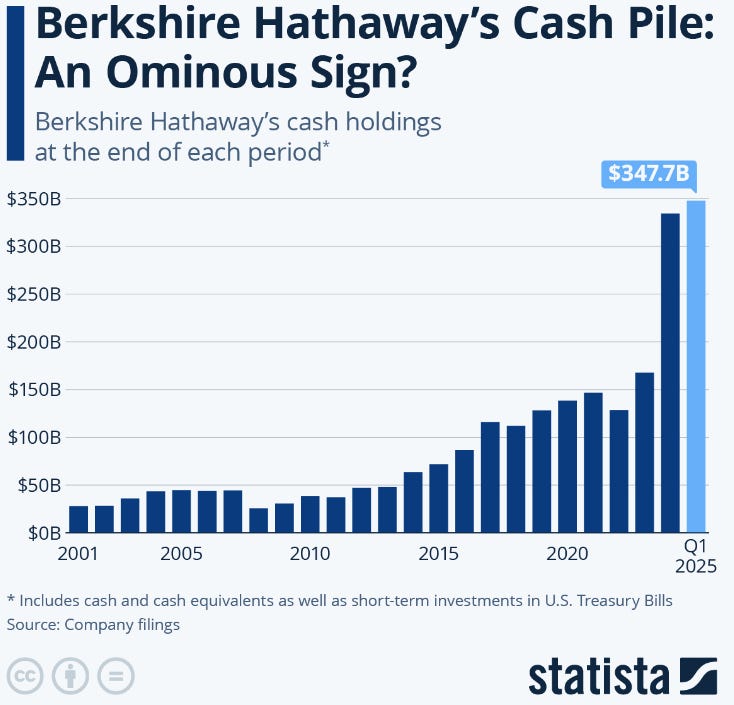
Ok we leave you with this Berkshire Cash pile chart from Statista. This chart encapsulates the vast cash hoard, but also shows how much money printing has been going on for the last 3 decades! Uncle Warren doesn’t time the market either, he focuses upon VALUE and his cash hoard should tell you exactly what we have outlined in this whole note today and that is the current risk far outweighs the potential for returns:
History is full of these time periods and all we can do as traders and investors is try to not get caught in the emotions of it all but rather survive by what Darwin called the most adequate of all organic attributes, adaptation! Be proactive and look at your situation, evaluate your time horizons, evaluate your needs vs your wants and formulate a very honest opinion then execute. Don’t be lazy!
Ok guys till next time.
We appreciate all the support and thank you for reading our work and hopefully your gaining valuable insight and improving your own techniques and improving your non linear thought processes.
Support directly to our BTC address if you can: 3DvDvPnjwu5Fd6sagAYmiFXA2fPkjJf2cp
Anyone interested in investing in Monero (XMR) please reach out, we have a link to Kraken below if you use my referral code or link to try it, we’ll both earn $75 USD when you trade $200 USD of crypto in the app!
Code: y4wsyws7
Link: https://proinvite.kraken.com/9f1e/11l9bp1z
Additionally we would be glad to consult anyone interested in getting involved here. As always we view these crypto currencies in the same realm as futures, high risk, high reward, and every portfolio should have a small percentage of their overall portfolio in investments like this.
So if interested please reach out to the email below directly and we can discuss this further. The future of financial payment systems will be digital decentralized and we are still in the infancy of this fascinating technology!
If anyone is interested in working on a digital currency project and joining in as a core investor to help lay the foundation for what is to come, please reach out!
Cheers,
Magnelibra