

Last Friday saw the release of the US CPI report. It rose a paltry 0.1% mom, with yoy growth dropping to a meager 1.7%. The bond market saw this as a go ahead to rally as yields fell across the board with the US 5yr Treasury falling 8 basis points on the week. Rationale is that the FED is now going to have to consider the fact that inflation is not gaining traction and that further hawkish balance sheet talk and rate hikes, may have to move to the back burner. As our readers know, the FED really can't raise rates or reduce much of anything , thus their tactics of hawkish rhetoric, which is nothing more than wasted air is there only weapon. Adding to this already slippery slope for the FED is the fact that in the 4th quarter the US Treasury is going to issue around $500 billion worth of debt, which is basically the total amount of debt issued in the previous prior three quarters combined! So would it make sense to raise rates with benign inflation and the massive influx of debt coming down the pipe line? We think not, but once again, we know that raising rates is a bank subsidy, but even so, the conditions on a fundamental economic basis certainly do not warrant a hawkish campaign.
The equity markets were on their heels late in the week as further rumors of a North Korean aggression came to the forefront. We aren't sure how credible any of their threats are or if the narrative is being pushed from another agenda, but none of that matters really. The if where why what are second to the way the markets react, we must react accordingly and be fully aware of any developments that may persist, whether they come from a credible source or not. News is news, whether fake or legit and it is our job to be proactive and adjust as they come down the pipe. The equity complex losses were staggered across the board as the Nikkei and the Dax led the way lower with the SP500 and Nasdaq following suit with losses ranging from 3% to 1%.
Now as we have previously discussed, the dollar may become problematic if it continues to weaken. Talk about being caught between a rock and a hard place the FED doesn't have very many options and we are seemingly in unprecedented monetary policy times. We do not envy their position to say the least, although they are a product of their own device, or shall we dare to say you reap what you sow? The seeds of animosity amongst the commoners and the elites grows by the day, just watch the news and the narratives they spew each and every day. You know we saw a stat the other day, we can't confirm the actual source, but less than 5 years ago, over 400 billionaires controlled 50% of the global wealth. Today that same 50% of global wealth is controlled by just 100 billionaires. This type of disparity amongst not only commoner and elites, but between the elites (top 1%) and truly the untouchables (0.5%) is just unprecedented! Well we certainly know where all the central bank QE has gone and who benefits from their policies now don't we.
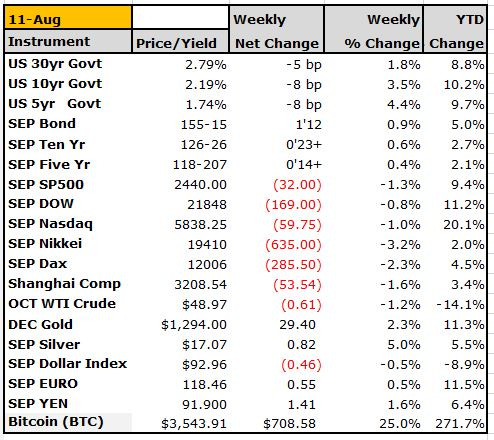
Now moving over to the technical's where charts give us a great glimpse into the culmination of price action. We normally put the weekly settles at the end of our letters, but we are showing it here to display the rare down move in the equity markets. We are also putting it here to show you that Bitcoin was up some 25% this week alone. We hate to say it, but the crypto space is here to stay and as the price of this space grows, so too will the interest in its technology. As we stated many times in the past and have talked about Blockchain and Bitcoin in particular for a few years now, this is an arena we think investors cannot and should not ignore. As you can see from the settles the Nikkei lost 3.2% as Asian investors worried about the legitimacy of the NK Nuke program. Silver had a nice week up 5%, while Bitcoin was the star with a 25% bump putting it north of $3500!
The following charts are current as of end of 8/14 trading and represent a dramatic turnaround in the equity complex. We can't tell who the buyers were, but they came out in dramatic fashion that's for sure. The first chart up is the SEP Nasdaq Future:
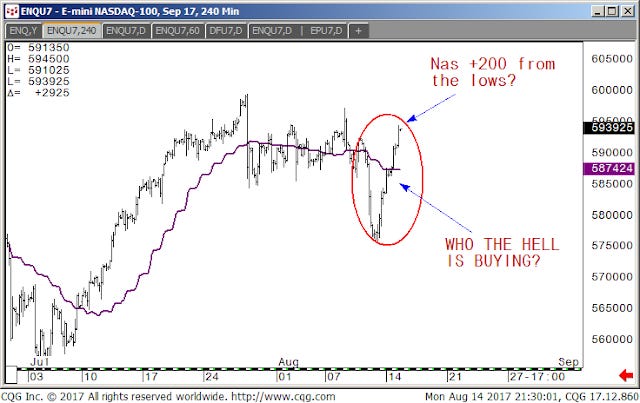
As you can see it rallied nearly 200 points from its lows on Friday!
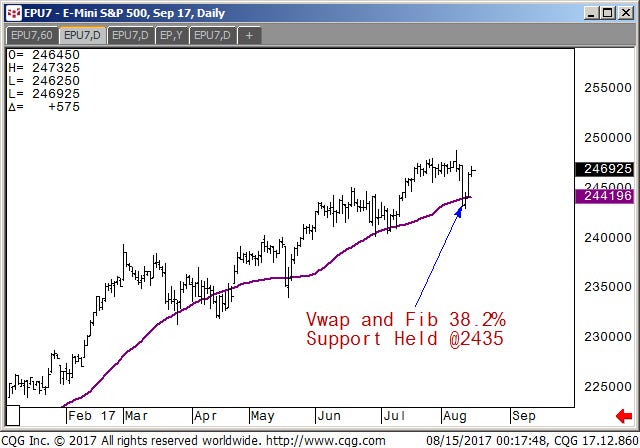
The SEP SP500 Future held the Vwap and 38.2% Fib which both converged around the 2435 area. We feel that the range is now defined somewhat between 2435 and 2475 for now, with extensions coming only after either of those levels are breeched:
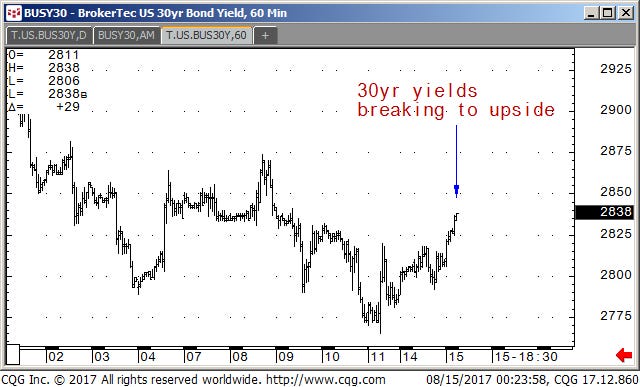
Moving over to the US Treasury 30yr yield chart, we can see last Friday's low print down at 2.76% was followed by a rise back up into the previous range:
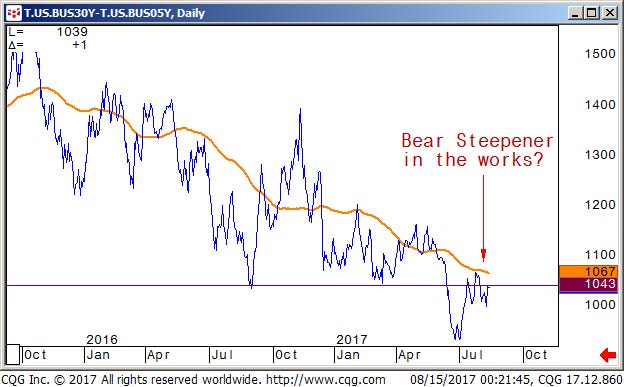
When we look at the US treasury 5s30 yield curve the flattening trend is still intact, although we have seen countless bounces but on a lower trajectory still. If the yields continue to rise in the long end we may see a bit of a bear steepener, something to keep an eye on at least:
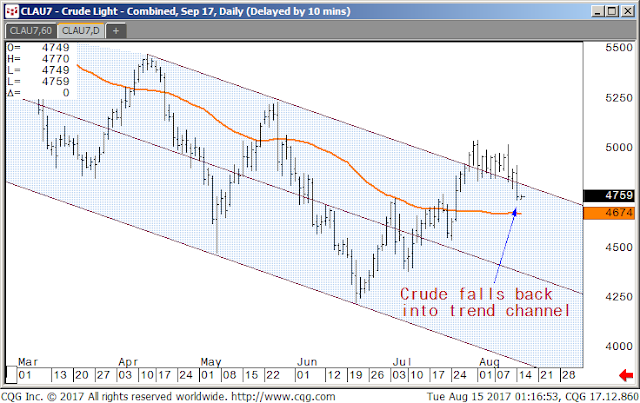
The last chart we have is the SEP Crude Oil futures, where crude has now fallen back into the previous defined channel:
Ok that's it for this week, we hope you continue to enjoy our weekly letter and find it informative and useful. We also hope it provokes some of your own investing and trading mindset to look at things in ways that you may not have before. It is our goal to enhance your ability to navigate these markets and make sense of certain moves and occurrences as they come to affect our markets. We understand you have a lot of information coming at you and we hope you choose to continue this journey with us. If there are any markets you may think need extra attention or analysis feel free to reach out, Cheers!