


Hello Traders and Investors and thank you for joining me for another edition of the Magnelibra Markets Podcast, I’m your host Mike Agne and today’s episode #17 is entitled “Bond Curves Steeper Despite CPI Print and US Budget Deficit Blows Out Expectations”
But first a quick regulatory disclaimer:
DISCLAIMER: The following podcast is for educational purposes only. This is not a solicitation to buy or sell commodity futures or options. The risk of trading securities, futures and options can be substantial and is not for everyone. Such investments may not be appropriate for all listeners.
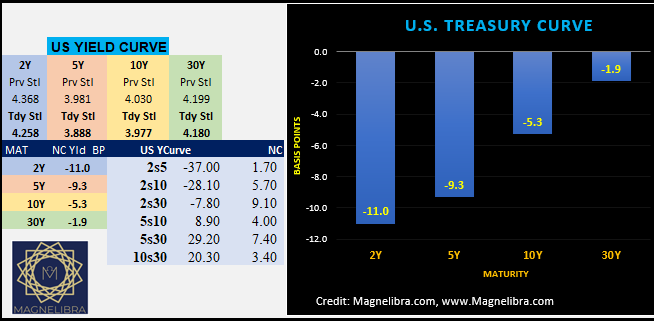
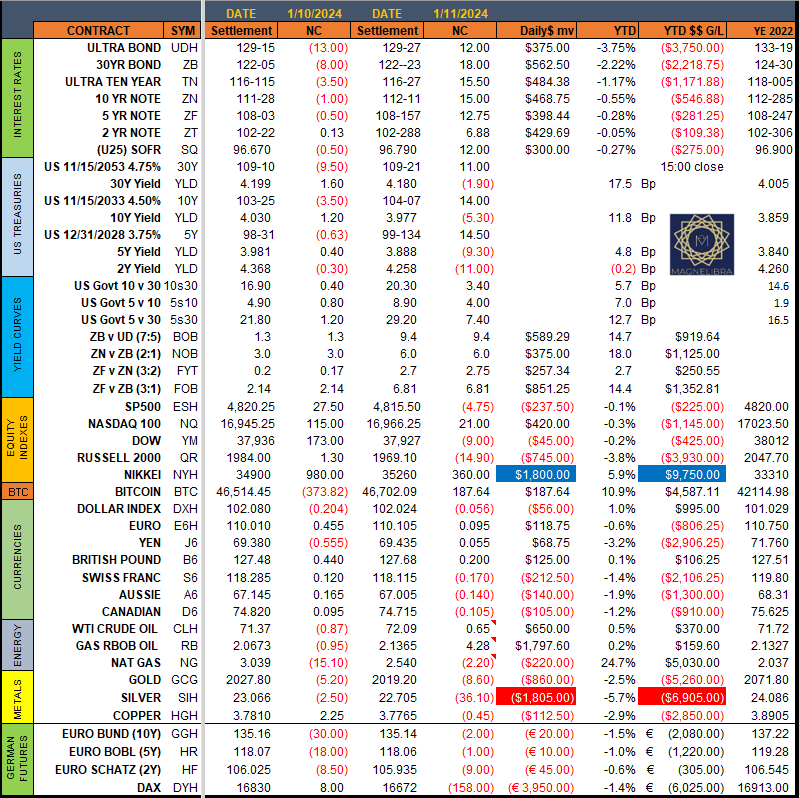
Well the Spot Bitcoin ETFs were the talk of the town today, but for us, behind the scenes we believe the US bond market was the real story today. Our earlier podcast highlighted the higher CPI print but the bond market reacted initially by popping yields higher. This didn’t last long and by the time the US budget data come out, the yields decidedly tumbled into the close. Here is how the US yield curve settled out the day in a massive steepening fashion as 2s tumbled -11bp while the 30Y was only -1.9bp:
For me the US bond market is telling a deeper more meaningful story as to the underlying trouble brewing in the liquidity plumbing of our financial system. The budget report didn’t help things in regards to painting a rosy picture as the budget deficit for December was a whopping $129.4Bn which was $40Bn higher than the estimates, which was also $44Bn higher than the 2022 December deficit number:
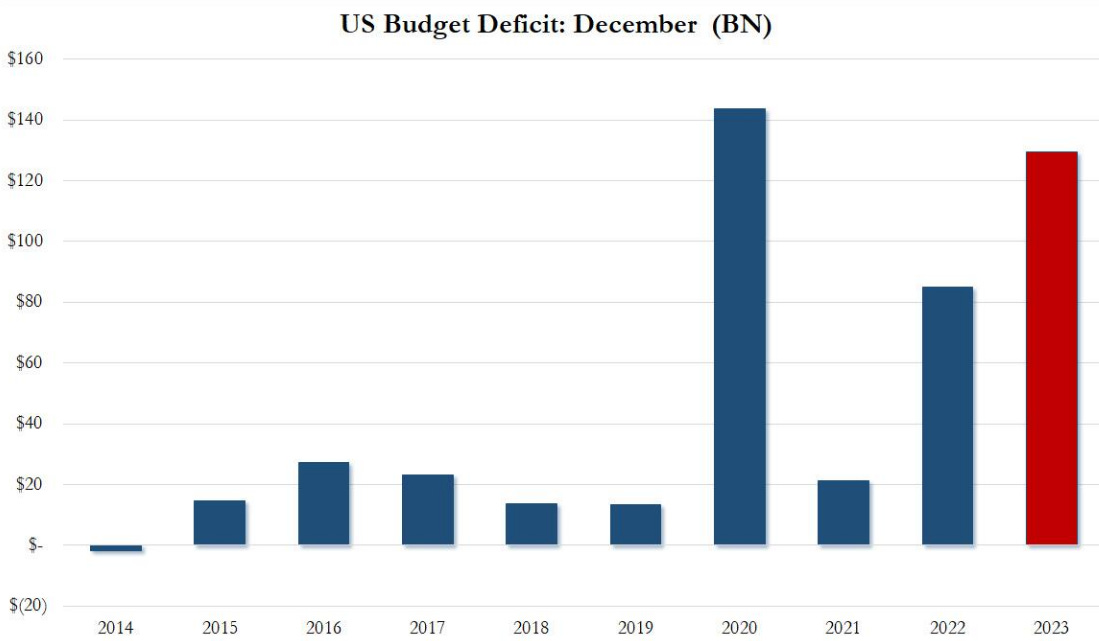
When we look at this chart it does make me wonder if Covid didn’t hit at all if we would be seeing this same data, I bet we would as there were signs of this brewing in late 2018 and 2019 and Covid was the front for trillions in stimulus. Well now that is exhausted and patiently sitting in the top 1%ers hoarded coffers, well now the real pain may be exerting itself on the broader economy.
Why is our government with most likely record revenues, posting such massive deficits still???
This is the real question and the answer is probably a simple one, you can never get enough of a good thing, debt its the gift that keeps on giving, or shall we say keeps on digging! Digging this country further and further into a massive deflationary debt spiral!
Well the steepening yield curve will continue to catch many of the so called “inflation resurgence proponents” off guard, but we do expect this to be the ongoing theme this year.
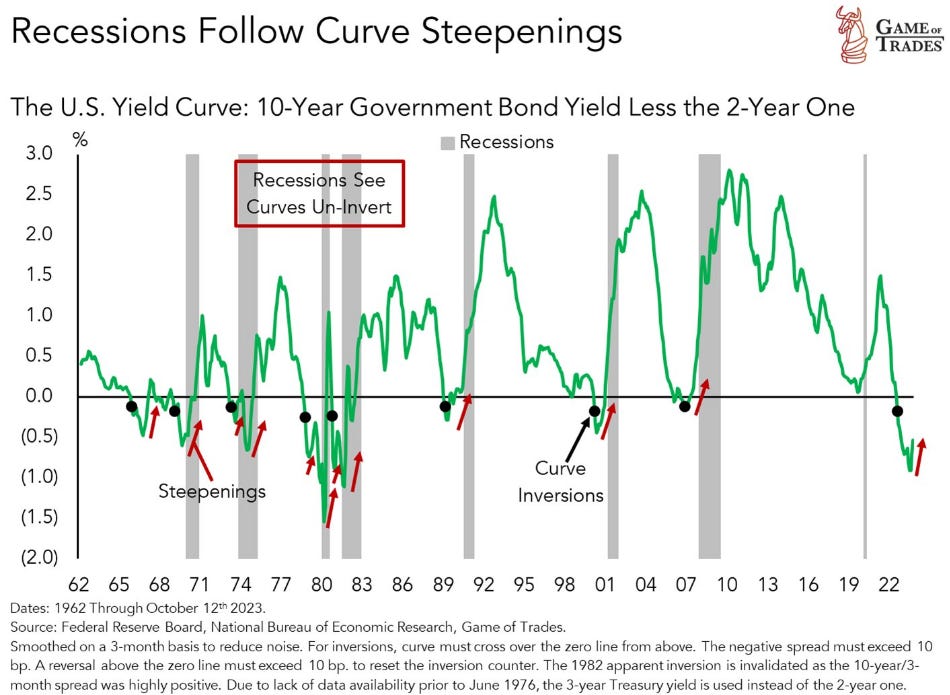
GameofTrades on X posted this excellent chart and it highlights the beginning stages of the dis-inversion which foreshadows the impending recession. We love the simplicity of this chart and although it plots the 2s/10s curve and not our 10s/FedFunds it exhibits the same fundamental principle:
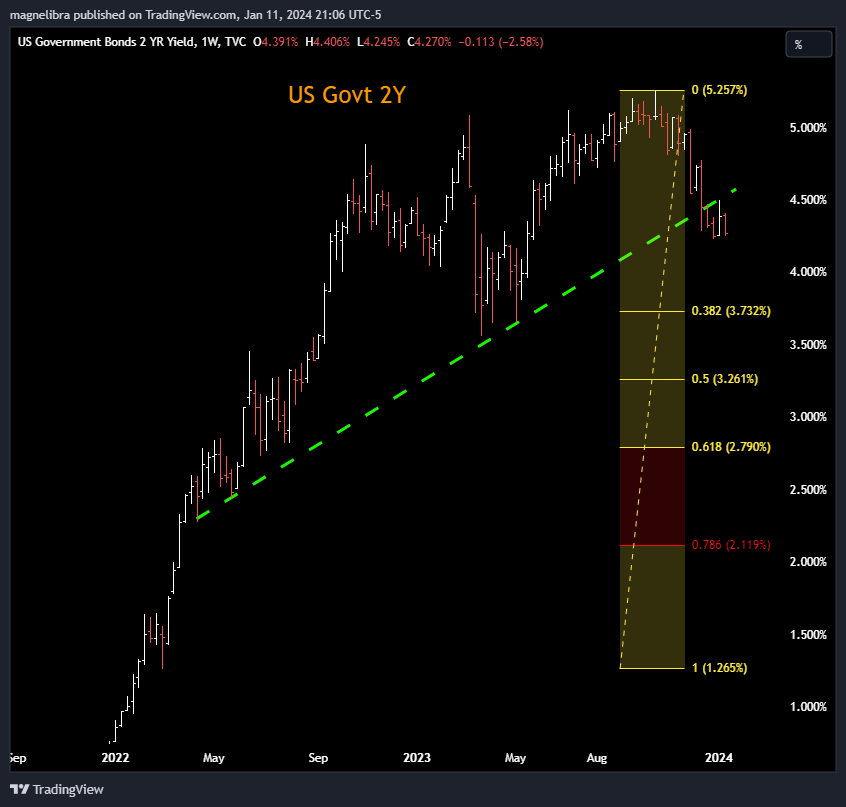
When we look at the US Govt 2Y yield chart its clear that we have had a break of the longer term trendline at 4.50%, we have retested it and now we are heading back down. This is a formidable set up and could lead to a massive stampede into the front end here which would jam the rate cut down the markets throat sooner rather than later:
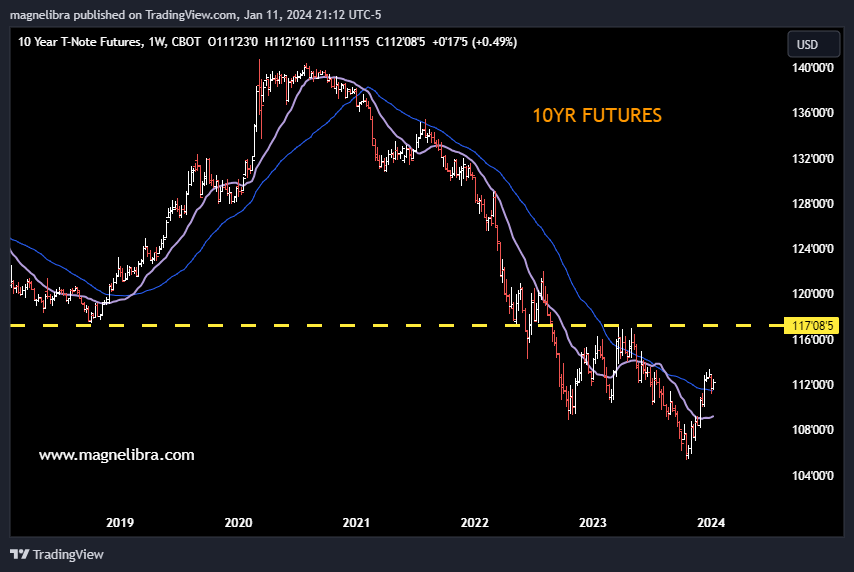
Similarly, when we look at the Ten Yr Futures we can see a nice rejection off the lows with very minimal pullbacks indicating any back up in yields are being bought, which further indicates demand is waiting, willing and certainly able to swallow any selling pressure thus far. Ultimately we would like to see a move and slow rise to test the 117-08 area but this is 5 handles away and would most likely be accelerated via the first initial rate cut, which we suspect will be of the 50bp variety:
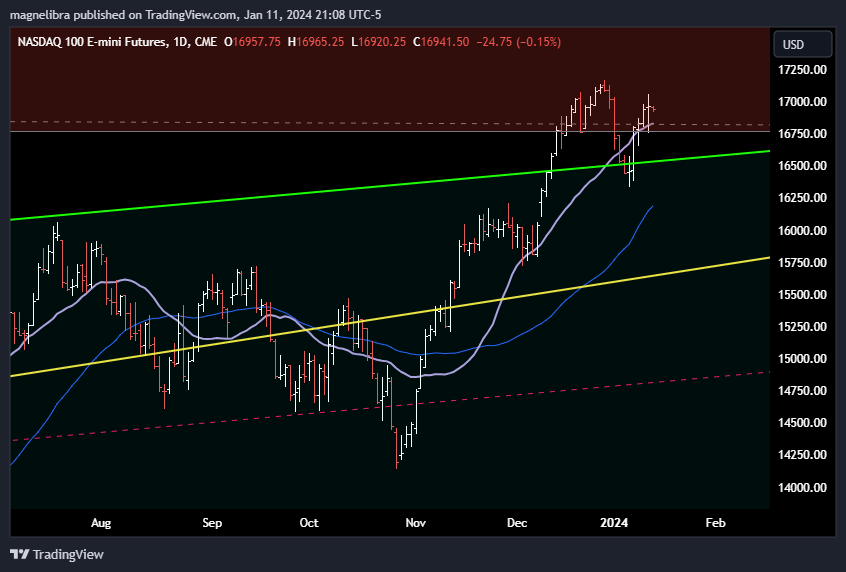
Well lets look at one more technical chart and this one is the daily Nasdaq futures. I did mention the support in our earlier podcast in the SP500 at 4775 and it seems that held which may have caused the support down at 16750 at the time to hold. Remember even though they are two separate markets the SP500 and Nasdaq, we can often find support and resistance areas are similar and one or both may be an indicator for one or the other. So as traders its key to understand that different markets in the same sector do often spill over to one another in regards to certain buy and sell pressure or flows. Today we didn’t think the 16750 area was as big as the 4775 area in the SP500 but they both held and now the daily closed back outside our trend channel keeping the bullish theme intact:
Ok let’s look at the Settlements and Trackers, starting out with the settlement sheet where we kept yesterday’s up there as well. Please note we did roll the energy sectors from Feb to March and adjusted our net changes accordingly. We can also see that the bond market was led by the big bid in the fives and twos. The equities were all lower except the Nasdaq, Bitcoin traded up to $49.1k but settled down at $46.7k, FX was mixed, energy was higher but Nat Gas had a small profit taking loss on the day and metals were all lower:
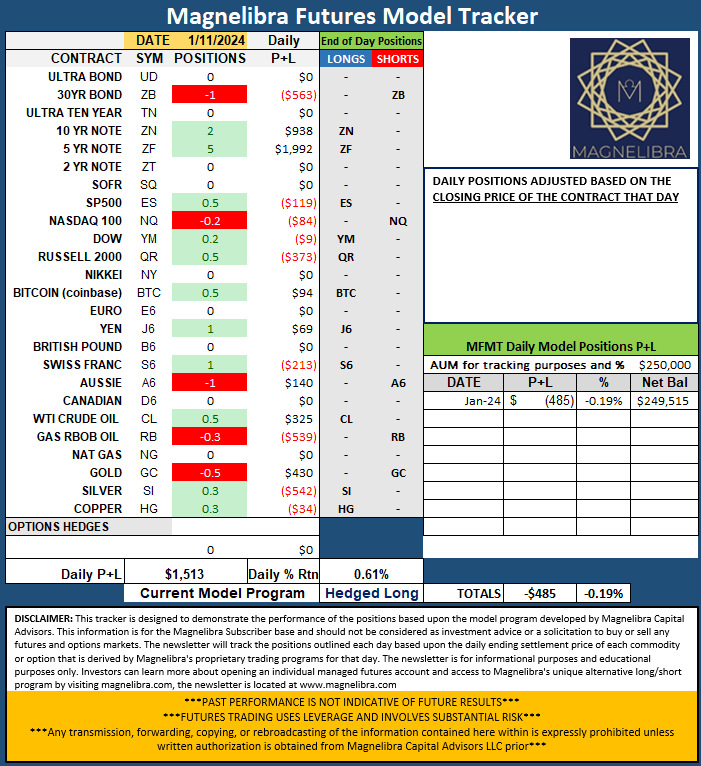
The Futures Model Tracker saw no changes and will continue to monitor the sentiments across this global macro long/short where our goal is to demonstrate pockets of strength and weakness and fine tune our total portfolio accordingly. This is an educational tracker to demonstrate positioning and risk tolerances for a given program and you can use it to model your own investing. Our goal is to show you how Magnelibra is tracking the different market segments and by providing a daily P+L you can get a good sense of the risk vs reward that is being deployed:
Alright as far as the MEGA8s pretty much a mixed bag with Berkshire the biggest loser on the day -1.28% and Nvidia seems to be losing some steam here:
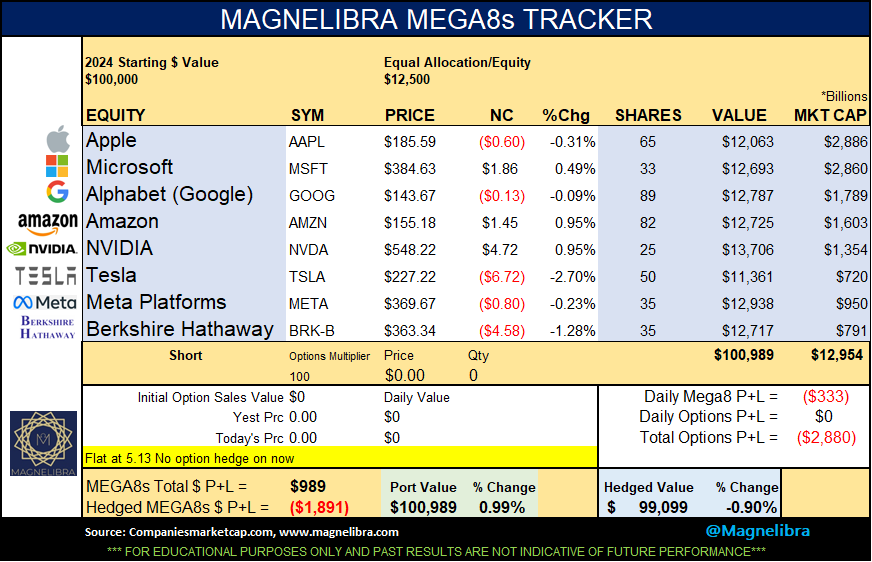
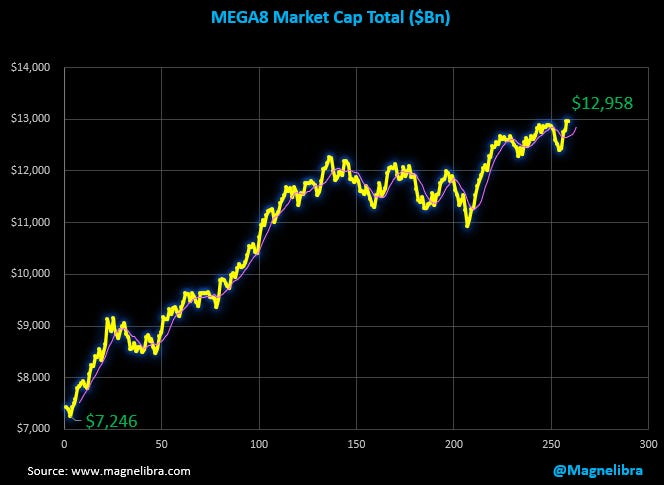
When we look at the overall market cap of the grouping we can see that it is sitting right on its all time highs, we may be looking at some sideways to lower action here as momentum does seem to be waning a bit and our moving average should is not confirming these new highs:
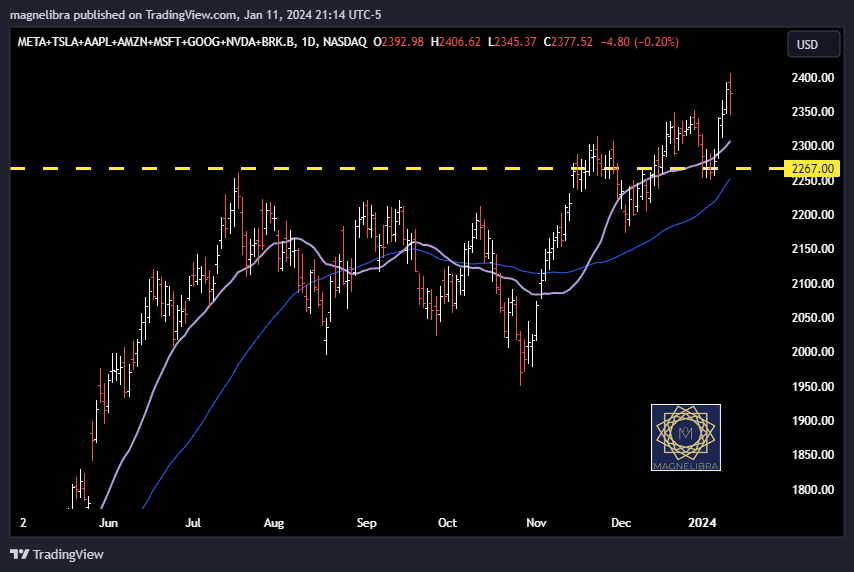
When we look at the MEGA8s on the chart the daily does not look healthy, so tomorrows close is a big one for us. We don’t have any hedges on for next week for this group but if we have a down day tomorrow we would be looking at putting on something for next week again, so we will keep you informed as to any development there:
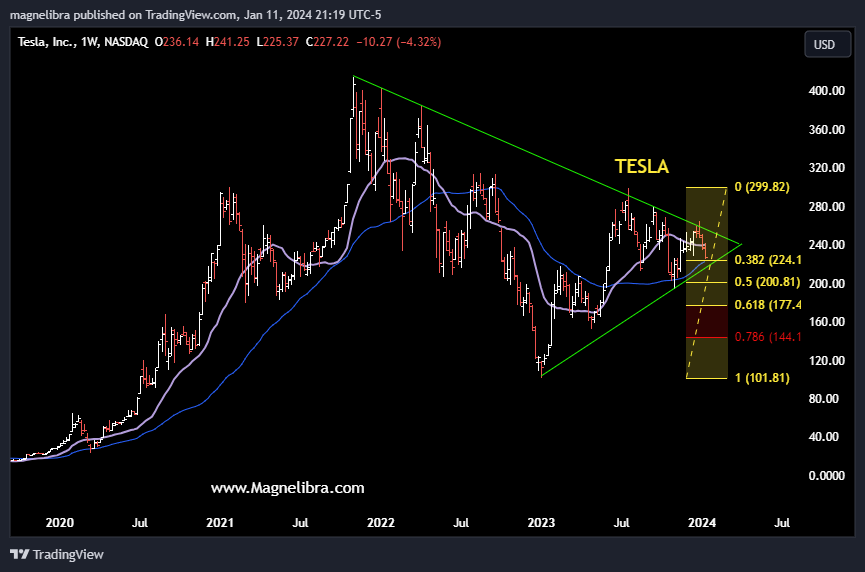
Another concern for this group is Tesla, we pointed out the triangle wedge a few weeks ago and now Tesla is nearing the .382 retrace the last hope for the Tesla bulls, because honestly below here will most likely see an attack on the base of the triangle and a break could be signaling a broader sell off in this grouping:
Alright that is it we have PPI tomorrow so keep that in mind. We want to continue to thank all of our current subscribers for supporting our work and allow us to keep providing the content each and every day. To those that haven’t subscribed please do, you get full access to our work each and every time and honestly we know that you will benefit from the mindset that we are creating and you will start to see the world in a completely different way. At the minimum please give this a like and if you can share it with someone else, we would greatly appreciate it. Till next time…Cheers


