

So apparently NFPayrolls is delayed a week till next Friday, but we have S&P Global Services PMI and ISM Services today at 9:45 and 10am EST respectively. As far as the latest data technically, what we have seen lately is Friday’s have been the main uptick day for the equity index complex as Monday and Fridays have been the uptick days while the mid week has seen the bulk of the down days. Here is a chart of that action thus far this year:
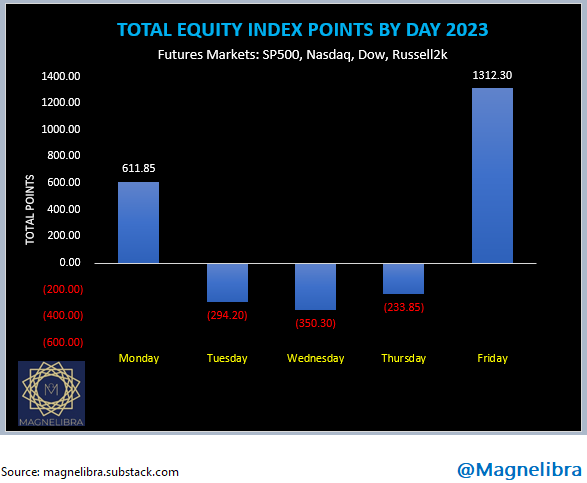
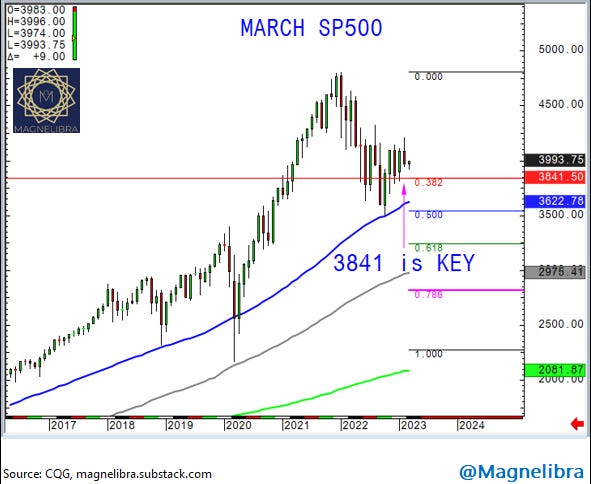
So no matter the numbers today, the market has seen Friday boast the most support out of all the days in the week. Now we also know that the Nasdaq has been lower for 4 Consecutive Fridays, but prior to that it started the year +4 consecutive Fridays. So overall we suppose its a wash in that regard, but as the chart shows, the equities have posted decent overall gains on Friday’s. When we look at the monthly chart in the SP500 we can see that we have had 5 months in a row of up, down action. We like the 3841 line in the sand longer term, but above that bulls remain in control. We saw a test of 3925 yesterday with a large buyer sitting there, so shorter term that is the support with 4044 as resistance on the upside:
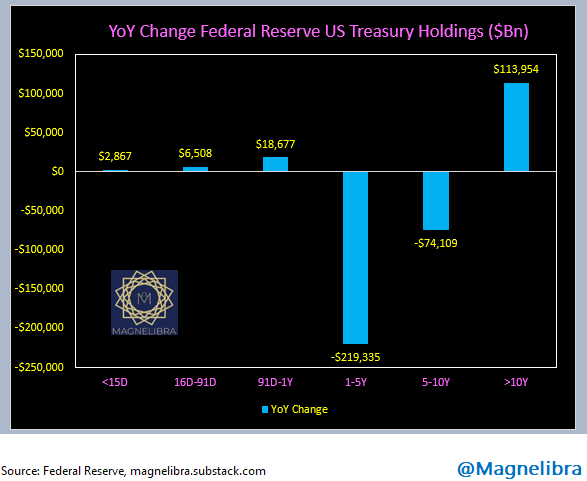
We have seen very large long end cash 30Y buyers for the greater part of the last few weeks as buyers are scouring any bids to take vs selling the front end 10Y on down. Even vs the futures the 30Y cash is up over 2 full points in the last month or so and the yield curves continue to flatten as the FED hike cycle doesn’t appear to be waning as many suspected.
We also know the global central banks are most likely supporting this sector as well as they shed the belly of the curve in favor of longer dated paper. This data is clearly evident as we look at the duration spectrum of the central banks holdings YoY:
We also wanted to correct our chart we did a few months ago on the overall Federal Reserve expected losses or their deferred asset. We believe we have the analysis corrected now and it looks that for FY2022 their marked to market loss was about $13.4 Billon on the securities portion. (Actual deferred Asset is $18.8Bn for FY2022 including the interest charges related to IORB and RRP) data can be found here, at this Link, FRB deferred asset
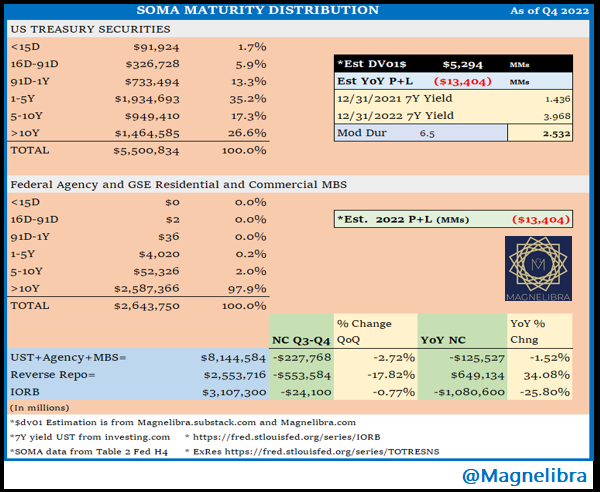
Now we know these non zero sum players don’t really take losses but it is a talking point among some viewers so we wanted to just put this data out there. We feel that the FOMC is distorting the yield curves even more with their balance sheet action and eventually this will disrupt the overall bond market as competing forces for good collateral will eventually come to a head. There simply aren’t enough Treasuries to go around if you can believe it!
Anyway that’s it, we feel that the market is very susceptible right now to some large back and forth flows as the battle rages on between fundamental weak economic data, sticky inflation and a never ending geopolitical issue in Ukraine. All in all maybe its a gift that the risk free rate is now over 4%, sometimes the volatility needs to be smoothed out over time as well as by restructuring where one is taking real risk!
The trends as we see them are that equities are seeing patient buyers and sellers, waiting for key levels like 3935/3925 and 4030/4040 in the SP500. As far as bond land, well seems like there are a lot of forced sellers in the front end that need to buy the long end. This theme has been playing out here lately and its not something we want to step in front of just yet.
DISCLAIMER: For educational purposes only. This is not a solicitation to buy or sell commodity futures or options. The risk of trading securities, futures and options can be substantial and is not for everyone. Such investments may not be appropriate for the recipient. The valuation of futures and options may fluctuate, and, as a result, clients may lose more than their original investment. Nothing contained in this message may be construed as an express or an implied promise, guarantee or implication by, of, or from the author Michael Agne owner of Magnelibra Capital Advisors. Magnelibra the CTA and its Global Futures Benchmark Program may hold long and or short positions in the various futures and markets that Econemotions covers. We will never claim that you will profit or that losses can or will be limited in any manner whatsoever. Past performance is not necessarily indicative of future results. Although care has been taken to assure the accuracy, completeness and reliability of the information contained herein, we make no warranty, express or implied, or assume any legal liability or responsibility for the accuracy, completeness, reliability or usefulness of any information, product, service or process disclosed.
ALL RIGHTS RESERVED 2023