We weren't able to put together a letter last week due to an unexpected educational trip to NYC. There we found ourselves immersed in giving an informal informative and instructional tutorial if you will to new, discretionary, systematic traders both young and old. Given the nature of our business and of ourselves really, in which we truly aspire to educate those willing and able, it was too good of an opportunity to pass up. We were also able to experience a bit of Hoboken hospitality as well, at a little Cuban place called La Isla and an old fashioned Italian joint named Leo's which are a must for any true foody. Oh and the ferry, what a great way to travel, hell it’s the cheapest boat ride we've ever taken! New York gave us her own special welcome like diving into the Spotted Pig in West Village, a mixture of eclectic delights both for the stomach and the eye. So did Chelsea Market which had so many delights to offer and which we certainly indulged, to then find ourselves grudgingly walking off our meal on the newly created green space of old elevated tracks called the High Line.
Ok back to our purpose, this week's letter will be mostly technical in nature, but first we thought we should share a chart posted by @NorthmanTrader, one in which we really couldn't pass up:
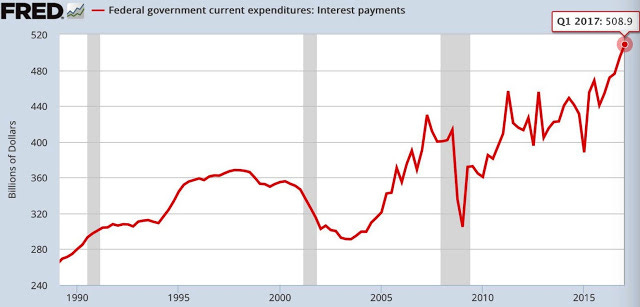
This chart shows why the mathematics of our current debt problem will continue to be a thorn in our central banks side. The only thing you need to know is that interest on debt continues to expand our money supply because in order to pay for newly created debt, we have to expand our monetary base. If we do not, well then things contract and the central banks hate when things contract, at least not when they might not want them to. Anyway we took this same chart and chained it to 2003 so we can gauge a bit of percentage perspective as opposed to a nominal $509 billion expense payment:
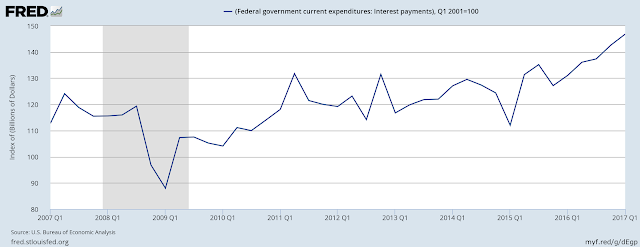
Since 2009 we have gone from 88 to 147 or an increase of 67%. This type of percentage increase will not fly in a world of $20 Trillion dollar debts. Can you simply imagine if interest payments grow by 8% a year? Let's take the nominal number of $509 billion, 8% is $40 billion dollars. This is interest, meaning nothing more than continued nominal asset price growth at the very top echelon of our economies, remember, one man's debt is another man's asset. This is also why we continue to see a two tiered economy, one by which we have described many times in the past as those that can afford to eat out and those that cannot. Those that can afford to go on vacations and those that can't. Those that can rely on earnings and savings and those that need debt. Those that need government healthcare and those that do not. It is in these dualities that our existing sub cultures find themselves mired in. It is in these concepts that our central bank overlords fail to see why their policies continue to increase asset prices all the while the global macroeconomic indicators portray benign growth. It should be no secret to our readers that we see beyond the PHD tea leaves and we have decidedly embarked upon a different path, one by which we try to simplify an extremely chaotic system in order to formulate some sort of rational thinking. Although rational and fundamental processes seem to have lost their luster to a more profound lunatic academia, we will press on.
Once again we will not fight the laws that govern our system and we know these laws have one master, central banks themselves, who continue to pour Trillions and Trillions of dollars into a system whose only beneficiaries seem to be the very top of the pyramid. Who controls markets? Who benefits? What incentives do they have to change this system? These by our accounts are simple questions to answer, ones by which we answer every week in our missives. We hope by now you understand that the central banks themselves control asset prices. They print and buy, print and buy and for all intents and purposes have created a singular less granular system. This is why active management has been stung, this is why passive investing is the new active management, yet this is why it too will fail miserably. At some point in time, things will change and what worked before will no longer work, we just hope we catch it in time. For now its Buy in May and hope and pray. Hope and pray the central banks continue their non zero sum game. Hope that inflation doesn't rise uncontrollably, hope that those big beneficiaries have spread their wealth and allocated accordingly to absorb the future liquidity shocks that will come, because they always do rear their ugly heads. But then is not now and all we have is now. Remember yesterday is history, tomorrow a mystery but today is a gift, that is why it is called the "present." (not sure who to credit with that quote other than Kung Fu Panda)
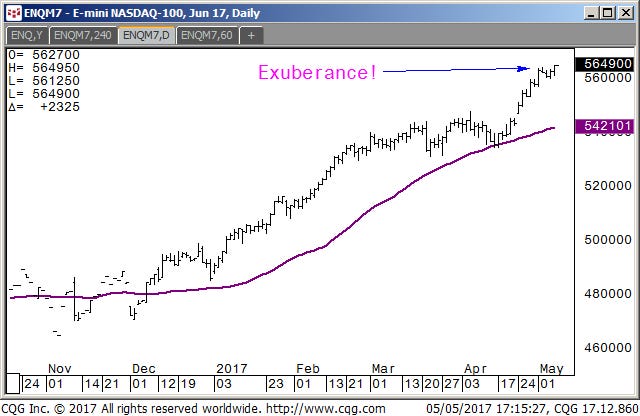
With that said last week's action saw continued exuberance out of equities, especially with a highly anticipated Macron French victory. Bonds continued to waffle mid to lower range in what appears to be a refunding auction set up. Oil and Metals continued their drubbing, while little known Bitcoin was up some 52%. We say little known but our readers are well up to date on crypto currencies and we expect more out of the likes of them in the future especially Ethereum and Bitcoin…so let's get to the charts so that we can visualize the flow. This next chart shows the nice run up in the Nasdaq:
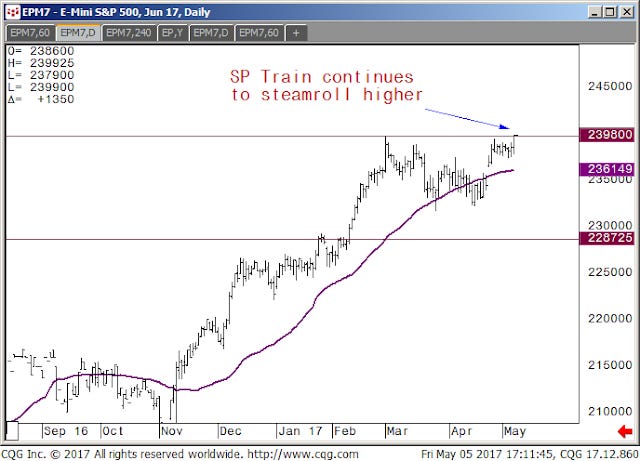
Next we have the SP500 breaching 2398 prior high and resistance:
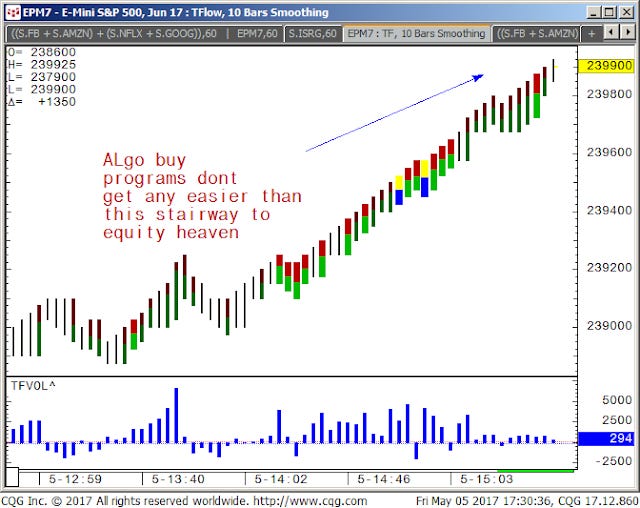
Just for your viewing pleasure and just to show you how linear buy side algos can be:
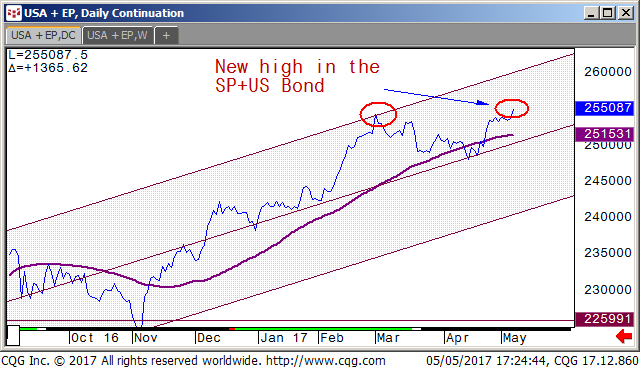
Our reflation chart or the SP500 + US Treasury Bond is shown near new highs once again:
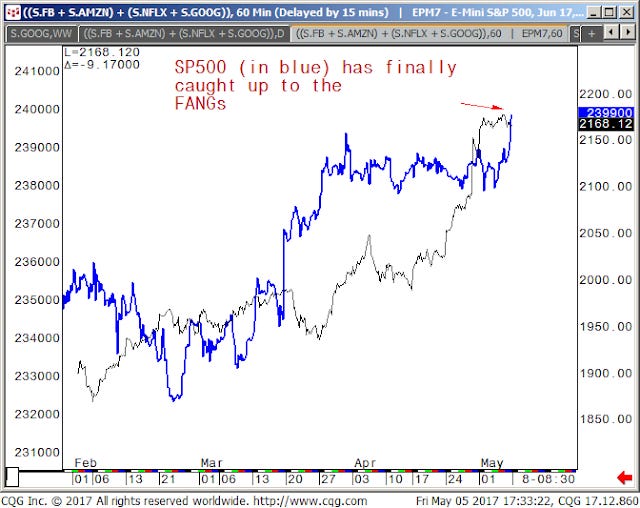
We also show in the next chart the SP500 vs the FANGs which the SP500 seems to have finally caught up to the techs optimism:
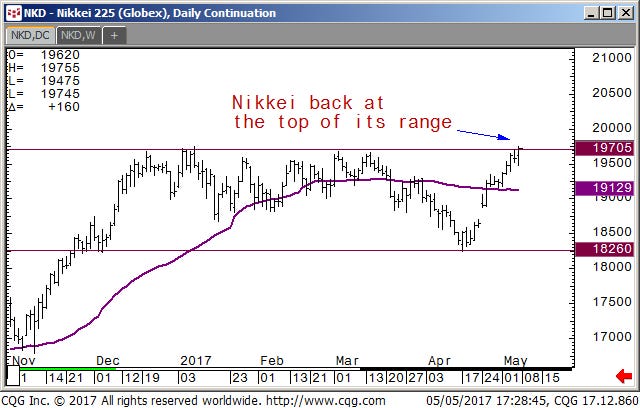
Not to be outdone, the Nikkei index has sprung to life and has finally closed above that 19600 level which does bring into question, have the BOJ finally pushed it to its limit?
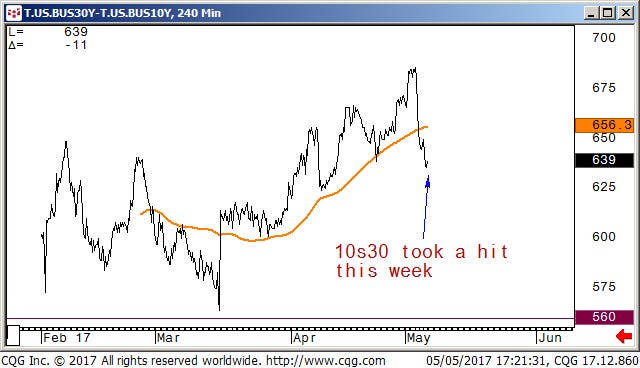
Moving along to the US Treasury markets we can see that yields rose a bit especially in the front end and denoted by the flattening of the 10s30 or NOB spread shown here:
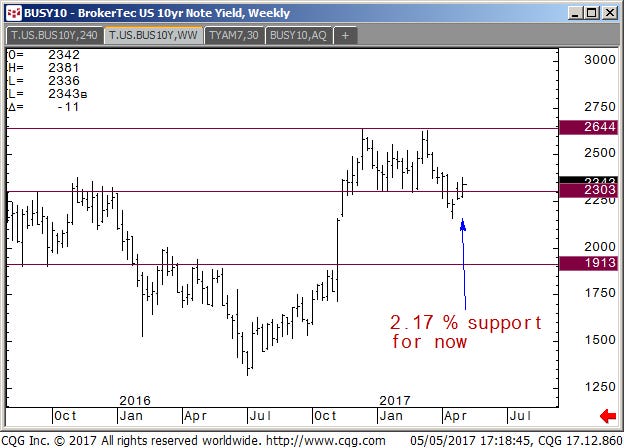
The US 10yr Treasury yields rose and holding near 2.30%:
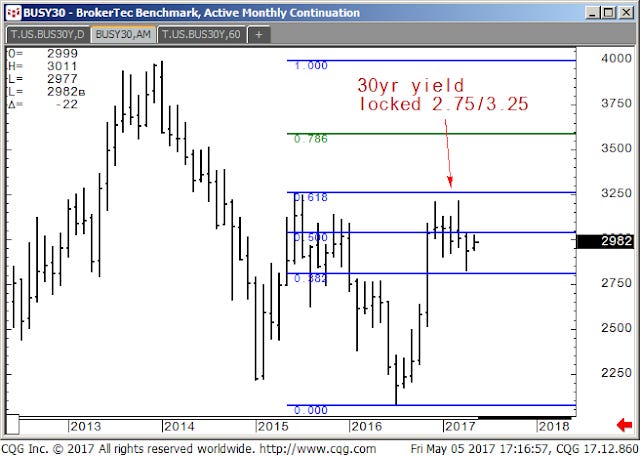
The US 30yr Treasury yields once again are approaching the 3% level:
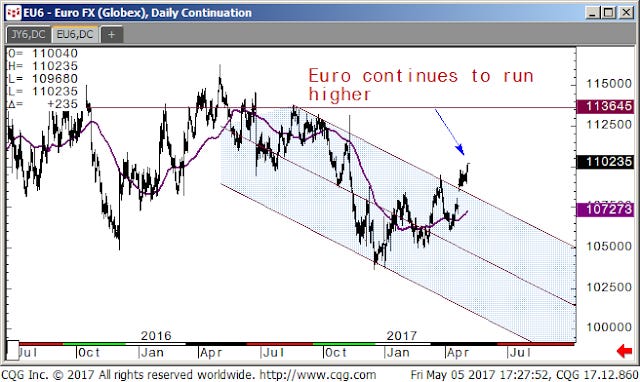
Heading over to currency land the Euro continues to climb:
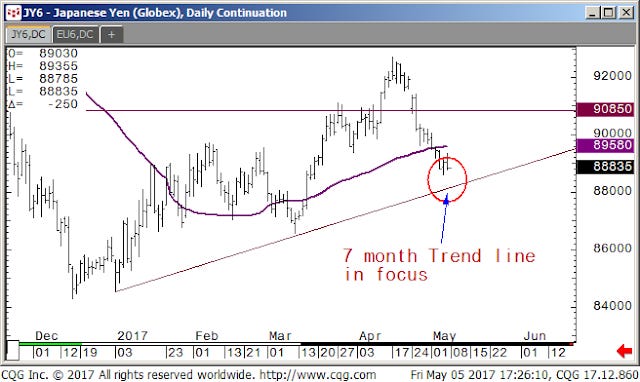
The Yen is approaching the 6 month trend line support:
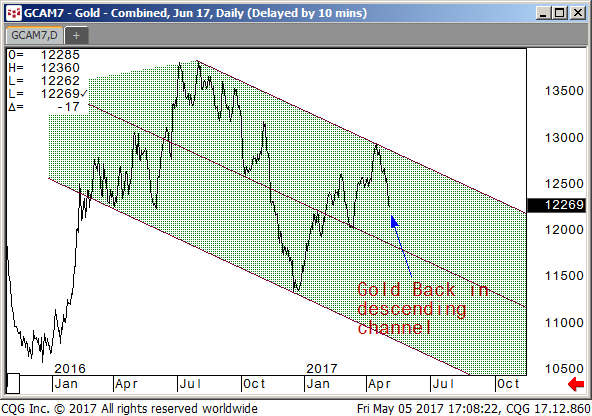
Moving over to the metals complex you can see gold and silver both taking it on the chin, not sure if naked paper short sellers or any real reason, or just more central bank suppression. The gold chart is firmly entrenched in its trend channel and no real direction will be taken until it is broken, for now the path of least resistance seems to be lower. Perhaps this is real asset selling to raise cash, a sign of stress?
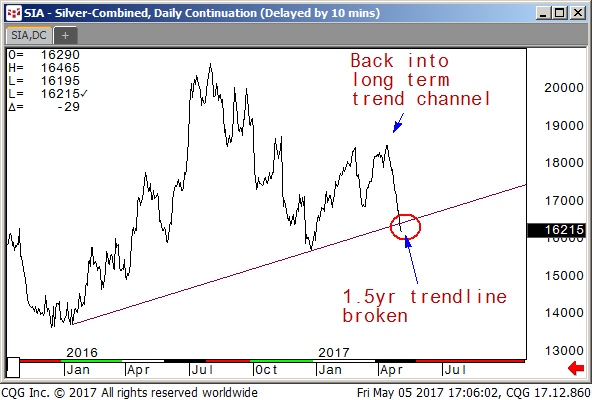
Silver is just broke a year and a half long trend line, will see if there is any defense this week:
Copper is also butting up against long time support a break of which may open the downside:
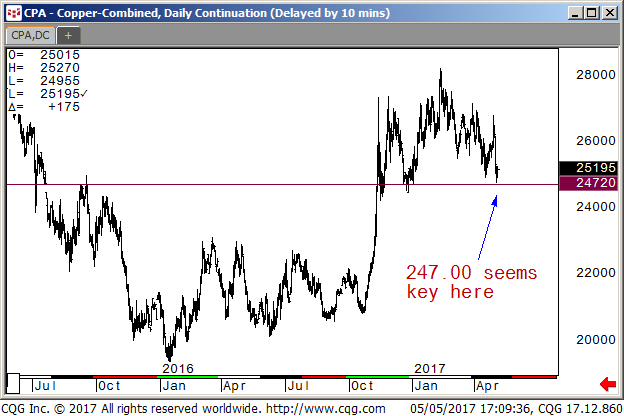
The last chart of the week is the Crude Oil chart:
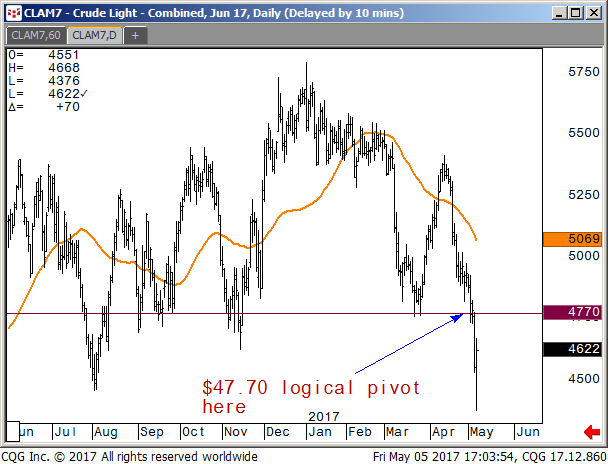
Stories were abound about high profile oil long traders finally tossing in the towel, no need to mention any names, not worth it, doesn't matter, it all ends up adding to their notoriety to raise more capital in the future to merely try the game all over again! We would be surprised at a rally from here.
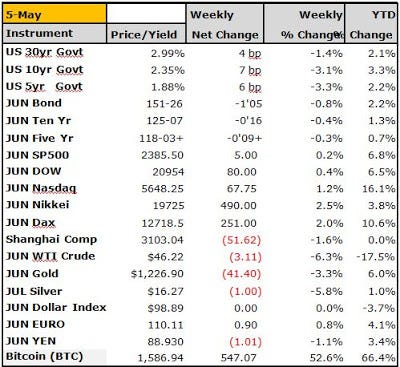
Ok that's it for this week we hope you enjoyed the content and we hope we enticed you enough to continue to follow us in the future. We can't help but think that these markets exhibit enough irrationality for the sane person to say, hey we need some know how, something or someone that can make sense of it all. If not, at the very least we hope we provoked you into thinking in ways you may not have prior. Anyway enjoy the rest of the week and as always we leave you with our weekly settlements. Which by the way shows the huge run up in Bitcoin this week as it begins to gain a firm footing and wider acceptance, especially in Asia. The Nasdaq continues to shine, but the Dax is slowly gaining some strength, it seems if some macro parity funds have found their way to the German market and this may just be the beginning, so we will keep an eye out. Crude once again the weak link on the week. Cheers!