

We just wanted to provide our readers with a bit more in-depth look into our chart of Central Bank assets. Many do not bother to look at composition changes but rather focus on the nominal total change. We don’t blame them, the change in a little over a decade is staggering 107% and no wonder asset prices rise right. Simple concept,
“more debt money = more debt = higher nominal asset prices via devalued current dollars”
Ok we know that, but what this chart wants to focus upon and since the FED will likely err on raising rates, will it really have the effect they want? Commercial Assets broken down by % change in composition paints a very different picture from circa 2010 assets breakdown. Three distinct changes stand out to Econemotions:
Cash is +79%
Trading assets are +73%
Loans are -23%
Cash is obvious, its a sterilization tool as its barred from going anywhere but reserve and IOER status. Trading Assets is an interesting one, we tend to think this seems appropriate given the obvious size of balance sheets, but also leads to London Whale incidents as one can merely utilize in house mechanisms to hide various levered bets, especially with $1.7T. The final point, Loans being down 23% makes sense as this is “the real way economic money is created” and fractional reserve lending is factored, levered to whatever and increases the velocity of money. We expect the Loans section to marginally decrease as they expand as this would lead to an even worse inflationary problem if they didn’t. Anyway here is the chart:
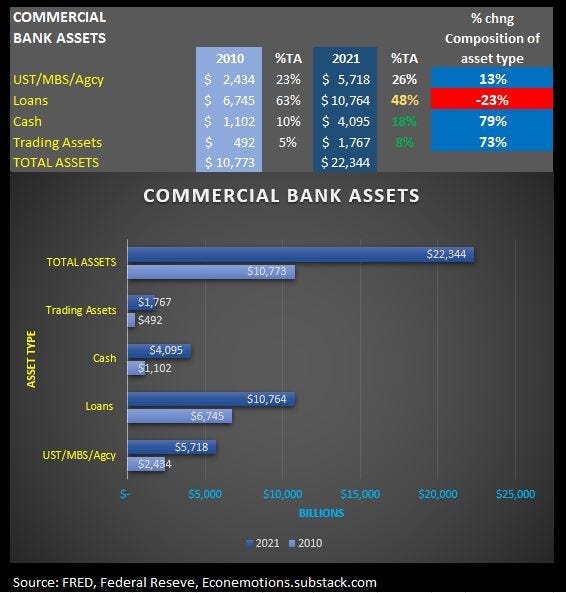
So with that we see the zero bound rate control mechanisms are leading to changes in the composition and furthermore we believe this is simply concentration of control and is leading to some very dangerous non competitive and concentration of wealth inequalities. The sheer amount and size outpaces its actual utility in the general economy and leads to leverage and speculation that can hide under the sheer magnitude of these numbers. Hide until the general loss is obvious enough relative to the size of our economies (think 2008).
The Central banks escape routes are very narrow and we can tell given their composition of commercial banks assets that their mechanism of inflation control are sterilization and decreased broader lending, we can further tell that their only real route of slowing the economy would be to raise rates very very slowly and increase the use of Reverse Repos to change the collateral composition of private portfolios.
Reverse repos are running at $1.5Trn overnight and counterparty expansion will be necessary to manage this pig however this is leading to massive rehypothecation of collateral and this is a serious problem especially if one link in this chain becomes to big for their britches, think 2008 on steroids!!!
So needless to say the FEDs and all global central banks predicament is not an easy one to navigate, nor is it as simple as raising a few 25 bps here or there This is a much larger and complex issue than that. We expect the FED to baby-step this and not increase rates quickly, rather take the slow road with their reduction in UST/MBS purchases and see if things unwind or spool out of control.
Next up, shout out to Bill Miller, whom we love because he has become the older generations voice of reason when it comes to Bitcoin. He has become one of Bitcoin’s biggest outspoken advocates and his recent interview is a #mustwatch which you can find here, Bill Miller on WealthTrack
What stood out to us was this little tidbit:
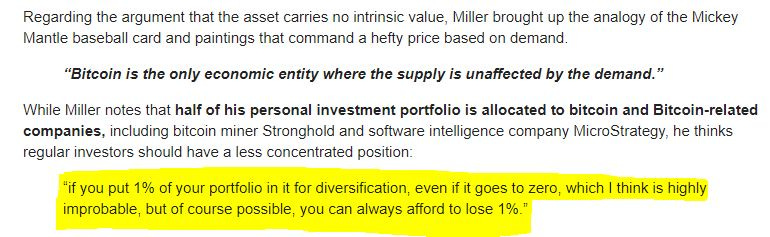
Our yellow highlight above, yes the profoundness of that statement should resonate with all of you and is the most sensible piece of advice a pro legend like that could give!
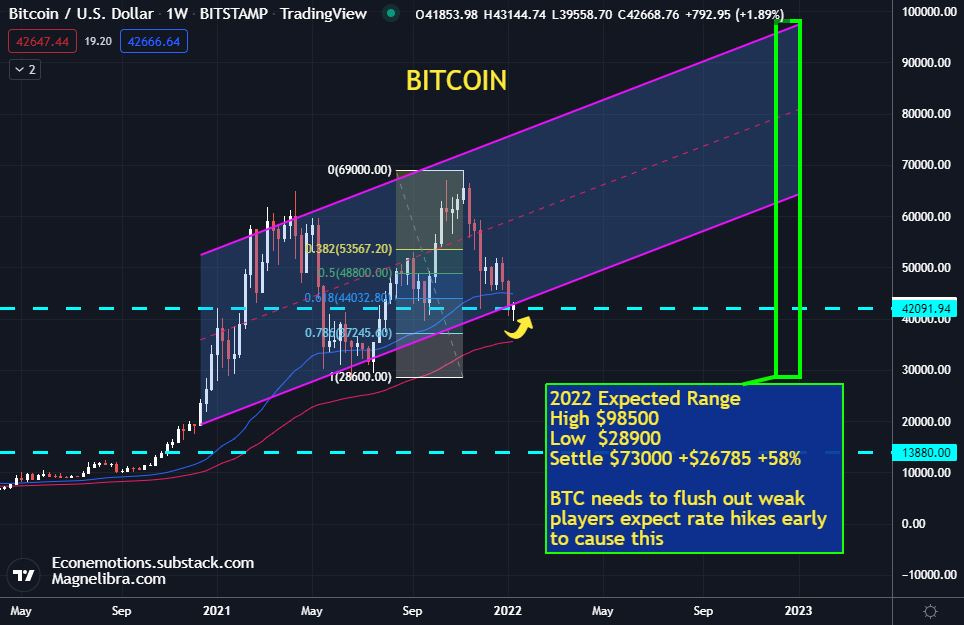
On to the Bitcoin chart itself and we chose to keep our target range on the chart for this one as the $40k area has been tested. Was this the first flush necessary for a broader move higher? $42k is our first line in the sand and the opportunity is here, what are you going to do?
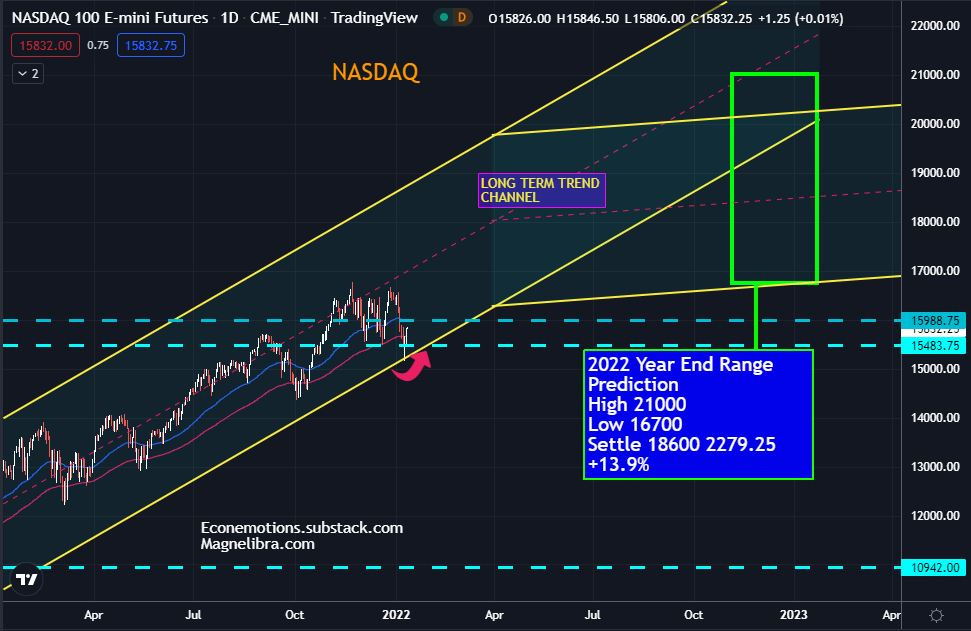
Let’s look at the equities via the Nasdaq futures chart where our long term trend line held the first time down and the next hurdle becomes 15988 for the bulls:
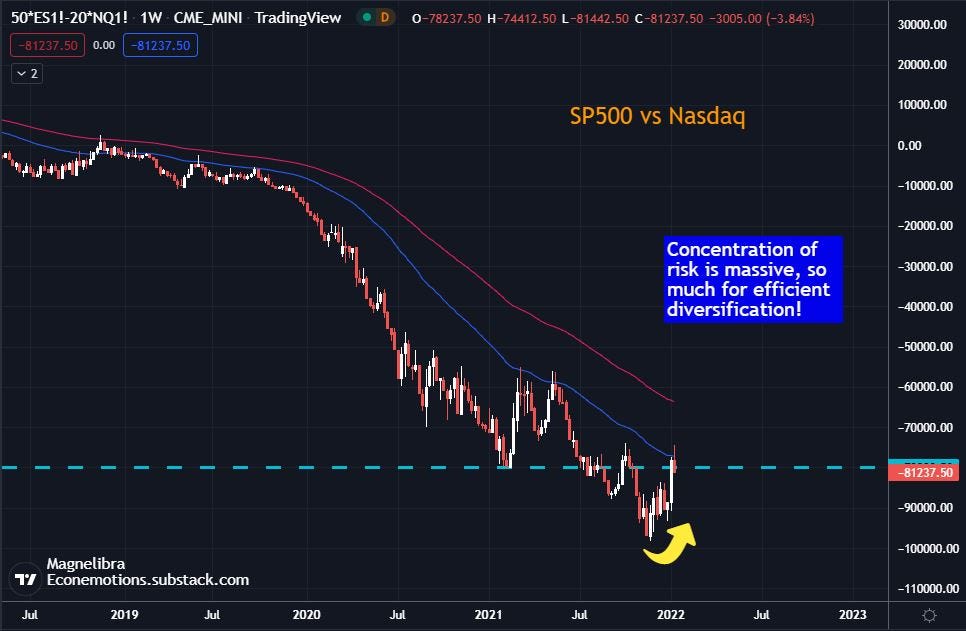
When we look at the comparison of the SP500 vs the Nasdaq we can see the absolute drubbing of the SP vis a vis. This to us spells massive concentration of AI program betting and concentration of positioning among the top holders of NQ and derivative control of any other equity diversification or risk. I.E. Why diversify when you have leverage, speed and derivatives…no need and thus why not and since the start of 2020 the SP has drastically underperformed vs the NQ:
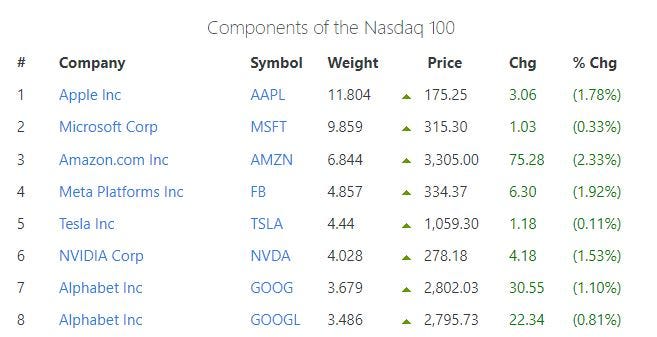
As far as the components if you don’t know how the AI pros are doing it, well hold this basket below, play a few derivatives and charge 2/20 and voila:
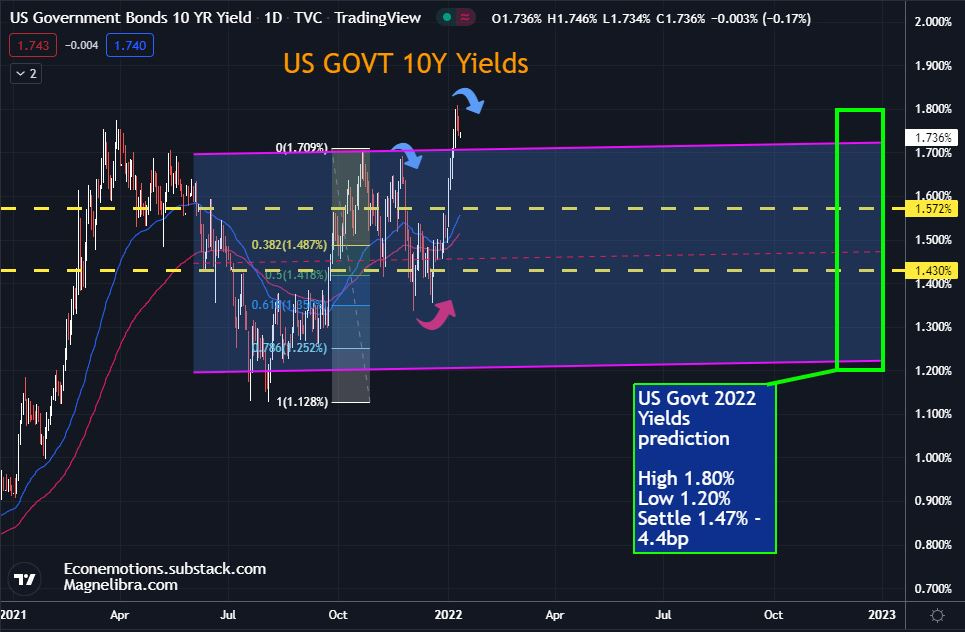
Finally we have the US Govt 10yr which hit the top of our 2022 range out of the gate, hey don’t kick a gift horse in the mouth, if the FED is going to raise rates, truly, the last place you will see it show up is in US 10yr yields, the fronts will get plastered first, i.e. 2s5s7s:
Alright that’s it for today, we hope to bring you more content and insightful thought provoking points. Our goal is simple, to get you out of main stream thinking and thinking outside the box, we hope you join and support our work!
Please think about joining the ranks that subscribe and get our thought process when we see things that are relevant, that matter and not just the BS fluff you get everywhere else. Your support is greatly appreciated. We write about the equivalent of one book a year on this site and the volumes we speak should transcend a lot further than these pages. You should be able to implement a lot of this into your game plan not just in trading, but in all walks of your life. We are in this together whether you believe that or not, it doesn’t matter, we are all connected, so stay positive and know your atoms do have an effect on everyone else around you, so STAY CALM and SIGN UP TODAY!
DISCLAIMER: For educational purposes only. This is not a solicitation to buy or sell commodity futures or options on neither commodity futures. The risk of trading securities, futures and options can be substantial and is not for everyone. Such investments may not be appropriate for the recipient. The valuation of futures and options may fluctuate, and, as a result, clients may lose more than their original investment. Nothing contained in this message may be construed as an express or an implied promise, guarantee or implication by, of, or from the author Michael Agne owner of Magnelibra Capital Advisors. Magnelibra the CTA and its Global Futures Benchmark Program may hold long and or short positions in the various futures and markets that Econemotions covers. We will never claim that you will profit or that losses can or will be limited in any manner whatsoever. Past performance is not necessarily indicative of future results. Although care has been taken to assure the accuracy, completeness and reliability of the information contained herein, we make no warranty, express or implied, or assume any legal liability or responsibility for the accuracy, completeness, reliability or usefulness of any information, product, service or process disclosed. ALL RIGHTS RESERVED 2022