

Well for those that didn’t read our latest post, we will share one of the most significant charts that many have never seen before. In fact we are probably the only place you will see a chart like this, why? Because its part of a specialized trade that only a few people actually do. We have done this trade for the greater part of the last 20 years and it is the “Bond Basis” trade. Within this trade there is a function called cost of carry. We will not get into the mechanics behind it other than posting the chart of this cost of carry here:
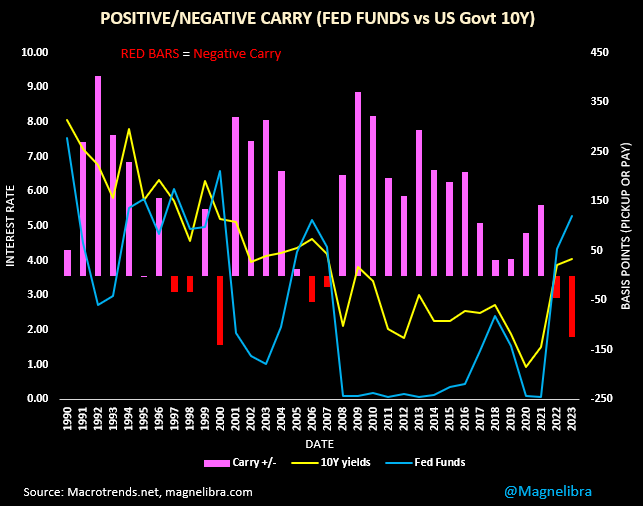
The red bars indicate NEGATIVE CARRY and this is when the very short rate, most people know as Fed Funds, bond arbs know a better term for the short rate, its GC or General Collateral. Now what this chart shows is very specifically, the times where Fed Funds is higher than the US Govt 10Y rate, the general economy seems to be stumbling or will stumble in the near future. We show this because we are not in the JPowell no recession camp, rather we are in the exact polar opposite and in the Hard Landing camp, which we suspect will show up even more so, come the the first NFPayroll negative print.
We are starting to see cracks in the consumer already as today’s Consumer Revolving Credit data posted the first decline in almost 2.5 years:
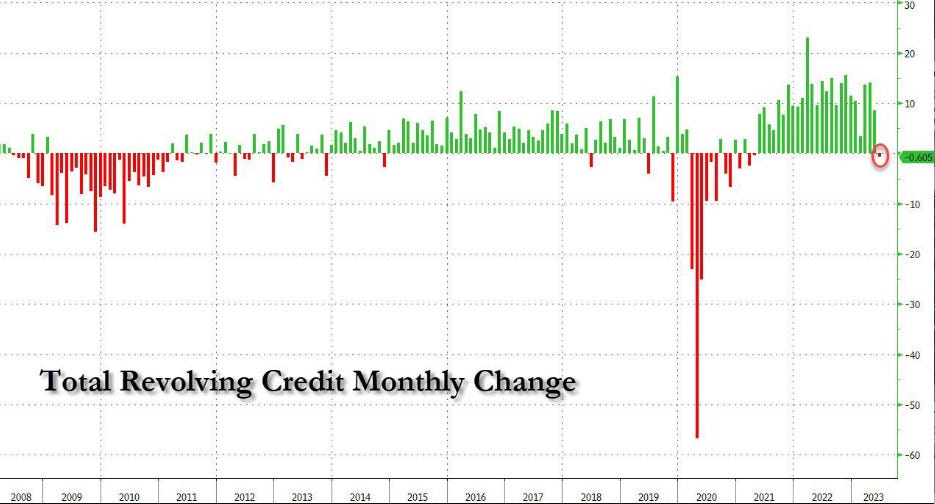
Certainly nothing to cheer about. We know the higher prices go the harder it is to afford things and its not that complicated. We know the FRB is watching all of this and hoping and praying the house of cards doesn’t tumble out of control, its like 2008 all over again. We know the FRB knows this and we know that is why they are not reducing their balance sheet as much as they said they would. Back in April 2022 they were suppose to begin reducing it at a rate of $95Bn a month, $60Bn USTs and $35Bn MBS…well they are short of that goal by about $280Bn:
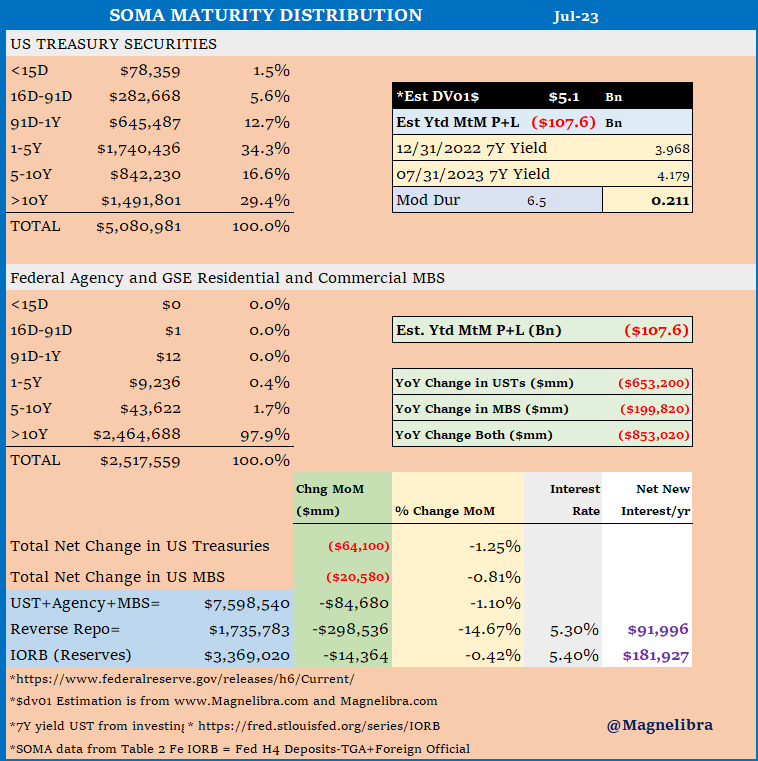
What you can also tell from this data is that the net new interest per year as shown in the data in purple, $274Bn per year now between the RRP program and the IORB. Why the FRB still pays IORB is a discussion for another day, but reporters should ask him about this. Seems counterproductive given the 525bp increase in Fed Funds.
When we look at this chart we can see the SP is above the FEB 2022 highs, the Fed Funds is at its highs and the US Govt 5Y is at its highs, go figure, rates don’t matter to asset prices or do they?
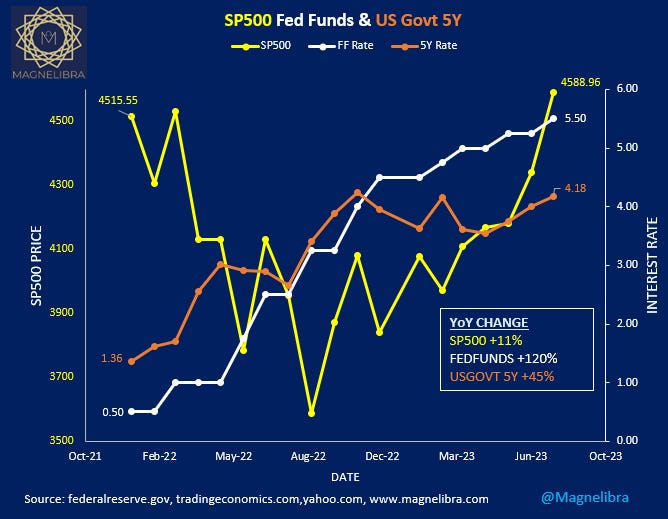
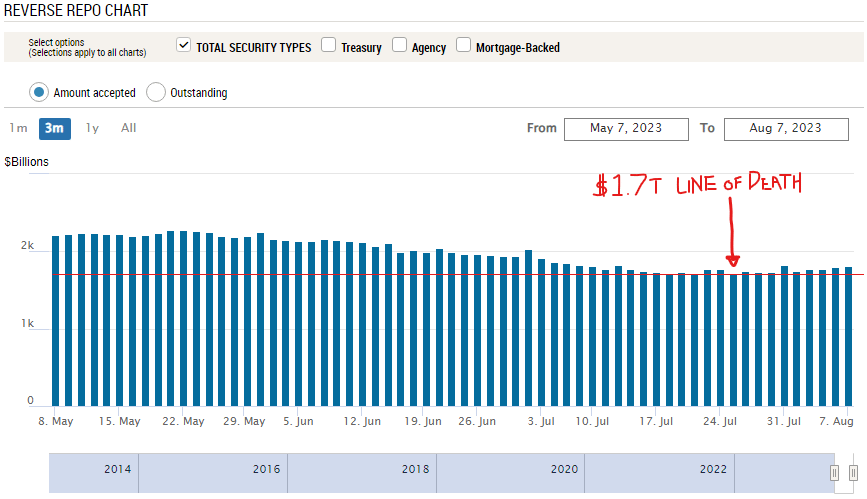
We believe rates matter but are being supplanted by that $280Bn in net new risk free interest, the BTFP, and the lack of full balance sheet run off and of course we know the RRP line of death is near, we have yet to see our $1.7Tn level breached, but it got close a few times:
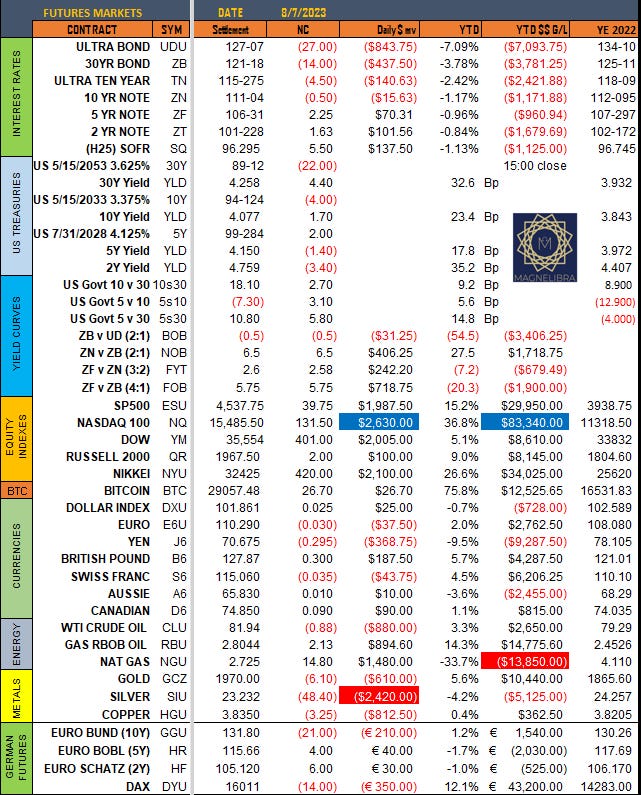
Alright let’s take a look at our settlement page for the day with the US yield curves steeper again, equities putting in a decent day as well:
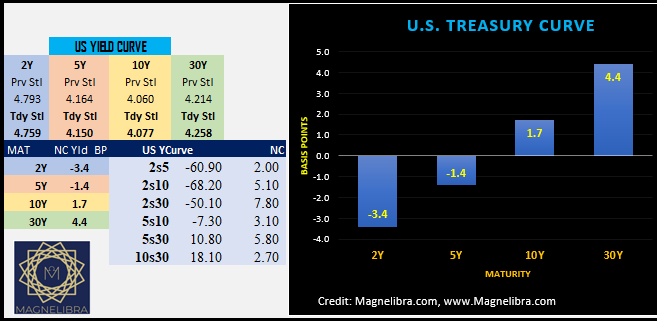
As far as that yield curve, they have really steepened over the last week or so here is how they settled out today. Just for reference that 2s10 and 2s30 were -100 just about 2 weeks ago:
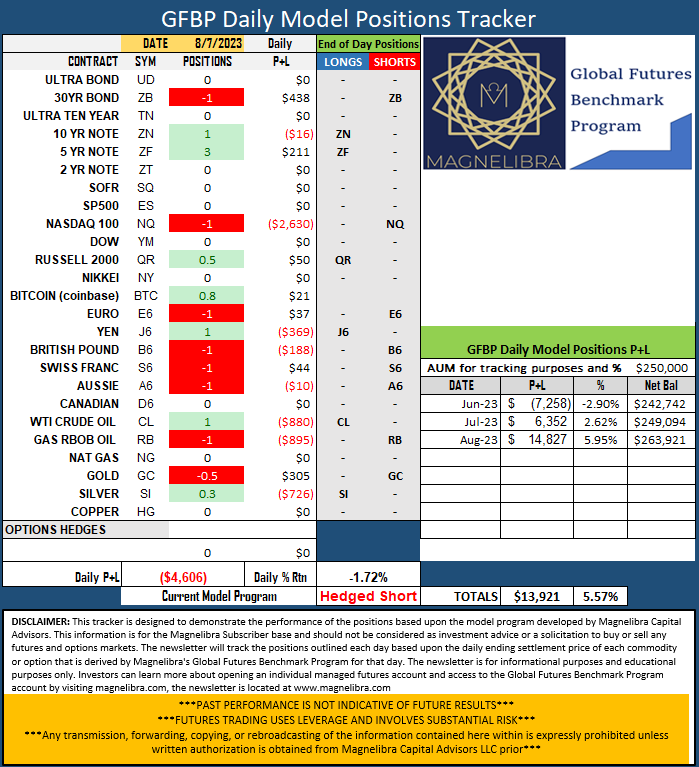
As far as our GFBP Tracker it gave back some ground today, but we believe the tracker sentiment isn’t close to changing much, but will add to the steeper US curve on any pull backs:
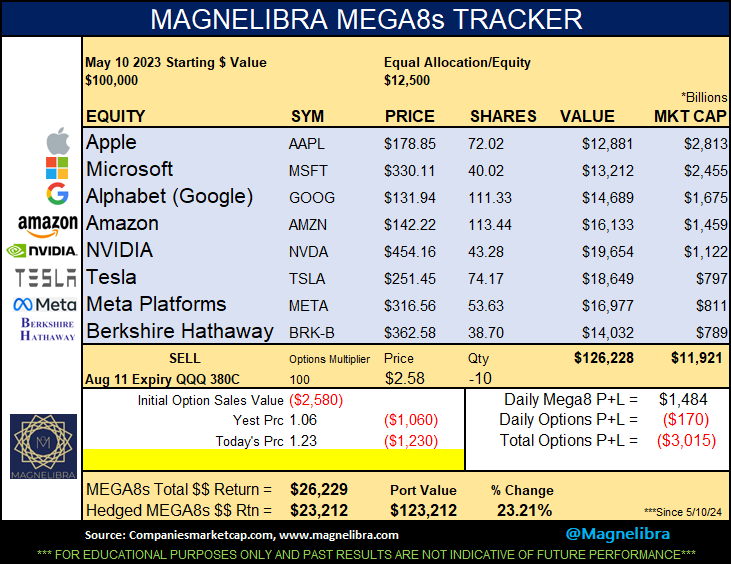
As far as the MEGA8s Tracker they are still holding in, our options hedge lost a little ground but not much today, we continue to expect sideways to lower here in the complex:
Alright that is it, thank you for all our subscribers who support our work. Thank you to those who share and try to grow our letter for us. As we said, we put out a lot of insight a lot of chart work and we hope that our readers gain a better understanding of the markets, how we view them and perhaps will lead you to improving your own game.
DISCLAIMER: For educational purposes only. This is not a solicitation to buy or sell commodity futures or options. The risk of trading securities, futures and options can be substantial and is not for everyone. Such investments may not be appropriate for the recipient. The valuation of futures and options may fluctuate, and, as a result, clients may lose more than their original investment. Nothing contained in this message may be construed as an express or an implied promise, guarantee or implication by, of, or from the author Michael Agne owner of Magnelibra Capital Advisors. Magnelibra the CTA and its Global Futures Benchmark Program may hold long and or short positions in the various futures and markets that Magnelibra covers. We will never claim that you will profit or that losses can or will be limited in any manner whatsoever. Past performance is not necessarily indicative of future results. Although care has been taken to assure the accuracy, completeness and reliability of the information contained herein, we make no warranty, express or implied, or assume any legal liability or responsibility for the accuracy, completeness, reliability or usefulness of any information, product, service or process disclosed.