


Thanks everyone for joining us for this week’s Econemotion brought to you by Mike Agne of Magnelibra Capital Advisors. You can find our blog page at www.econemotions.comwhere we write our weekly thoughts in hopes that we can provide you with unique insights upon markets, trading and risk.
I am the manager of Magnelibra Capital Advisors which is an NFA registered CTA, that manages individual accounts and executes the Blue Dragon Discretionary Program, a long/short relative value futures and options trading program. Feel free to visit our website at www.magnelibra.com and follow me on Linkedin as well.
“Our mission is to be a significant portion of your portfolio’s alternative asset allocation”
There has been a tremendous amount of speculation circulating around whether the U.S. is moving into a recession. As many of our readers know, one of the things we like to look at as a forward indicator is yield curve inversion. Here Pension Partners Charlie Bilello puts out an excellent graphic, which highlights the fact that its been 13 years since the U.S. yield curve last inverted in regards to the US 10yr vs the 3-month bill (-0.49):
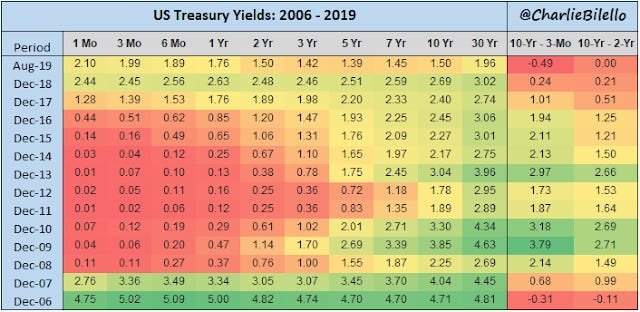
Yes, we know the text book academic definition is 2 consecutive quarters of negative GDP, yet in today's increasingly predictive modeled world, nobody cares about after the fact! As you can see December of 2006 was a full 2.5 years ahead of the 2 negative quarters of 2009.
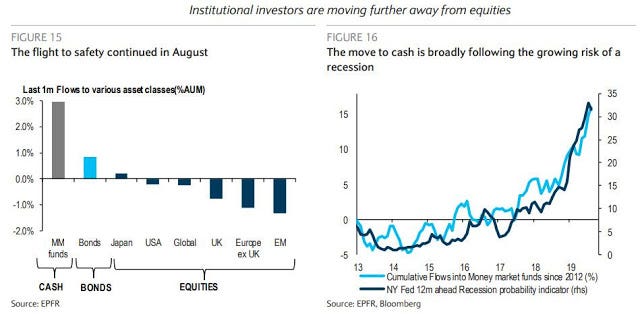
With the ramp up in money market flows which transpired into record low U.S. yields, we can’t help but think this panic buying of safety seems to have run its course. All the while the equity markets continued to show their resiliency, most likely on the hopes of this weeks ECB meeting where we expect them to lay the foundation for future central bank largesse. Anyway, you could see the start of this week has seen some heavy momentum investing liquidation where value is being sought over growth. This comes on the heels of a disastrous underperformance all year long of the Russell 2k vs the SP500 and Nasdaq markets. We have also seen liquidation in U.S. bond markets and metals have certainly lost their mojo. Anyway, we thought this chart depicts the last 1-month asset flows and they tossed in a recession forward indicator to boot:
So, before we get into some of the pair’s trades, we watch let’s look at the U.S. 10yr and then Gold as profit taking has ruled the last few days!
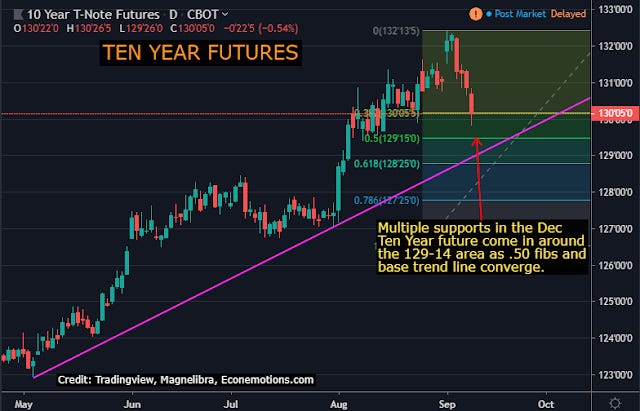
As you can see the 10yr has pulled back from the 132-16 highs and has fallen continuously, we peg 129-14 nearly 3 full points off the highs as near support. Now looking at gold we see a similar profit taking move:
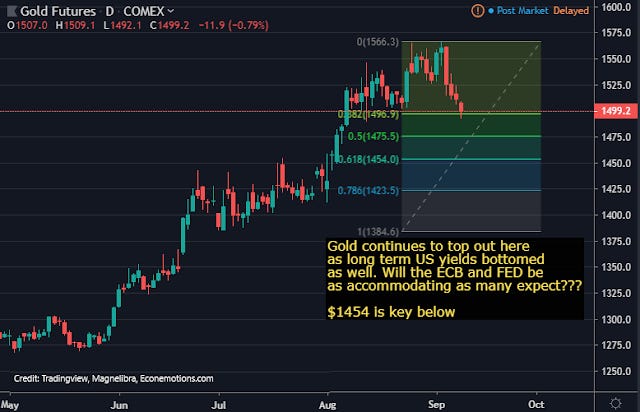
Gold is down over $70 and is at risk for falling all the way back to key longer term supports at $1460.
Now let’s get into some further analysis of the move into value over growth here which by the way has seen the Russell 2k get smoked vs the SP500 and Nasdaq for the greater part of this entire year. Is this a reversal of this trend? Maybe, but we feel that since money is so concentrated now, reversals take a long time to work themselves out and that this is just the beginning of more to come. For us it feels like risk is being taken off the table here in terms of the Nasdaq as the tech heavy index is certainly under the scope lately, especially in terms of anti-trust and censorship rhetoric making its way around DC these days.
Anyhow these next two charts are a couple of Magnelibra prop charts that we use to gauge real contract dollar risk of one asset vs another. First up let’s look at the RTY vs SP500 1:1 pair trade. You can see dollar for dollar actual gain/loss here:
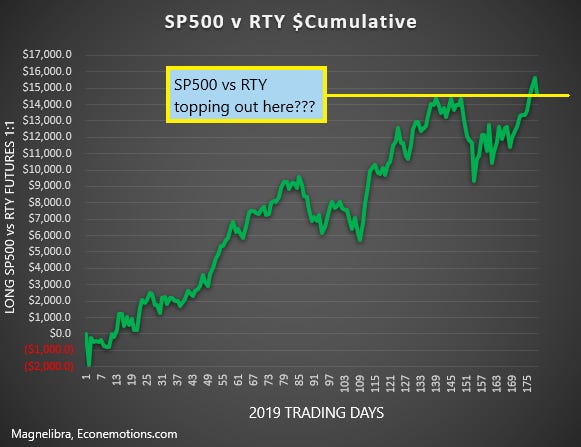
As you can see the SP500 futures out gained the RTY by nearly $16k this year. This chart set up may just be the beginning of a move the other way.
As far as the RTY vs Nasdaq, we look at it with a 2:1 ratio, long 2 RTY vs short 1 NQ:
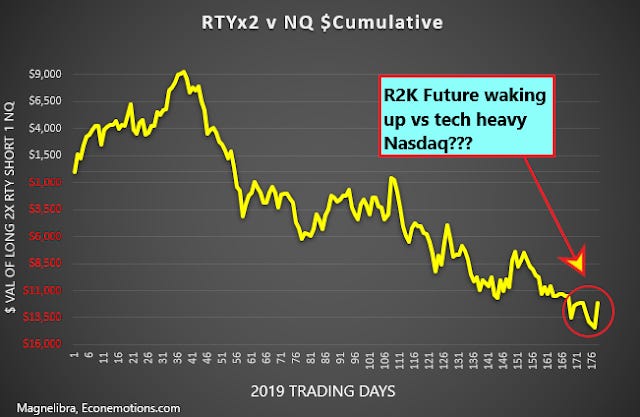
As you can see from Feb. on the RTY has lost some $23k from that $9k high. Is the momentum over for tech outperformance? Speaking the Russell 2k let’s look at a nice tech chart here:
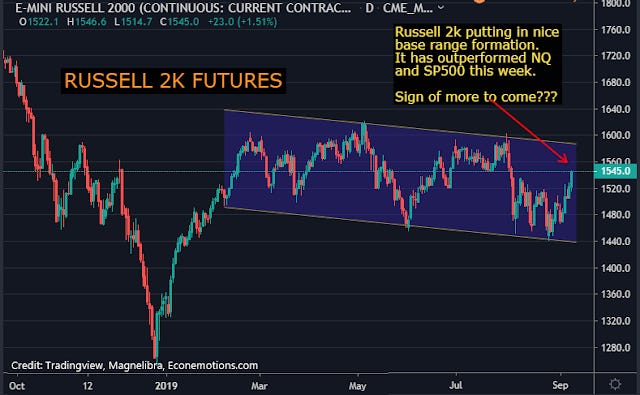
This box is about as clean as we can get and if the overall market is going to attack new highs, it will have to come with a breakout of the RTY out of this channel. Just to be fair, the downside will be ushered in with the unfortunate roll out below 1425 area!
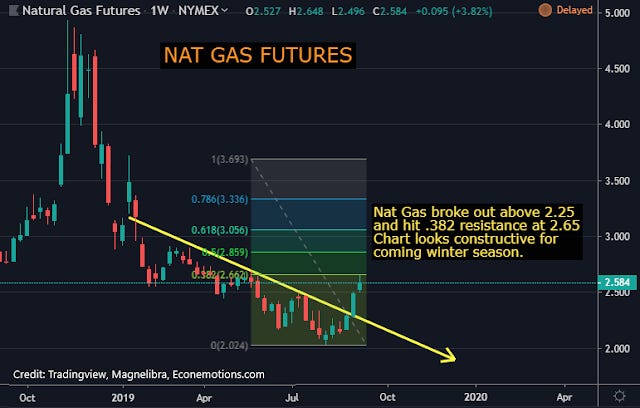
So what charts are looking good, well energy has piqued our interest. A few weeks ago, we noted the base of Nat Gas forming and possible break out above 2.25 may see some follow through, well here is the latest chart. We took a longer view chart just to show you how far Nat Gas has fallen:
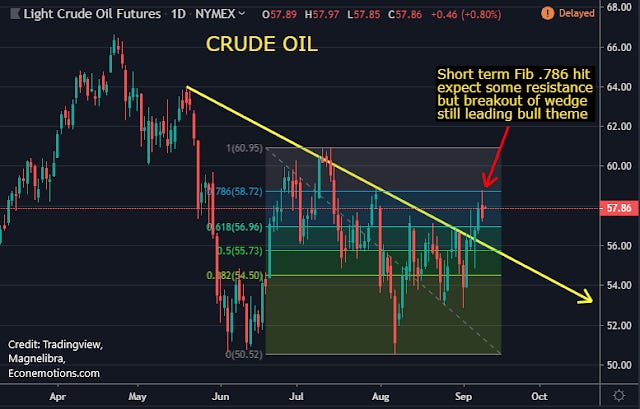
We also like Crude Oil as it has broken out above $56 but continues to be plagued by $59 which we feel is the first order of business for a renewed bounce to attack 2019 highs of $66:
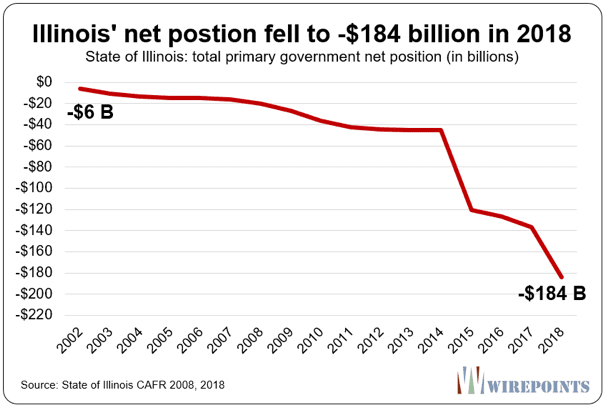
Ok so that pretty much does it, we have a few other items to not this week, Illinois just came out with a terrible picture of its fiscal net position, let’s just say the chart speaks for itself:
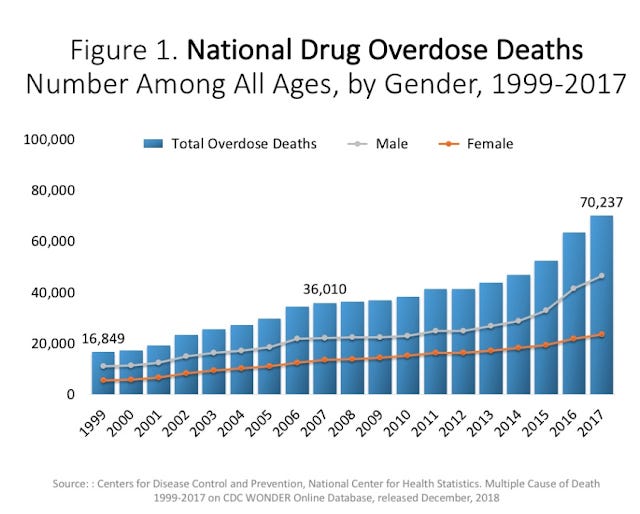
We also want to highlight the fact that law abiding citizen gun confiscation by the Democrats is purely nonsensical and more to do with power then safety. This narrative that guns are the issue is well, unfounded and irrational. We know the narrative is being spun for safety, but in all due respect, many other things kill, much more efficiently by the way, then “legal” guns do. In fact, we have a chart of a 7X killer, this one kills over 7 times the amount of people then any homicidal gun toting manic. What is it? Drug overdoses:
So, let’s just be honest with one another ok, use facts not narratives!
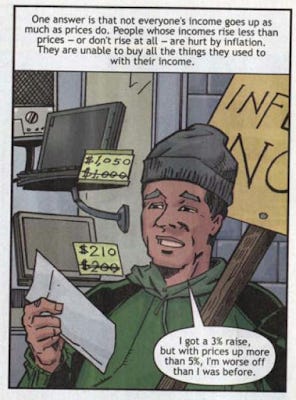
Finally, we saw this cartoon on twitter and we had to post it, we have no idea where it came from but we think it points out a very simple and sensible way for anyone to understand our current central bank policy administration of control, enjoy and till next time:
DISCLAIMER: For Educational purposes only. This is not a solicitation to buy or sell commodity futures or options on neither commodity futures nor an endorsement for the purchase and sale of an ICO, Cryptocurrency or any digital asset and should not be construed as such. The risk of trading securities, futures and options can be substantial and is not for everyone. Such investments may not be appropriate for the recipient. The valuation of futures and options may fluctuate, and, as a result, clients may lose more than their original investment. Nothing contained in this message may be construed as an express or an implied promise, guarantee or implication by, of, or from the author Mike Agne owner of Magnelibra Capital Advisors LLC (MCA) and the website blog, which can be found at www.econemotions.com. All rights are reserved. We will never claim that you will profit or that losses can or will be limited in any manner whatsoever. Past performance is not necessarily indicative of future results. Although care has been taken to assure the accuracy, completeness and reliability of the information contained herein, (MCA) makes no warranty, express or implied, or assumes any legal liability or responsibility for the accuracy, completeness, reliability or usefulness of any information, product, service or process disclosed.