
Debt is Money, The Federal Reserve True Inflation Rate
Charts To Watch Today

Sorry guys had to resend as a total free access!
We sent out the subscriber only update last night to keep those playing along up to speed on our trading game plan. If you don’t subscribe, well you should, our goal is simple, to get you to focus on the alternative part of your overall portfolio and to enhance your other sectors of investing as well.
What we try to do with this blog is give our members the culmination of 25 years experience trading financial derivatives and what we have learned. With the emergence of Ai intelligence systems, pervasively used as the backbone infrastructure as well as the dynamically active component to many large scale Hedge Funds and systematic based trading and investing institutions, traditional investing is no longer viable. These systems operate in a binary world, Buy or Sell, Add, Subtract, old school metrics need not apply.
We hear it all the time, “I buy index funds, that’s what my dad did, it worked for him it will work for me.” Well if you aren’t actively following and investing yourself and you want to pay the money manager to do it for you, by all means nobody will turn away the free basis points your paying them.
The reality is however, we have access to vast amounts of information, to data and honestly with a little time and effort, you can pretty much successfully learn and do anything, that includes managing capital. So we created this blog as a guide, a tool for those of you that want to not only gain a better understanding of markets, but to also improve your odds of investing success.
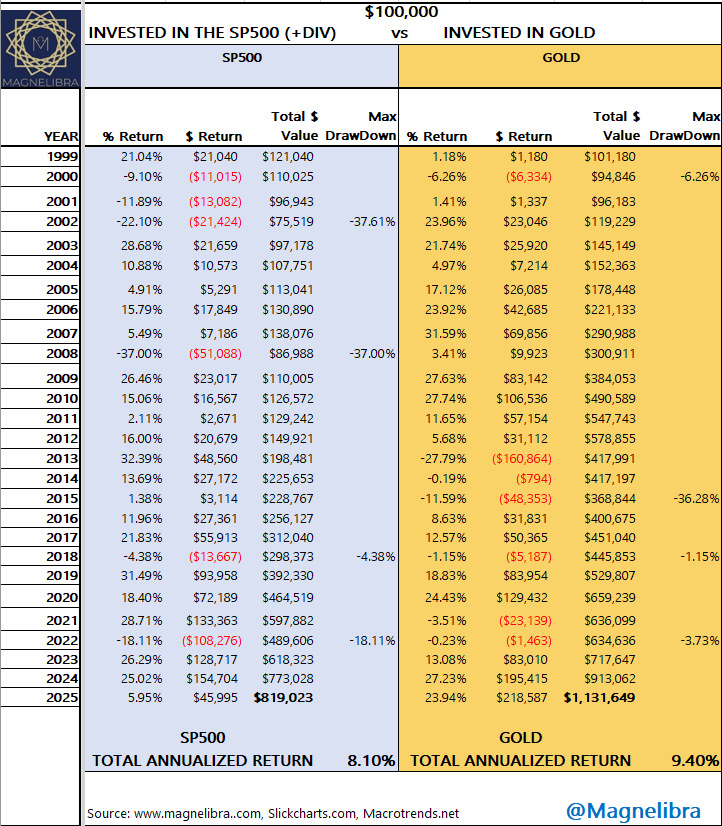
Yes, you can simply go long and buy index funds, no doubt and considering the Federal Reserve has increased its asset base at 9.8% annualized, well if they keep doing that, you should be able to improve near that inflation rate. Over the last 28 years on an annualized basis, Gold is +9.4%, the SP500 8.1%, but both still underperform the asset accumulation rate of the FOMC at 9.8%!
But Magnelibra, why does the Federal Reserve (FOMC) Asset base increase matter?
Well think of it this way, can you borrow more if your capital base is say $10,000 vs $1,000? Of course you can, now imagine you are a “Zero Sum” playing central bank, allowed to print money (digitally) and buy real world assets like U.S. TBills, notes and bonds. The FOMC has a WACC or weighted average cost of capital, that is essentially zero, meaning its cost basis is zero and everything else is pure profit.
Now let’s take this a step further, imagine claiming your inflation mandate is 2%, yet in reality you buy assets at a near 10% clip. Somehow their mandate isn’t matching their reality now is it?
Where do you think nominal asset prices would be today if the FOMC stuck to their 2% mandate over the last 28 years? Considering their balance sheet is now $6.7Tn and at the start of 1999 it was $669Bn!
Using simple math, if the FOMC stuck to their 2% growth target, then their balance sheet today would be $1.142Tn today or an increase of 1.7x, instead the actually difference using today’s balance sheet actual value is a staggering 5.9x.
The SP500 at the start of 1999 was around 1200, today it is 6380 or 5.3x (that’s not coincidence)
The median sales price of a home in 1999 was around $133k today it is $423k or 3.2x
Gold at the start of 1999 was around $280, today it is $3350 or 11.9x - shows you how undervalued it was!
Even worse the US debt level in 1999 was around $5.7Tn today it is $36.7Tn an increase of 6.4x outpacing the actual FOMC factor! Imagine if the FOMC didn’t print at a 5.9x rate and instead stuck with even a modest 2x rate, maybe U.S. total debt today would only be $11.4Tn!
Here is another way to look at this, how much of an increase in GDP does $1 of new debt buy? Prior to the 2000s this ratio was on average $1.70 in GDP growth per $1 of new debt. (The 1999/2000 period was a budget surplus time and didn’t require new additional debt to generate GDP)
Fast forward to today, where $1 of new debt doesn’t even generate a $1 in GDP growth, in fact its about $0.90.
U.S. debt growth no longer can contribute to an increase in actual GDP. U.S. debt is becoming less sustainable, as each dollar of new debt generates less than a dollar of GDP growth, leading to a rising debt to GDP ratio and higher interest burdens. This trend suggests long-term risks, including reduced fiscal flexibility and potential crowding out of private investment.
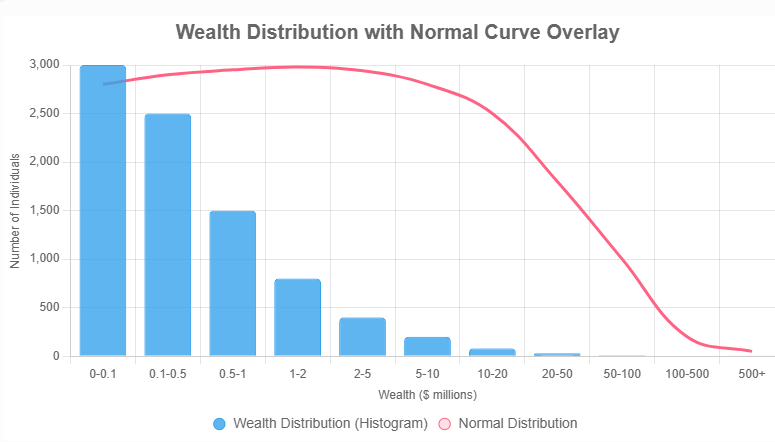
Ok to sum it all up, its obvious the United States and the Federal Reserve have embarked on money printing to sustain exponentially increasing asset price levels. Yes asset prices are rising, yes overall debt is rising, however this kind of asset inflation does not translate into a smooth distribution of wealth, rather it leads to a very fat tail! We need to increase the middle (the gap between that red line and the $0.5m to $10m crowd and if we don’t well, expect further calls for Socialism to try and make up the difference, because this for all intents and purposes is Serfdom!
Ok that is enough economics and monetary mechanisms for today. Let’s now turn to the charts we are watching closely as the week is over today and this will give us some crucial closing data.
As our subscribers know, the daily closes and weekly closes in particular are important to our Magnelibra Futures Market Trend Sentiment trading tracker. (Subscribers Only)
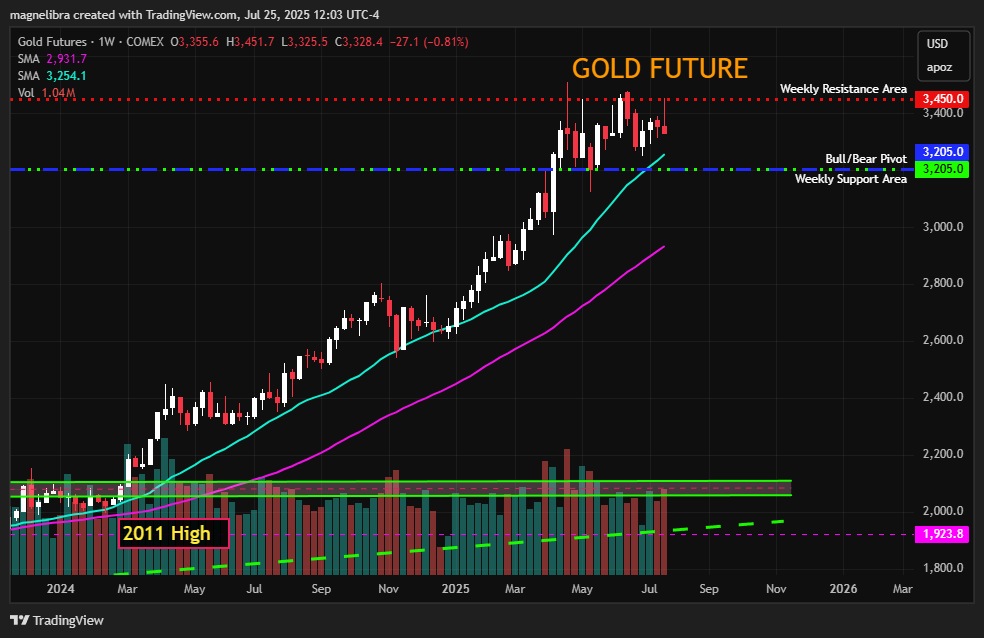
Here are some of the charts that we know are close to flipping some of our current trends. First up Gold and the rejection from our weekly resistance confirms last weeks move now and this will most likely flip to a neutral status today:
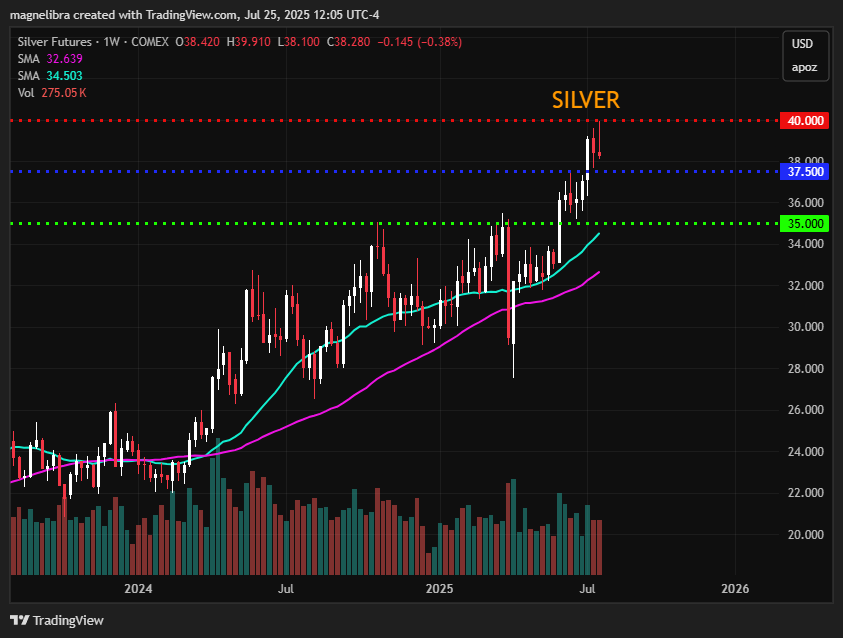
Same deal in Silver:
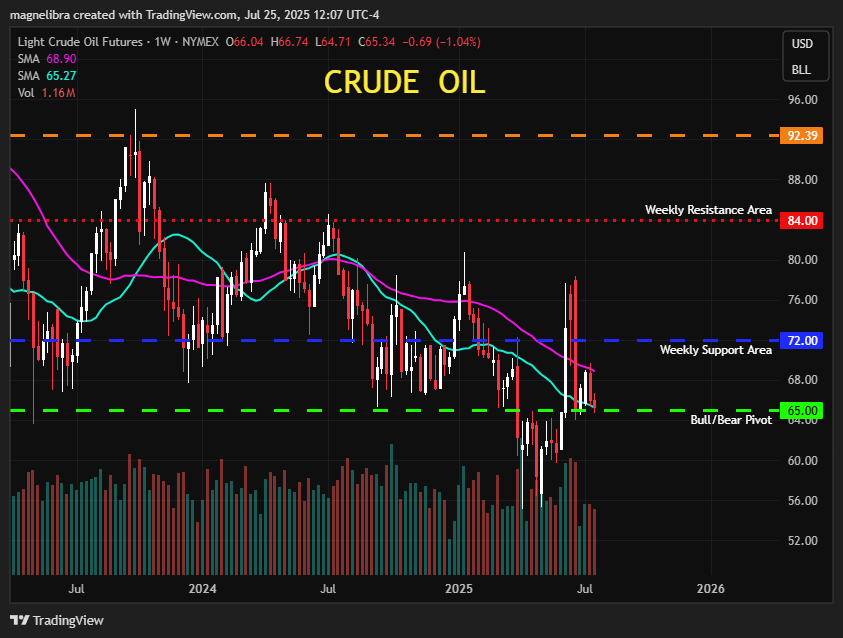
Crude Oil is another chart, $65 is key on the weekly here:
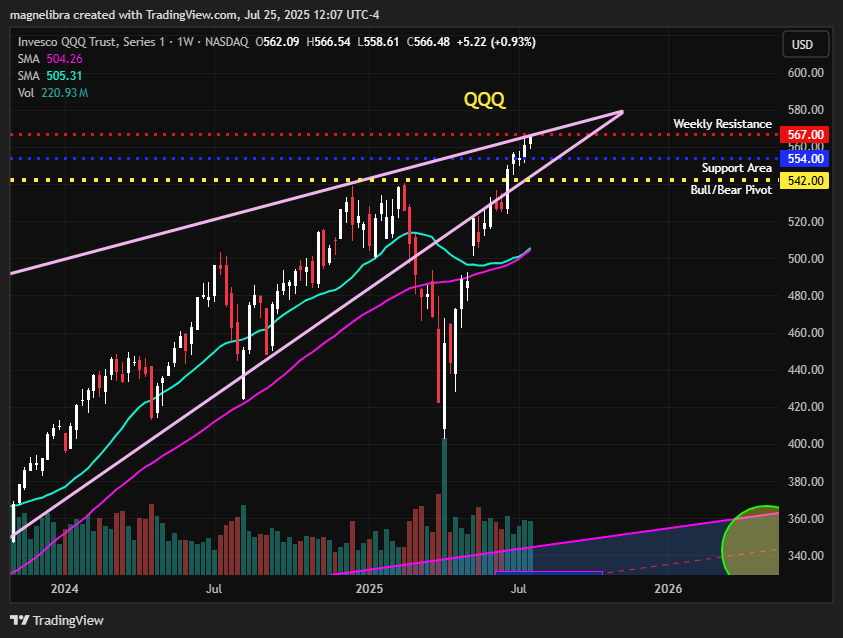
The QQQ ETF is also on our radar here at 567, seems very important and failure to close above here this week may indicate a waning bid:
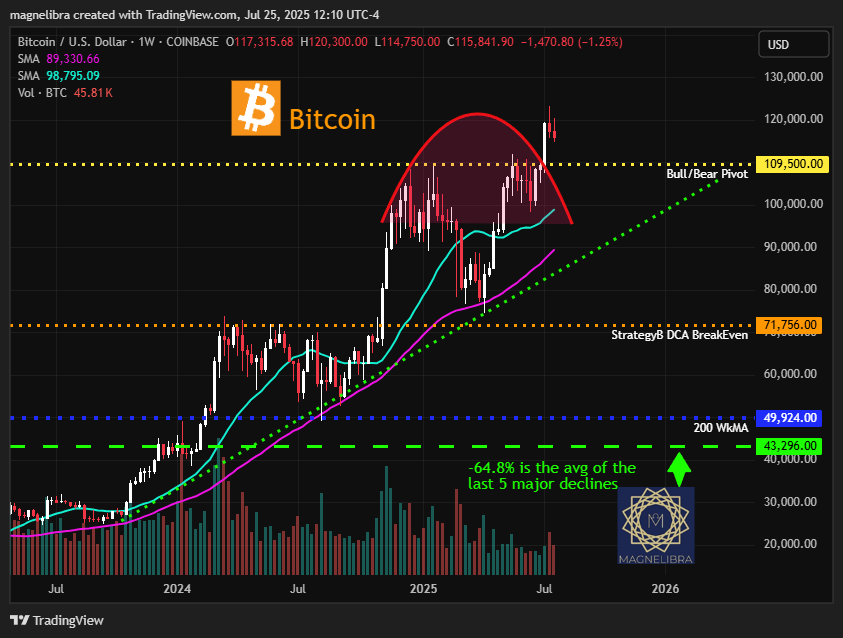
Our last chart is Bitcoin, where price action is dominated not by MSTR new potential bids, but rather one of the original OG BTC whales dumping some 80k BTC. This wallet that had its first entry back in April 2011 at $0.78 cents is monetizing its value now worth $10bn the holder(s). No matter, we care not about what causes the price action, but rather we care about what the price action looks like in the overall scheme of things. Well, if BTC closes here, consecutive back to back weekly down candles smells of real sustainable selling and $109,500 becomes our first real key test on the downside. If BTC trades below there, well let’s just see when the time comes, but we wouldn’t want to be long, that is certain:
Ok guys that is it for today, please try to share our work, try to subscribe, if you see value and want to support us please see our BTC address below to use and our just outright subscribe.
Support directly to our BTC address if you can: 3DvDvPnjwu5Fd6sagAYmiFXA2fPkjJf2cp
Anyone interested in investing in Monero (XMR) please reach out, we have a link to Kraken below if you use my referral code or link to try it, we’ll both earn 75 USD when you trade 200 USD of crypto in the app!
Code: y4wsyws7
Link: https://proinvite.kraken.com/9f1e/11l9bp1z
Additionally we would be glad to consult anyone interested in getting involved here. As always we view these crypto currencies in the same realm as futures, high risk, high reward, and every portfolio should have a small percentage of their overall portfolio in investments like this.
So if interested please reach out to the email below directly and we can discuss this further. The future of financial payment systems will be digital decentralized and we are still in the infancy of this fascinating technology!
If anyone is interested in working on a digital currency project and joining in as a core investor to help lay the foundation for what is to come, please reach out!
Cheers,
Magnelibra