


Thanks everyone for joining us for this week’s Econemotion brought to you by Mike Agne of Magnelibra Capital Advisors. You can find our blog page at www.econemotions.com where we write our weekly thoughts in hopes that we can provide you with unique insights upon markets, trading and risk. You can also find this report in video format on Youtube at the econemotions channel, so feel free to view it on YouTube, Econemotion Update 6 3 19
I am the manager of Magnelibra Capital Advisors which is an NFA registered CTA, that manages individual accounts and executes the Blue Dragon Discretionary Program, a long/short relative value futures and options trading program. Feel free to visit our website at www.magnelibra.comand follow me on Linkedin as well.
“Our mission is to be a significant portion of your portfolio’s alternative asset allocation”
Ok let’s dig into a few things that are piquing our interest this week. We feel that investors need to be fully aware and cognizant of the investment landscape that is currently controlled by the global central banks and the recent bout of economic volatility should be here to stay as the Federal Reserve shifts its tightening campaign and reverses its course rather quickly here over the coming months. Speaking of the Federal Reserve they are meeting this week in Chicago to review current monetary policy. As this Bloombergarticle points out, the Fed and group of academics get together to discuss new research and complex topics. Well one thing will be certain, whatever they come up with will be well behind the curve and as the past has consistently proven, the FED and their 700 PhDs are chalk full of terrible prognostication capabilities.
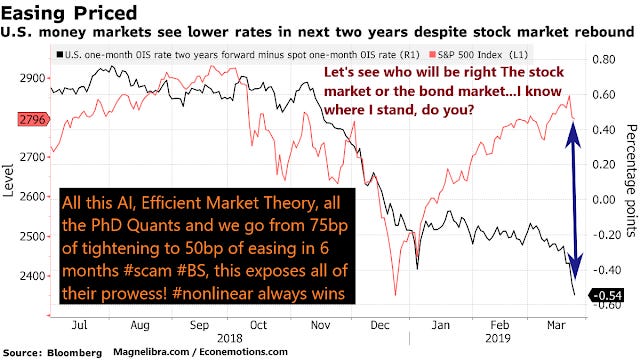
In fact we have this chart here just to show you how severe the 360 degree change has been over the last few months as all the quants that were predicting Fed continued tightening which was expecting nearly 80 basis points of tightening at the end of last year, to now calling for 50 basis points of easing. With this newly found trajectory this chart points out the over-exuberance of the SP500 market in comparison to the new expected path of lower rates. Who said markets are efficient, BS we know better? Basically, the question becomes, do you believe the bond markets or the equity markets right now??? We know where we stand!
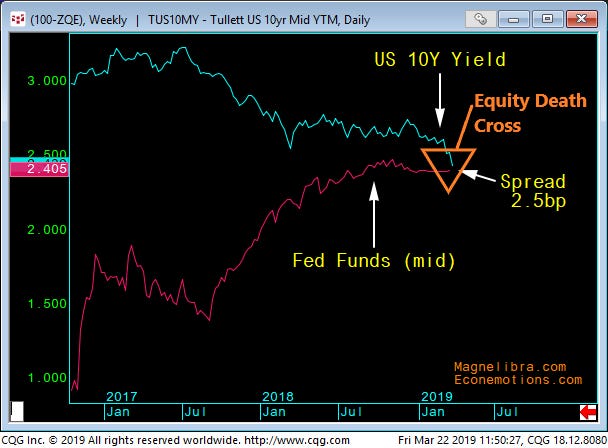
You know we informed our readers and listeners of our key yield curve metric and we have the chart here, the chart is the US 10yr note vs the Fed Funds rate and you can clearly see that once Fed Funds started to trade near parity with the 10yr rate, this set everything in motion. Which we have the chart right here with our triangle highlighting the “equity death cross”. This is a decade move in the making and not something to be trifled with.
As our readers and viewers know, this is a very important indicator and In fact when you look at the updated version of this chart on Bloomberg, you can see now that the US 10yr yield is now inverted, meaning its trading 37 basis points BELOW the Fed Funds and the last time this happened, well you guessed it, early 2008!
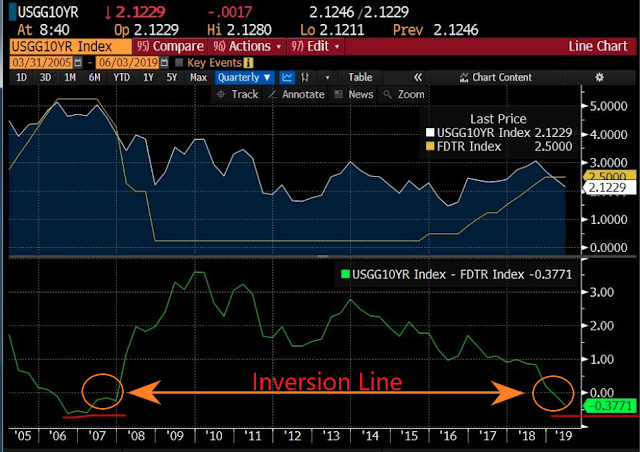
Look this isn’t doom and gloom this is merely telling you the set up and how it transpires has a very high potential of forcing massive asset price discounting as it did in the past, so take this all for what it is and merely information for you to digest.
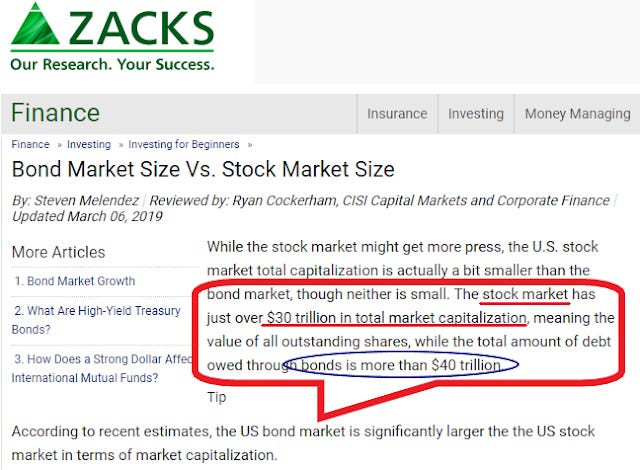
For those that don’t know, the bond market is so important because it is the key to our over financed and leveraged debt-based system. As this Zacks.com graphic shows, the US bond market is $10 trillion larger than the total market cap of the US stock market. As you can see the US stock market capitalization is $30 Trillion and the US bond market is $40 Trillion. Therefore, we tend to focus our attention to the bonds when market sentiment starts to change.
Another chart to solidify our overall equity market view and why we have seen recent uncertainty, look at the size of the inflow into the money market funds last month in May, a whopping $100bn over the last 5 weeks!
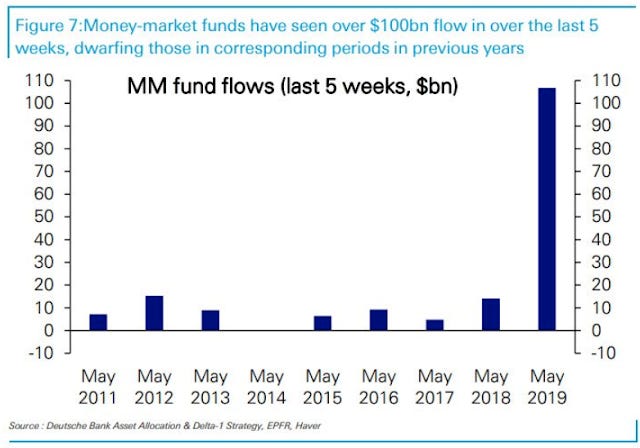
Talk about sell in May and go away…look at how it compares to all the prior years!
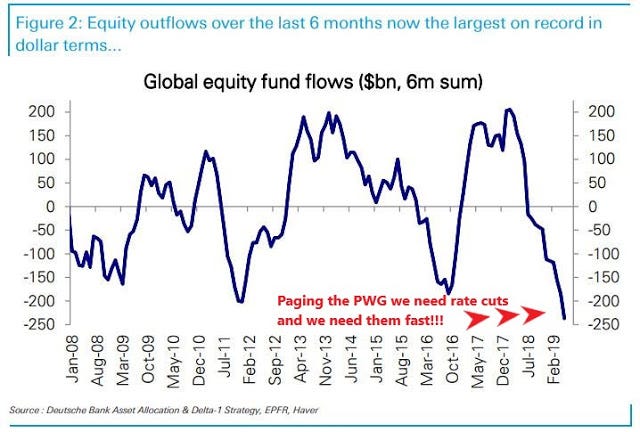
If that isn’t enough evidence, perhaps this chart of record global equity fund flows is enough to convince you of the severity of the real selling, paging the president working group we need some help! Anyway, we know they have been mopping up this selling with corporate buybacks but it’s not having the same BTFD effect now is it.
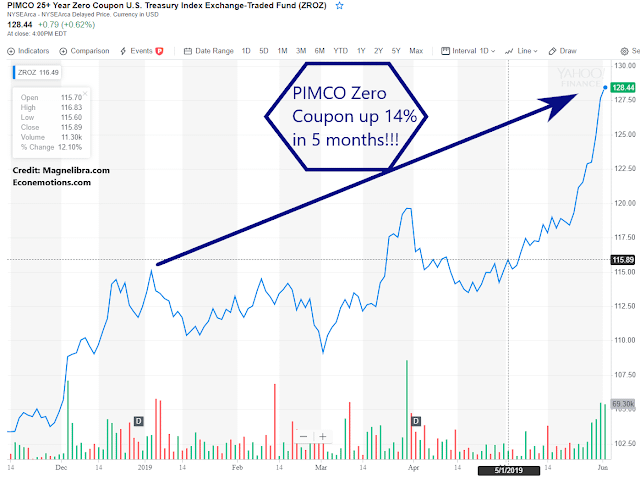
We can also see that Pimco’s zero coupon bond ETF has also been a big beneficiary this year up a whopping 14 % in 5-months…this is a bond fund folks!
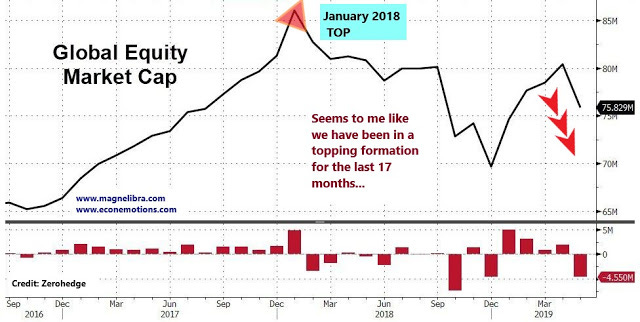
So, we hope the picture is becoming increasingly clear and that the equity markets have been telling us that the future is indeed uncertain. We also want to point out the fact that equity markets have been putting in a topping formation for quite some time. This chart puts the top almost a year and a half ago that’s how long this formation has been going on thus far.
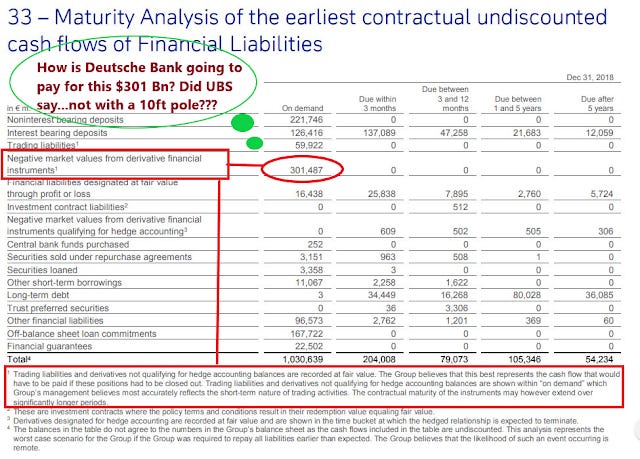
Before we get into some of the technical charts Magnelibra decided to dig into some potential black swan events that nobody is really talking about. We decided to dig into Deutsche Bank’s annual report and here is what we have found. We found a whopping $301bn “on the hook” for that nobody seems to be talking about! Here is our graphic and perhaps the reason why UBS balked at a possible merger. We suppose the -$-250bn ECB TARGET2 balance is about to get just a bit larger!
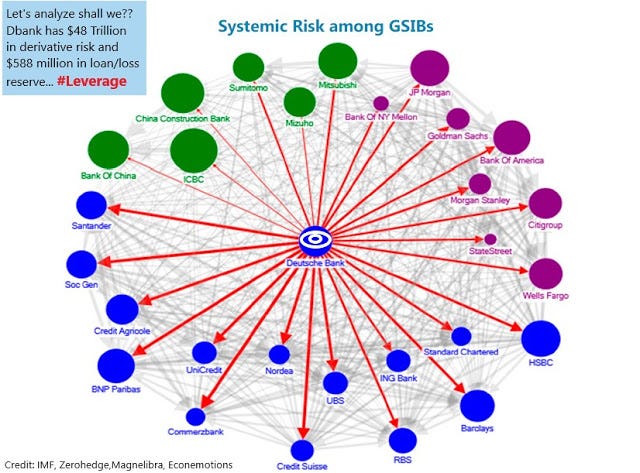
To take it just a bit further we dig in the archives and found this little juicy graphic, nothing like having $48 trillion in derivatives and only $588 million in loan loss reserves, can you say Way Too Big to Fail!
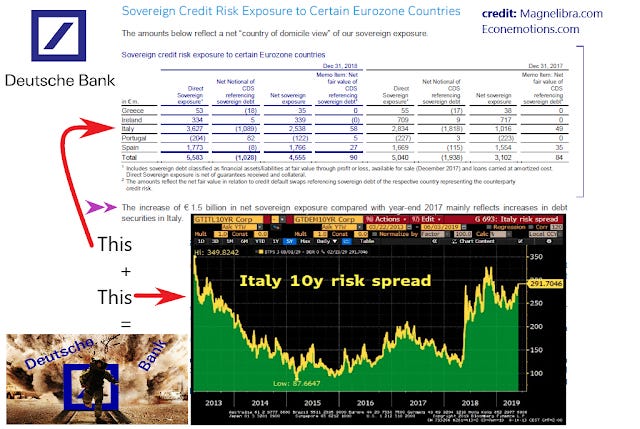
Not to truly pick on DB, but we felt our infographic here was appropriate, while digging into their annual report we also found this little nugget, an increase in exposure to Italy by $1.7 billion. With Italian/German spreads blowing out again, this might just start to become problematic and with their stock sub $6, well anything and everything is on the table of possibility right now.
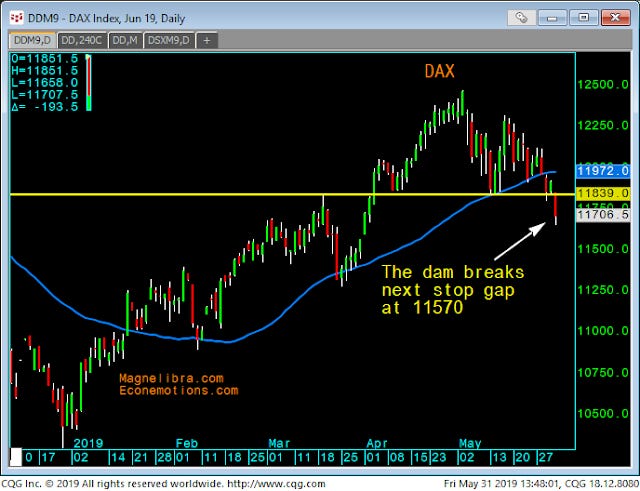
Ok let’s get to the technical charts, and sticking with Germany let’s look at the DAX index. The 11839 level has broken and now we look for a gap close at 11570 where we may see some technical buyers show up. As most of our readers know we do follow this index closely for an overall US led picture.
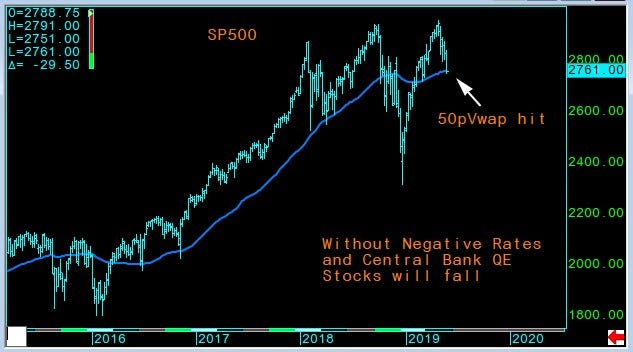
When we look at the SP500 we can see the 50pVwap at 2761, this becomes our continuation magnet and we would expect some chop around here, even if the market continues to falter, we can always count on a bit of pain trade against the trend.
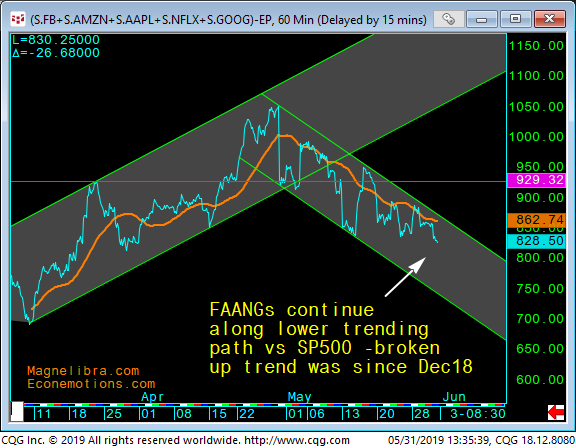
The 2019 equity up move has been led by the tech giants, but we noted a reversal of course in late April and perhaps the start of an underperformance out of the group vs the broader SP500 market. Once again, the 50pVwap and backed up by the descending trend channel seems to point to a continued disappointment out of the tech sector. We can add to the fact that the US government is going to look very deep into antitrust measures and we expect this rhetoric to increasingly weigh in on the sector moving forward.
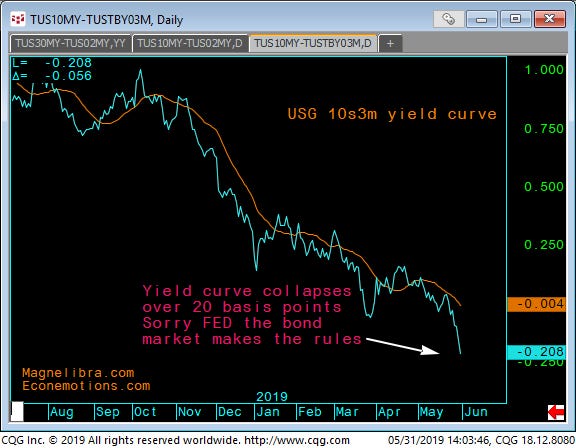
Moving to the fixed income markets we can see the continued inversion and flattening of the US yield curve, here this chart shows the collapse of the US 10s3month spread, now hitting nearly -21 basis points down from 100 basis points late last year. This negative spread is a disaster for leveraged finance and thus, the reason why we continue to see asset prices discount future values.
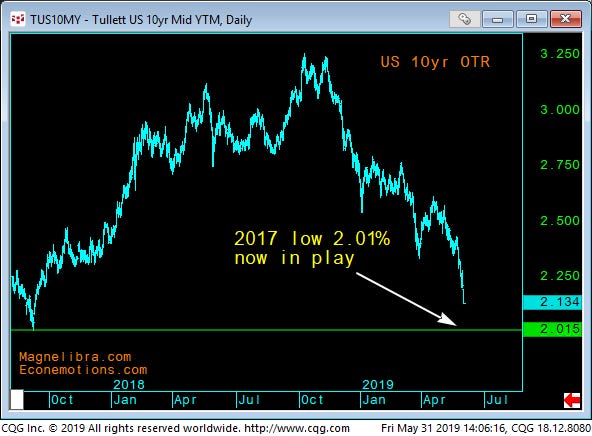
This next chart truly captures the collapse in US government yields as the US 10yr note now trades 2.13% down a massive 111 basis points in a little over 7 months. This is a massive move and one that caught all the believers off guard, not us however, we know the truth, we know in debt fiat based QE4EVR world the only way forward is zero rates, because it’s all the central banks know.
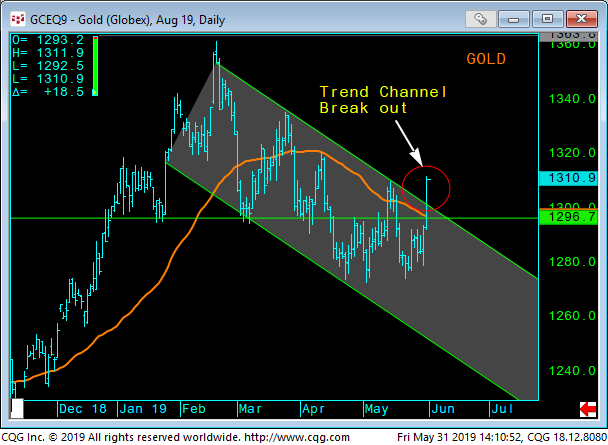
So, with the FED ready to embark on QE4EVR how has the gold market responded? Well it is breaking out above that 1288 level we were so cognizant upon and we suspect this move has a long way to run!
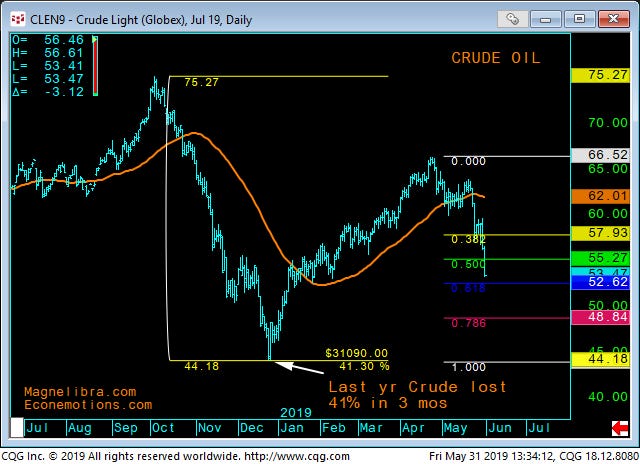
Finally let’s look at Crude Oil, which has been beaten up lately, perhaps discounting a global slowdown. This too doesn’t bode well for equity markets as energy is the main driver of global output in our book and thus if this continues to falter, then we feel equity prices will continue down as well. One thing this chart points out is that off its highs late last year it lost 41%, so be mindful of the severity of that move as this move is shaping up just like that one. A similar move puts oil down at $41 but major fib support sits at $49.
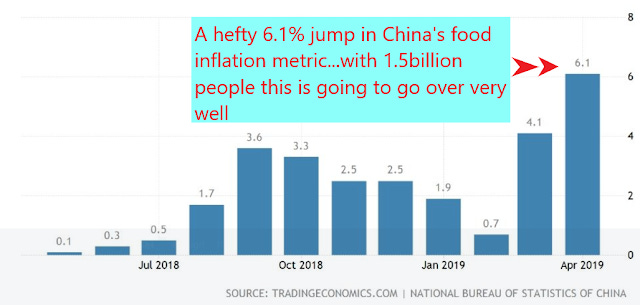
Ok that is it for the technical picture, the next few infographics deal with China, this first one, puts on display the large jump in food inflation which hit 6.1% and given the amount of people there, this isn’t going to go over very well.
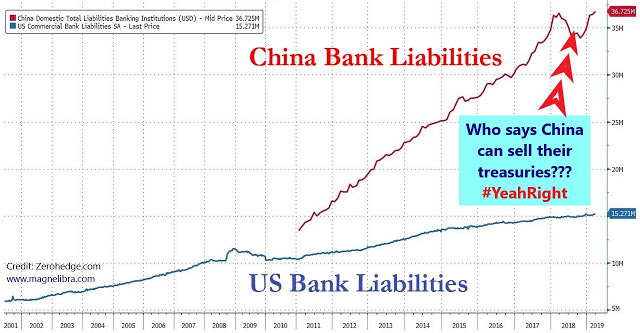
The next infographic we did was this one pointing out the falsehood that China can sell their US treasury bond holdings. A false threat we hear all the time, we hope this picture puts that theory to rest, as you can see the PBOC has been in overdrive printing Yuan to save the domestic financial infrastructure and with all that risk out there, the last thing one would do is sell the only security that matters, i.e. US treasury bonds!

Ok folks, thank you for joining Magnelibra on this week’s Econemotion, but before we go, we thought we would point out this article from Zerohedge, now we are big Ray Bradbury Martian Chronicle fans and we are constant sky observers and electrical universe fans and when we see articles like this, we have to be very, very skeptical as to what agenda is truly trying to be pushed. What narrative is being spun, what are the powers that be trying to set us up for…anyway we have heard increasingly government led chatter about UFOs and UFO phenomena and it all just seems a bit forced. Anyway give it a read and see what you think, as always, open your minds, expand your horizons and we hope you enjoyed this week’s Econemotion, I am Mike Agne of Magnelibra Capital Advisors, feel free to reach out to us anytime and as our tag line says, “we don’t want to be a large portion of your portfolio, but rather a significant part of your alternative allocation” Cheers!
DISCLAIMER: For Educational purposes only. This is not a solicitation to buy or sell commodity futures or options on neither commodity futures nor an endorsement for the purchase and sale of an ICO, Cryptocurrency or any digital asset and should not be construed as such. The risk of trading securities, futures and options can be substantial and is not for everyone. Such investments may not be appropriate for the recipient. The valuation of futures and options may fluctuate, and, as a result, clients may lose more than their original investment. Nothing contained in this message may be construed as an express or an implied promise, guarantee or implication by, of, or from the author Mike Agne owner of Magnelibra Capital Advisors LLC (MCA) and the website blog, which can be found at www.econemotions.com. All rights are reserved. We will never claim that you will profit or that losses can or will be limited in any manner whatsoever. Past performance is not necessarily indicative of future results. Although care has been taken to assure the accuracy, completeness and reliability of the information contained herein, (MCA) makes no warranty, express or implied, or assumes any legal liability or responsibility for the accuracy, completeness, reliability or usefulness of any information, product, service or process disclosed.