Digital Currency Index Report · 2026-08-04
Founders-tier proprietary digital asset index

The Founders Circle gives you access to our proprietary Digital Currency Index: a hand-selected basket of the ten digital assets we believe will define the next decade of decentralized finance. In a space where narratives rotate weekly and custody assumptions fail without warning, the Index provides a disciplined framework. You track the NAV. We do the work.

The Alpha Held
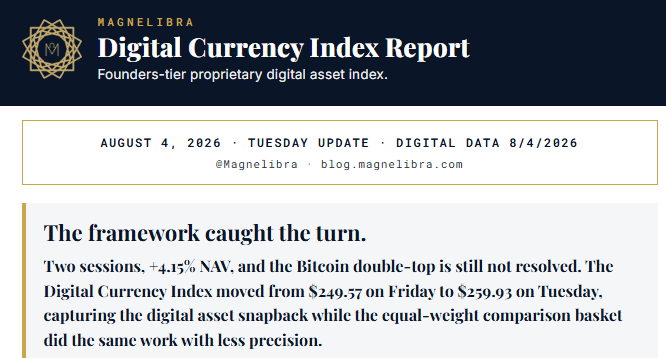
The Digital Currency Index closed Tuesday at $259.93, up +$2.04 on the session (+0.79%) after Monday’s +$8.32 (+3.33%). Two-day cumulative NAV gain: +$10.36, or +4.15% off the Friday close of $249.57. The equal weight Top 10 comparison basket closed at $177.31, up from $170.75 on Friday, a two-day gain of +$6.56 or +3.84%. Both books captured the digital asset rally. The Index captured it better by roughly 31 basis points across the two sessions.
The wider read is the year to date spread. On Friday’s close the Index sat at -0.17% since inception (-18.41% YTD 2026), and the equal weight basket sat at -31.70% since inception (-26.15% YTD 2026). On Tuesday’s close the Index is at +3.97% since inception (-15.02% YTD) and the equal weight basket at -29.08% since inception (-23.31% YTD). YTD outperformance versus equal weight widened from roughly 7.7 pp to roughly 8.3 pp in two sessions. The framework is designed to hold its ground through drawdowns and pick up beta when the market turns. This week is a live example.
The Structure Bitcoin Has to Resolve
Bitcoin closed Tuesday at $64,265.79, up +1.21% on the day, and the technical structure that decides the next leg is now sitting inside a smaller dome pattern on top of the $57,500 weekly support. The primary double top from November 2025 through July 2026 is intact. The current price action is inside the smaller right side dome that has formed since June, and that structure is the near term question. A weekly close above $69,500 breaks the right dome and opens the $75,419 StrategyB DCA breakeven as the next test. A weekly close below $57,500 completes the right dome and puts the 78.6% Fibonacci retracement at $39,486 on the table as the terminal downside objective.
The historical reference matters here. The average of Bitcoin’s last five major declines is -64.8%. Measured from the November 2025 peak near $130,000, a -64.8% decline lands at roughly $45,760, comfortably between $57,500 support and the $39,486 Fibonacci retrace. The chart is not telling us the current drawdown is done. It is telling us the structure has to resolve, and the levels that decide it are already drawn. The bull bear pivot at $87,500 remains the level to reclaim before the primary uptrend re-engages.