

When we look at our technical charts of the various equity markets, we can see that most of them finished the week near or above the weekly pivot lines. This is a good indication of a nice extension and renewed buying interest. Now we need to see if the move has staying power, in order to accomplish this, the markets will need to sustain the various pivot levels. Any trade back below them, will run the risk of tempting new selling, which will start to eat away at the current constructive bull narrative, but for now, let’s just take a look at a few of these levels.
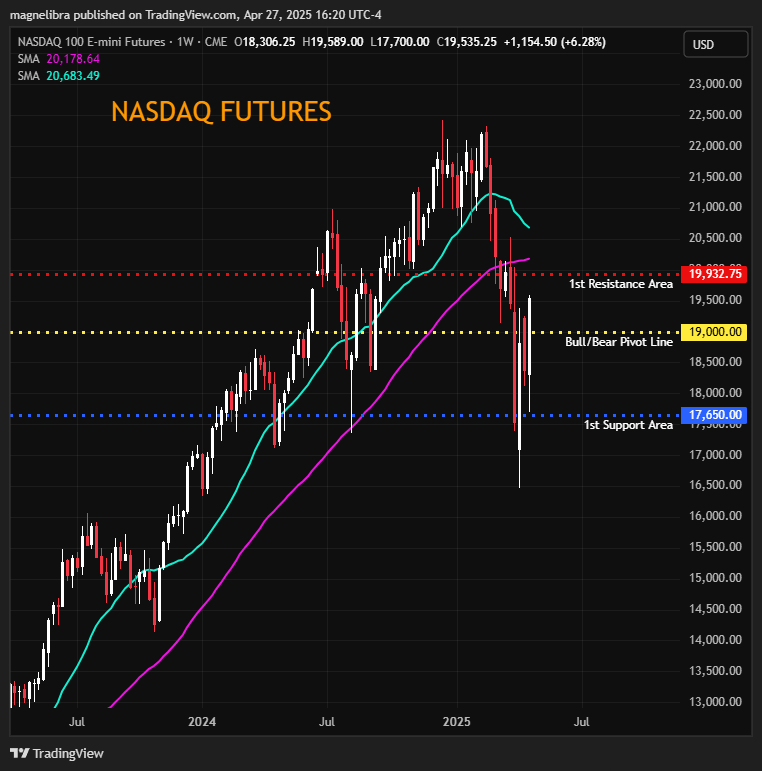
The Nasdaq futures above 19200 area will target 19935/50 area now with support 19k:
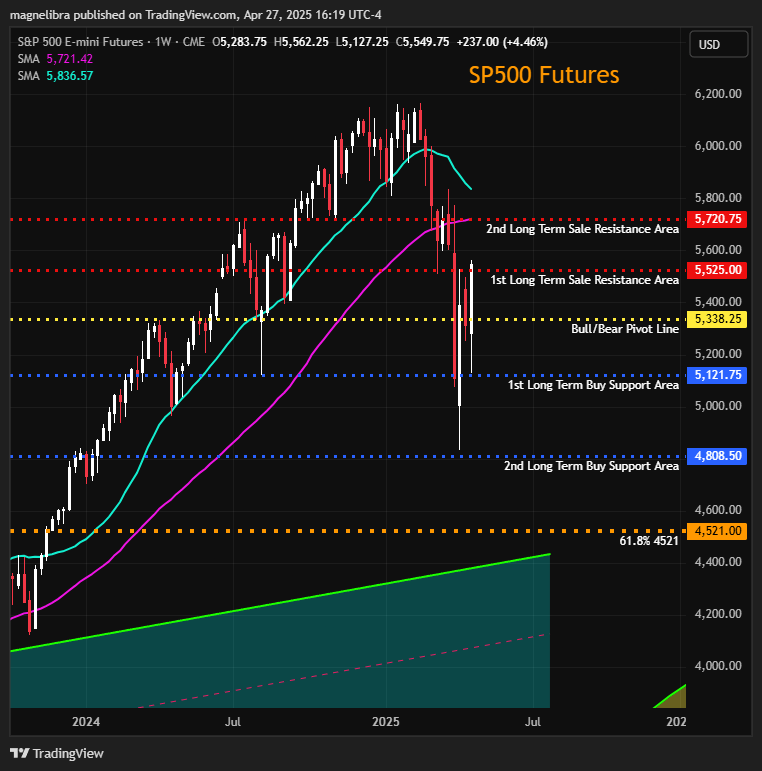
The SP500 futures are bullish above 5340 and 5525 areas, 5340 is now good support on the weekly with 5525 expected to see initial support on the dailies with 5660 the upside target now for the daily move and 5725 for the weekly move:
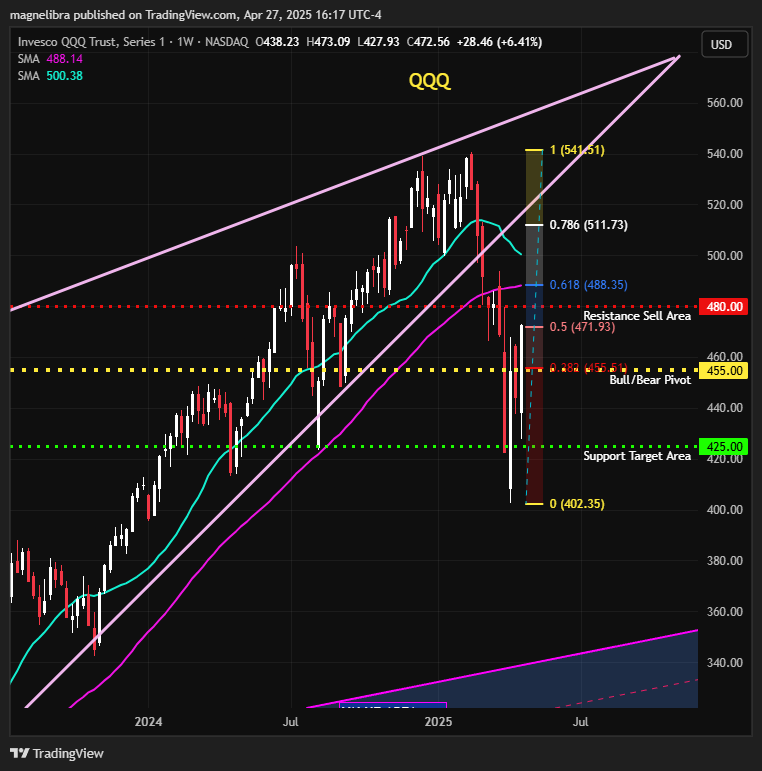
As far as the QQQ ETF, expect resistance to be heavy between 472/480 with multiple technical levels above there, but buyers in solid control above 455 for now:
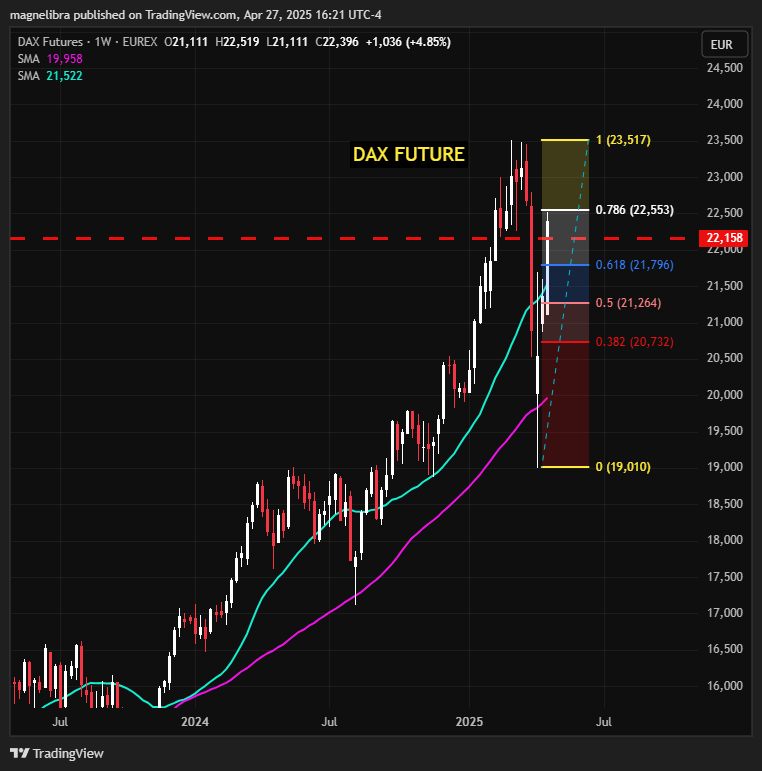
One equity chart that could give the sellers some reason to pressure early on in the week is the Dax Futures chart and the Fib technical target/resistance level at 22553. We expect to see sellers there on another up move:
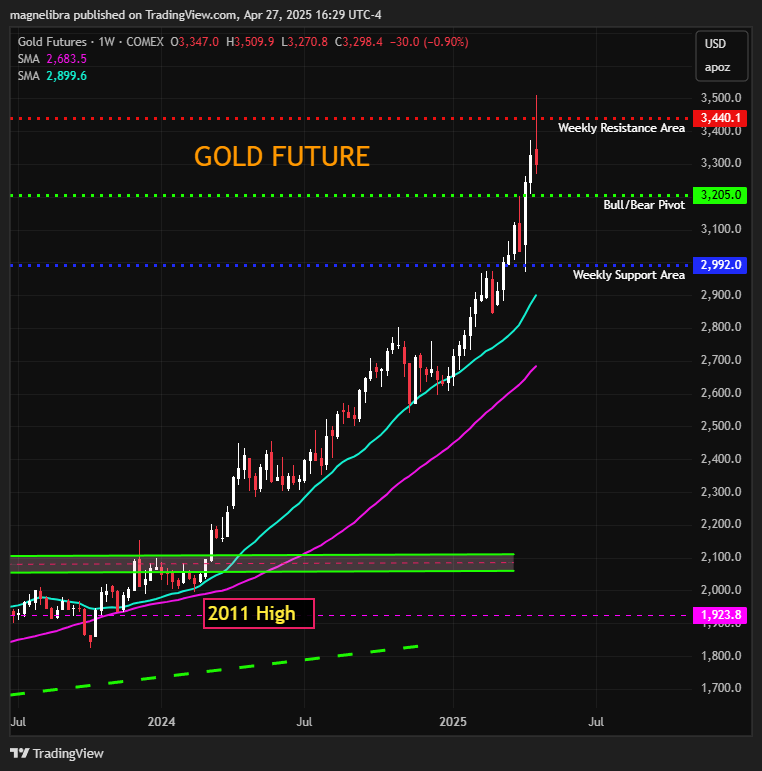
Alright let’s take a look at a few other markets, first up Gold, well a massive downward weekly, lets see if the sellers take early advantage of this or now, for now $3440 is this weeks resistance and a move below $3205 puts the bears in control on the daily:
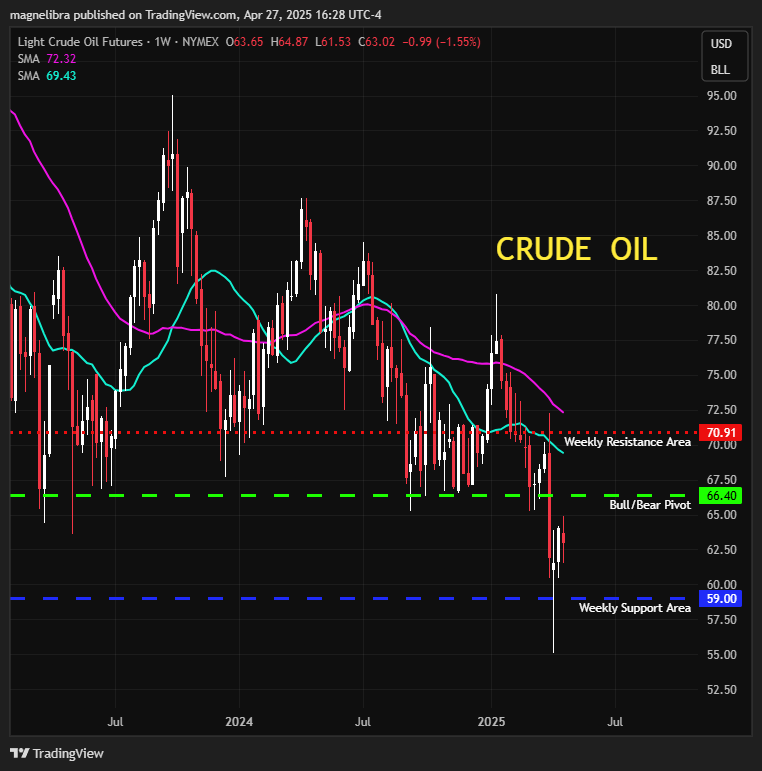
Crude Oil will have first resistance around $66.40/50 area and most likely a decent sale location initially, but above there you do not want to be short generally. Supports well below $59:
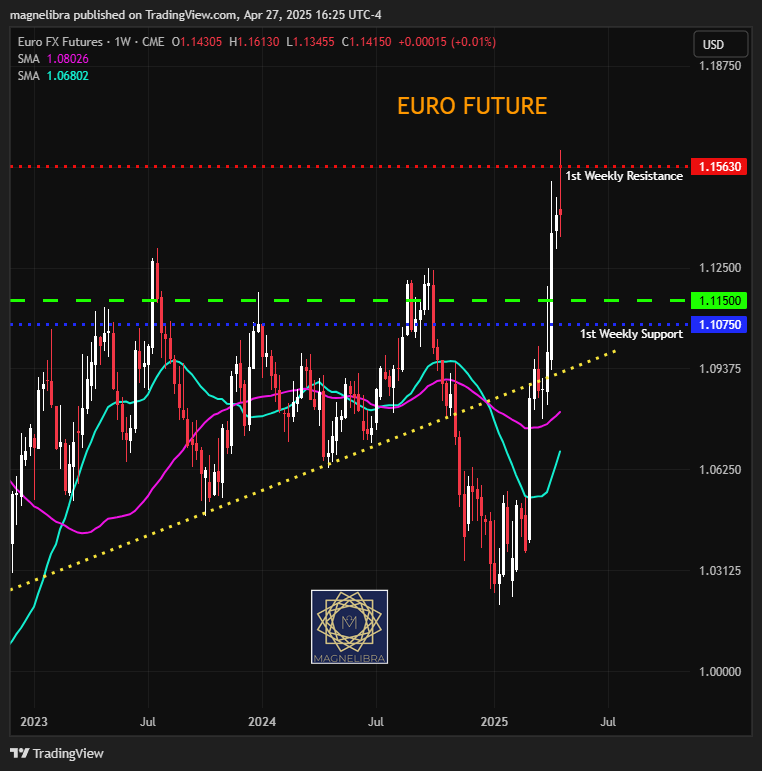
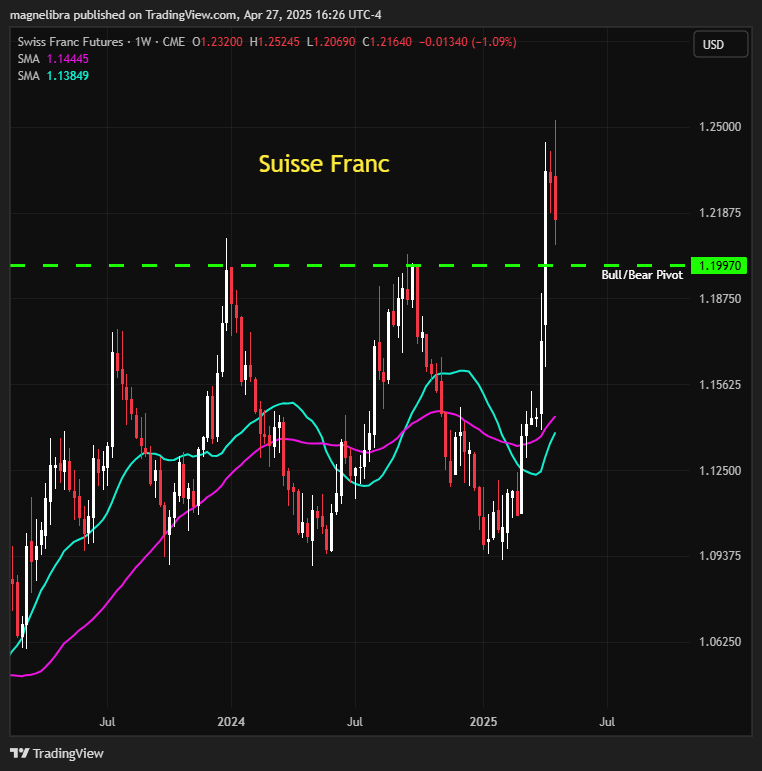
As far as the FX markets the Euro looks much like the Gold chart technically and a move above 115.63 will be the bulls goal this week, for now technically seems like a consolidative move and the chart below for the Suisse, $120 is an obvious pivot this week:
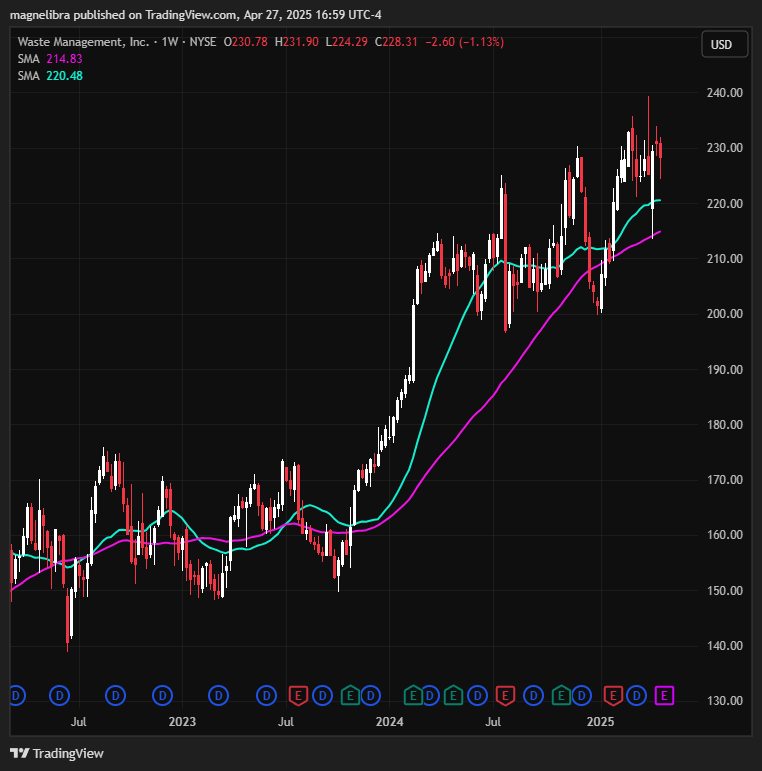
Ok that’s it for the technical look, moving on to other items, early on this week we have Domino's Pizza pre Monday open, we like Dominos and so too does the great Warren Buffett! There is Waste Management after the close on Monday and SoFi pre Tuesday morning. We like the puts on Waste Management a bit better due to the recent bounce, but this stock rarely goes down for long, but for a quick flip and risk reward profile you can get the May 16 Expiration $220/210 put spread for about $1.20 so you have a decent 7.3x payoff not bad for a flyer.
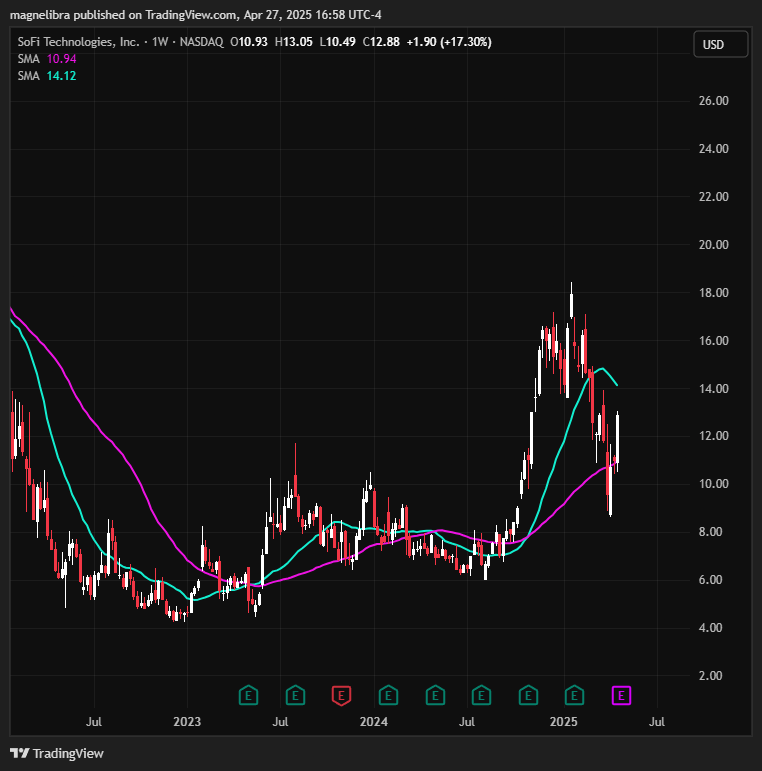
As far as SoFi, the $13.50/$15.00 call spread seems juicy and is trading around $0.38 for a nice 2.94x payoff. We expect SoFi benefitting from the higher interest rates and margin increase and thus could surprise on the upside:
Alight we have all the MTR Subscriber data and trackers up next, we urge you to become a full subscriber and truly break through that barrier of understanding in regards to our global financial system.
We offer you a mindset that you cannot get anywhere else
We offer you data across a multitude of market segments and structured in a unique way for you to easily understand market movements and the values of those movements.
We offer a more in depth vantage point, to incorporate our work into your own investing and trading processes.
You won’t be disappointed! Sign on today and feel the power of being the smartest person in the room, when others pretend they know, YOU WILL KNOW!
We won’t hide this data today behind the paywall, but the daily data that you see from this point forward is what our subscribers will have access to daily, so please think about supporting our work and gaining a better understanding of market data and how the market movements take shape and evolve.
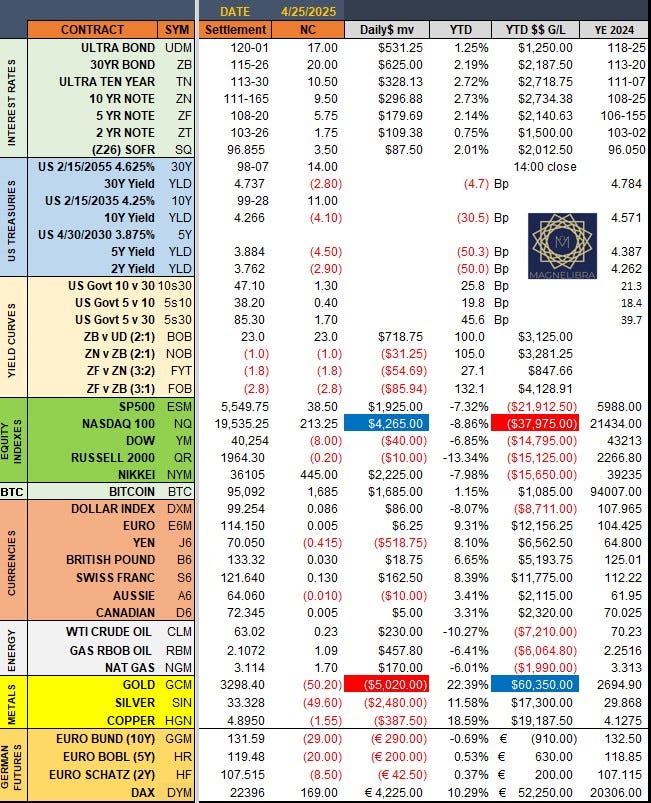
Daily Settlement Sheet- As far as the settles go the bond markets settled the week on a positive now led by the belly of the US Treasury curve, equities were mixed, FX was mixed, energies were higher and metals were all lower as profit taking took place and a potential for sellers to continue to jump in here:
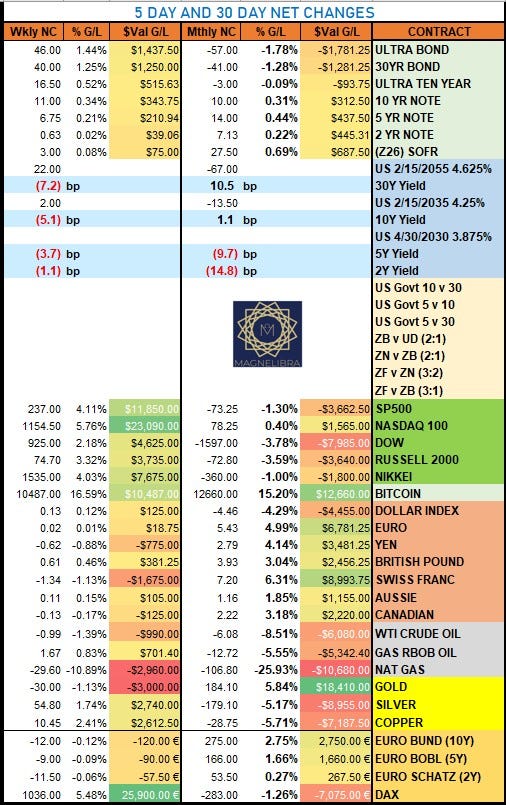
The 5 & 30 Day rolling changes- The weekly winner was Bitcoin +16%, the big loser Nat Gas -11%:
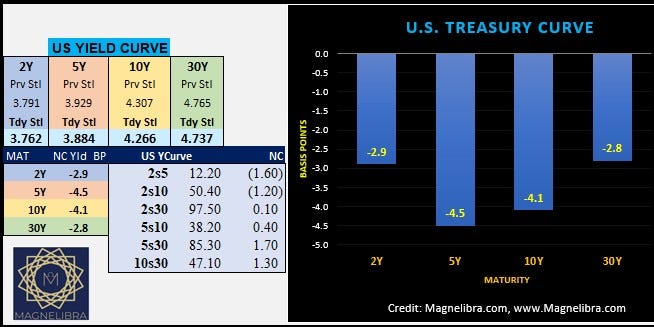
US Yield Curves: US yield curves saw most of the bid in the belly (5s and 10y sectors):
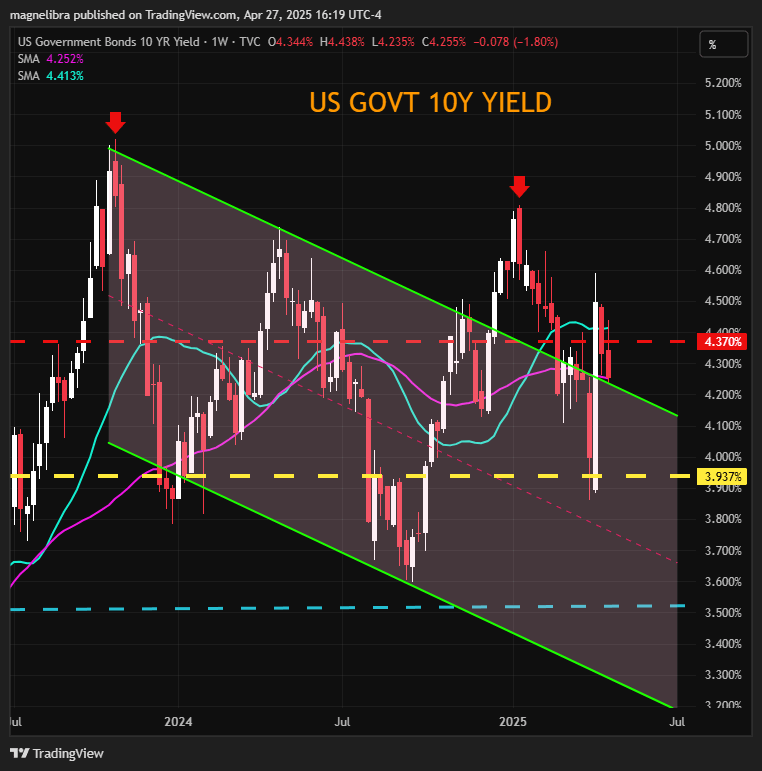
The US Govt 10Y is now firmly back below 4.37% and now threatening the downward trend line once again:
We also wanted to touch upon the bid in the US Treasury futures markets this week, leading to the yields falling, but also we saw the US Bond Basis continue to collapse as well. This basis trade has been the talk of some on social media sites and a concern of the US treasury and market volatility. We suspect we will continue to see the basis cheapen especially given the fact that we have new issues coming online in May!
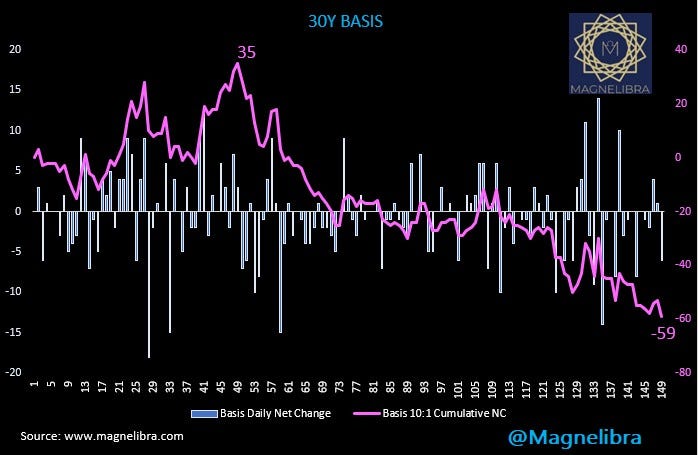
We can go in depth about this trade as we are experts and have traded this market for the majority of our career. We believe this is a pretty orderly selloff and consistent with both the trajectory of the current yield curve moves as well as the new supply coming in 2 weeks. Basically what this chart depicts is the daily difference between the 30Y bond futures daily net change and the net change of the US Treasury 30Y cash bond. The ratio is ten bond futures to 1 US 30Y treasury cash. The reason for this ratio is that the futures contracts are $100k and US treasury cash is $1m contract. There are many nuances to this trade, to ratios but for simplification purposes this is sufficient.
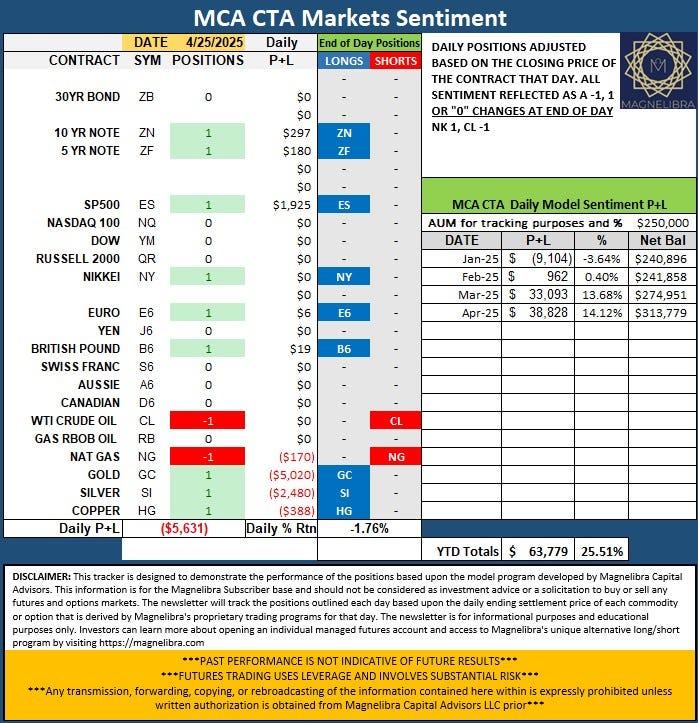
Magnelibra CTA Markets Sentiment Tracker - NK moves to 1 (long bias) and CL moves to -1 (short bias):
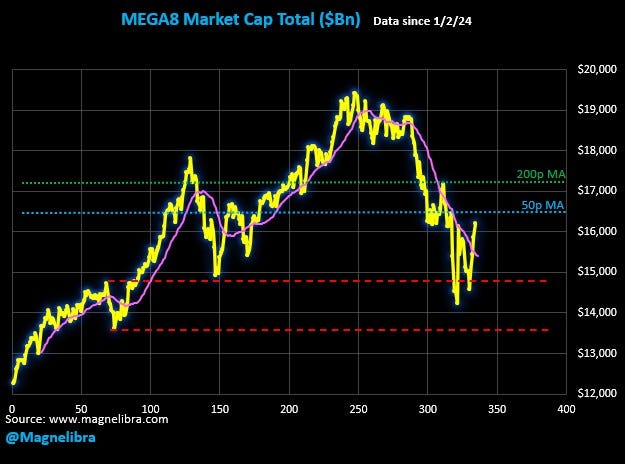
MEGA8s Data - The hedge did not work that great last week and we will continue to monitor this strong up move from the equities, we will most likely look at outright puts on a decent up move for a hedge to this basket this week:
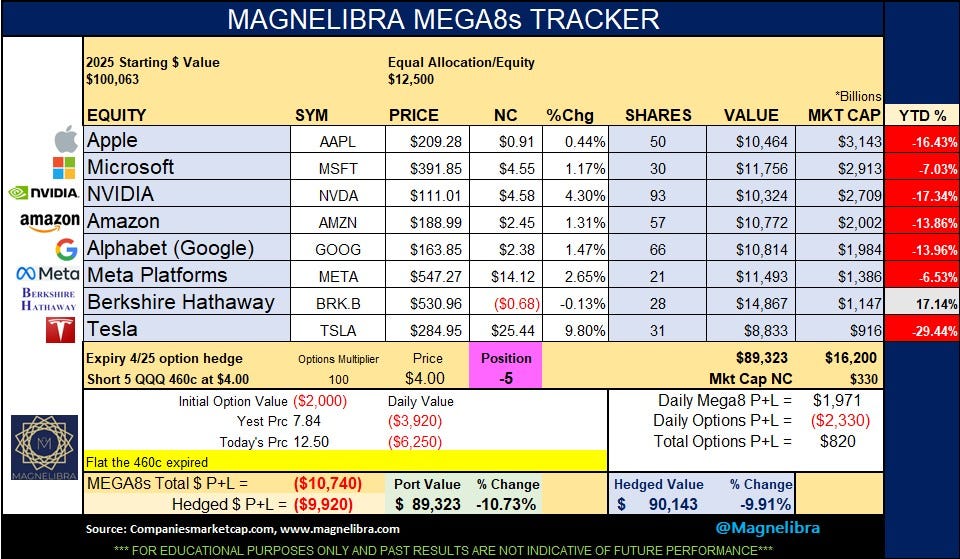
21pMA (purple line) is now initial support and magnet:
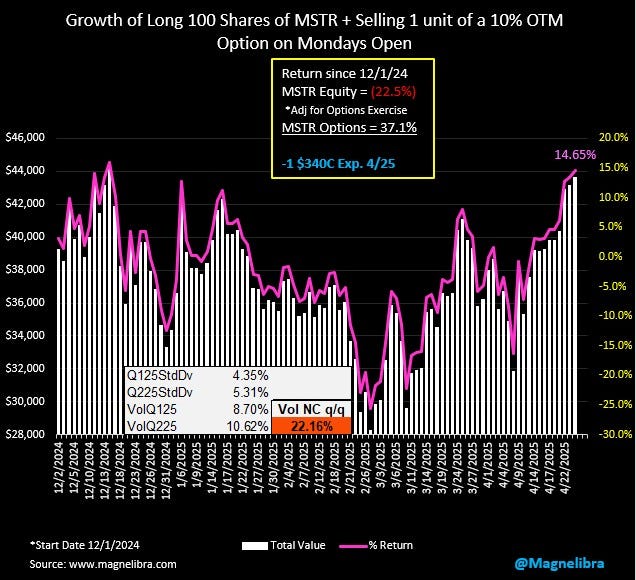
StrategyB (Bitcoin vs MSTR) Covered Call Tracker- the strategy MSTR equity return has been adjusted to reflect the proper valuation from the short call exercise price as each week we set a strike and if the stock closes above it, we need to reduce the actual close to reflect our lower strike price. Anyhow the strategy is +14.7% since Dec.1 2024 as MSTR equity has benefitted from both more acquisition of BTC and the price rise off the lows:
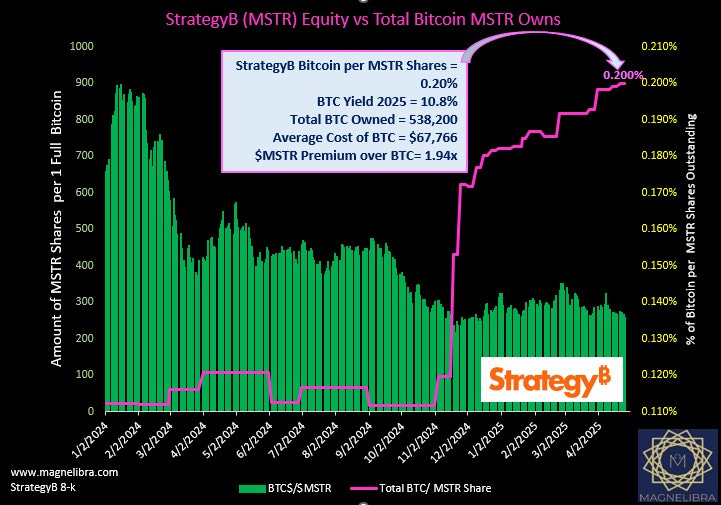
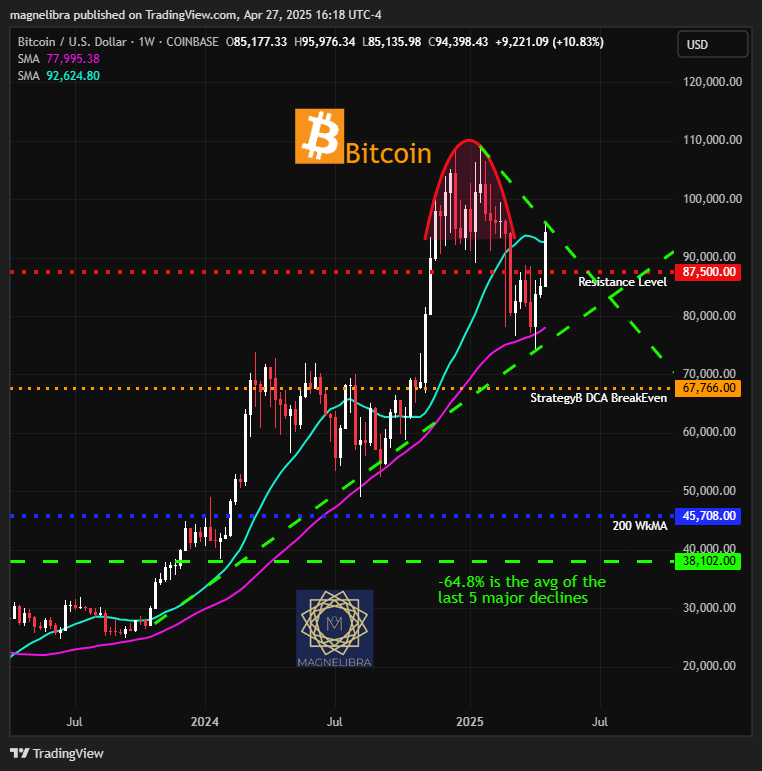
As far as the BTC chart, Bitcoin needs to see a sustained close above $95k and then $97.5k would likely then remove the sell side bias for now but the consolidative bounce is constructive. Will see how the markets react to this area to start the week, $83k is key on the downside:
Alright guys, thank you for supporting our work!
Stay positive and know that you are well informed, you have everything at your fingertips so don’t worry, start moving in the right direction, take hold of the reigns and stack the probabilities of success in your favor, every little step matters, every stumbling block over come matters.
You don’t owe it to anyone else, you owe it to yourself.
Support directly to our BTC address: 3DvDvPnjwu5Fd6sagAYmiFXA2fPkjJf2cp