
Equities Tumble Post FOMC
Options and Equity Technical charts, Bitcoin and More

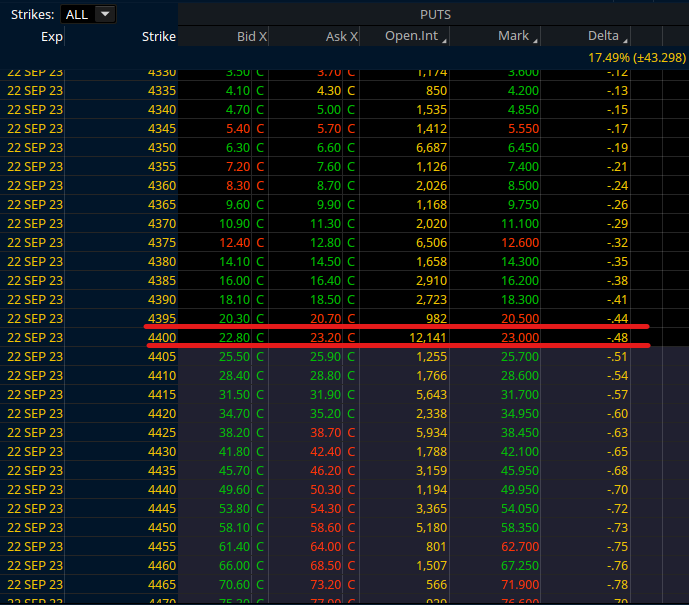
With the FOMC on hold today and with the seasonals not on the bulls side right now, the market selling was too much for the market makers to hold and now they are threatening the 4400 level in the SPX. There is major put volume here for the Friday expiration and if we start to trade below these guys will have to hedge these shorts and sell, exacerbating and continuing to dump the market. Our guess is they will try to mount some rally off of this area after a dip below and try to settle the SPX above this area by end of day Friday. We are not sure if they can but they will try! Here is a look at the options book for the SPX put options for Friday’s expiration:
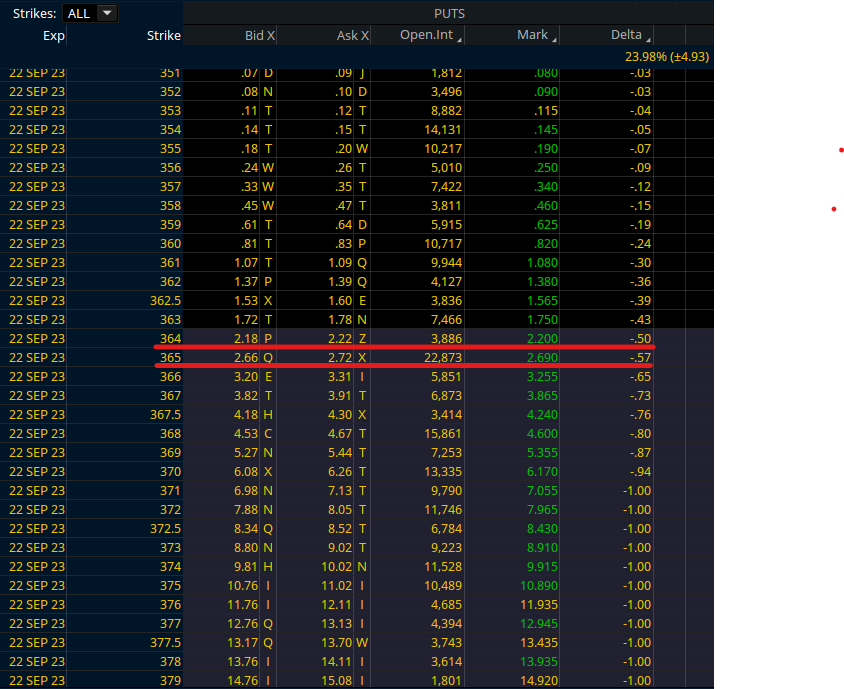
As far as the same expiry in the QQQs 365 is massive and both the SPX and QQQs are trading right at there heavy open interest put pegs for now with 2 full trading days left:
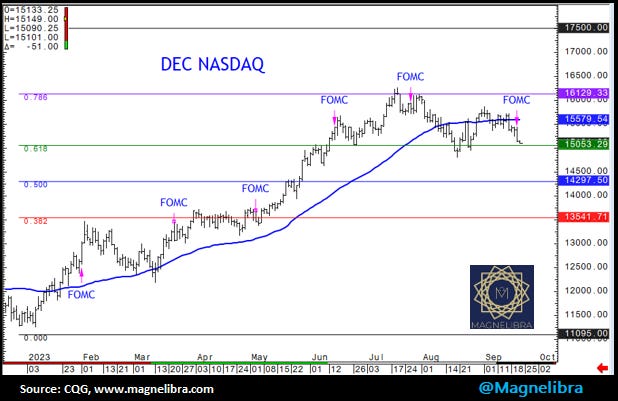
Overall the equities put in an abysmal performance today and we shared this chart earlier but here is the Nasdaq futures with the FOMC meeting dates highlighted showing a clear head and shoulders pattern via the marking of the FOMC days:
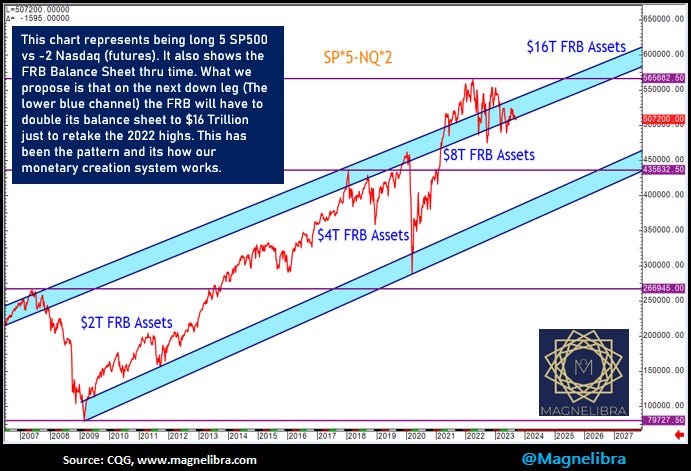
We know the FRB will try to play hardball, but in reality they have too, they need the market to readjust asset prices lower and it looks as if they will get their way, especially with the way everything is setting up here in equity land. We know when things unwind, which they always will, we expect the FRB to expand their balance sheet another 2x once the markets have fallen enough to make it worth their Zero WACC save the day capital deployment. Here is our 5x2 SP vs NQ futures chart with the FRB assets balance and of course our future balance estimate of $16T:
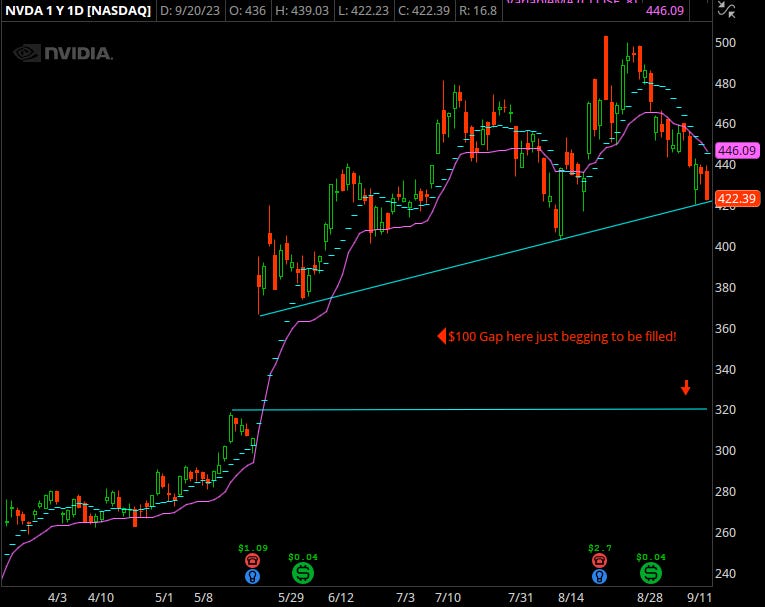
In regards to the technical collapse across the Nasdaq names today, let’s look at Nvidia which is down 18.5% off its overnight earnings after market highs and looking as if its about to fall right out of bed assuming $420 doesn’t hold, with a $100 earnings gap well below:
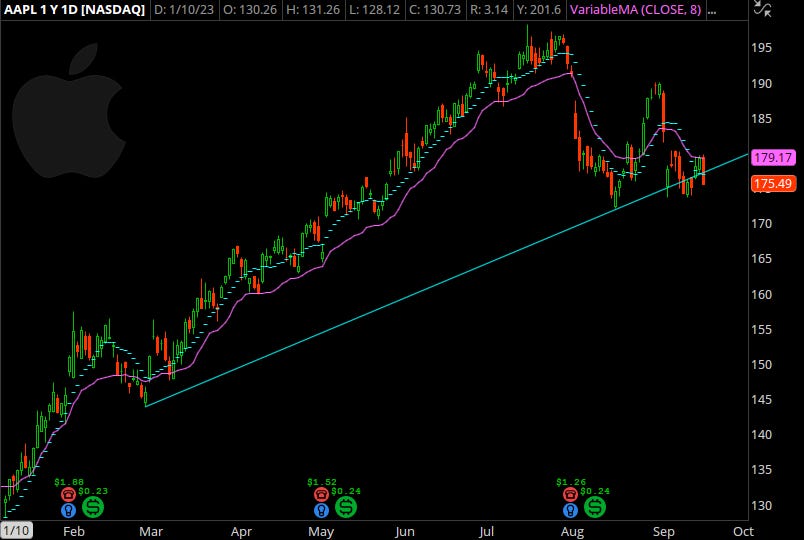
As far as Apple well considering JPowell for the first time ever used an Apple prompter to read his speech, well, this is the only tell we need to say selling is about to get unleashed, and then there’s the trendline it broke today also:
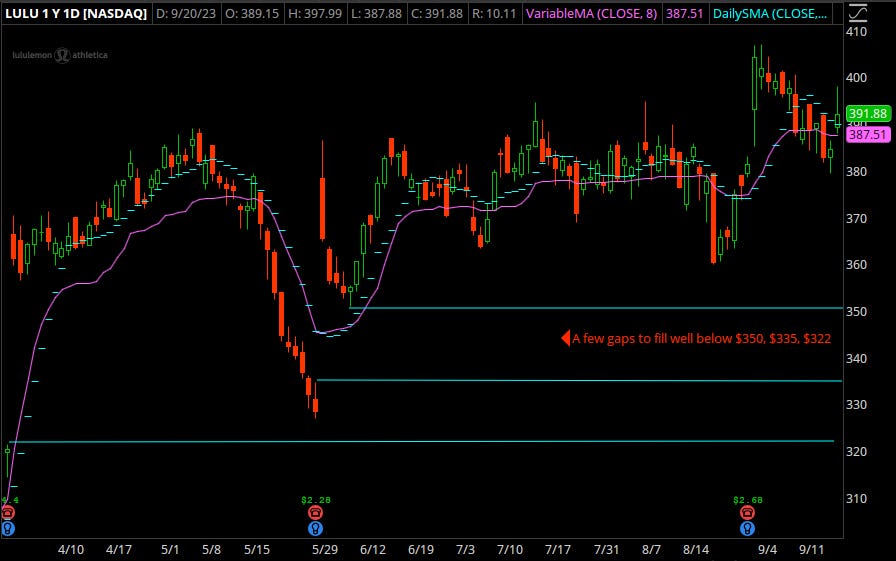
Another stock we want to highlight is Lululemon (LULU) that formidable yoga apparel company, who we can only imagine will start to lose steam as we move into a clear hard landing scenario, considering all the 20 to 40 somethings will have to restart student loan payments, this will hit them as well as discretionary spending craters. Today’s candle if followed by a down move near $380 will seal the top for us, with plenty of gaps below down at $350, $335 and $322:
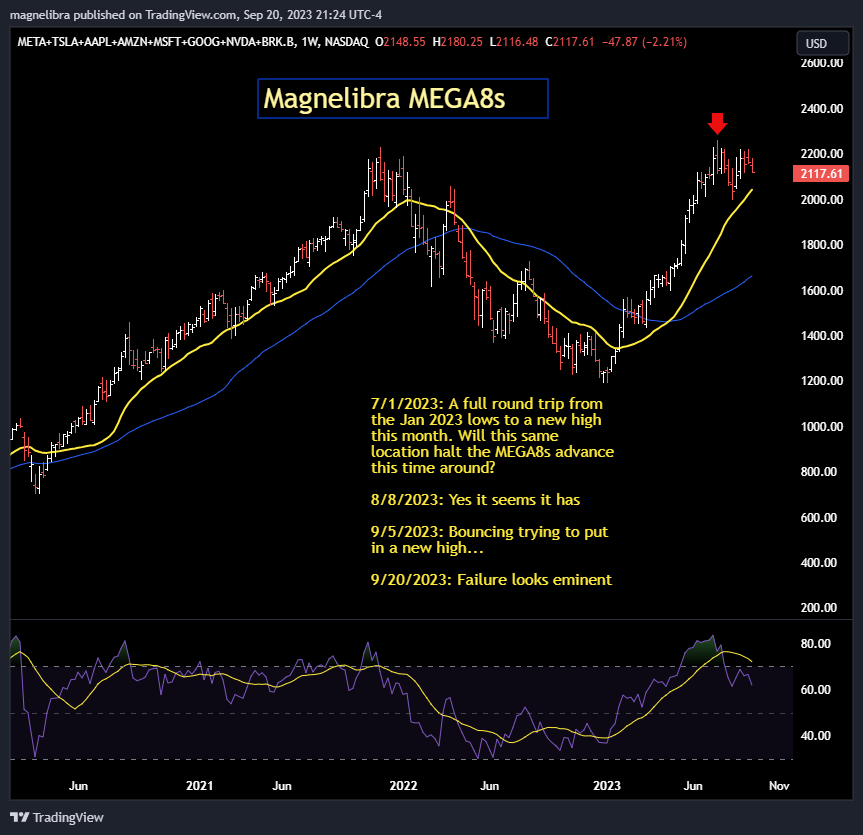
As far as the MEGA8s, not getting off that option hedge this week has proven costly but it is what it is and now the MEGA8s are back below $11.7T in market cap down $700Bn or so off the highs:
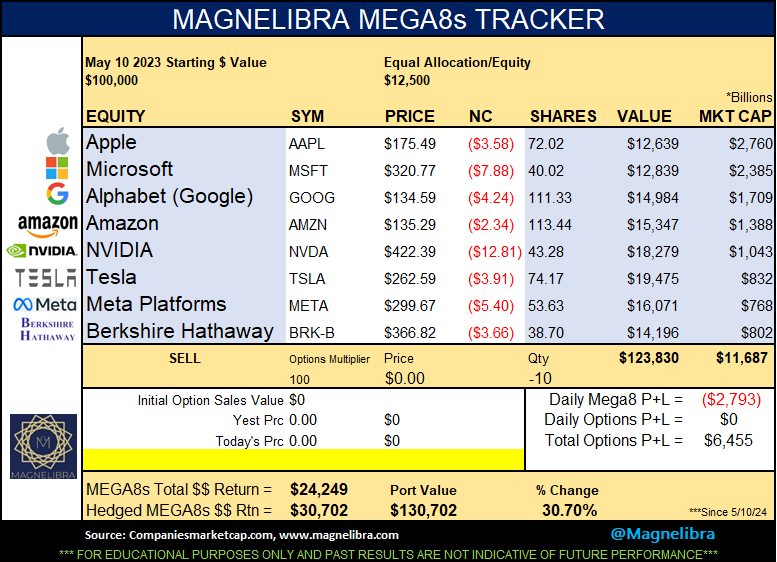
Overall the MEGA8s chart looks terrible and after a failed attempt to regain highs, well technically, this one should collapse from here:
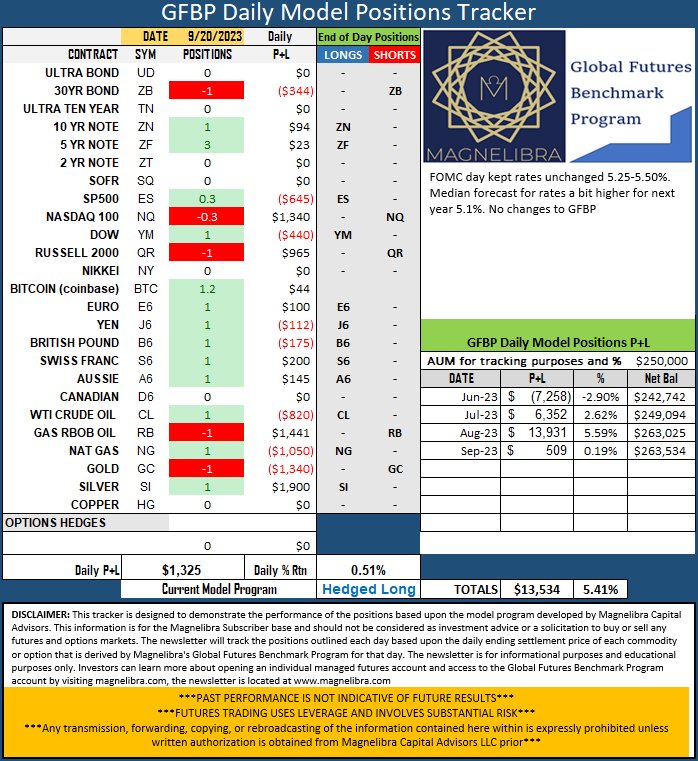
As far as the GFBP today, no changes and is finally back positive for the month, we will add another spread bond trade if we can get the tens below 108-00 area vs the bonds, so will see what tomorrow holds, but if equities continue to slide, we expect some of that to flow into the bond markets:
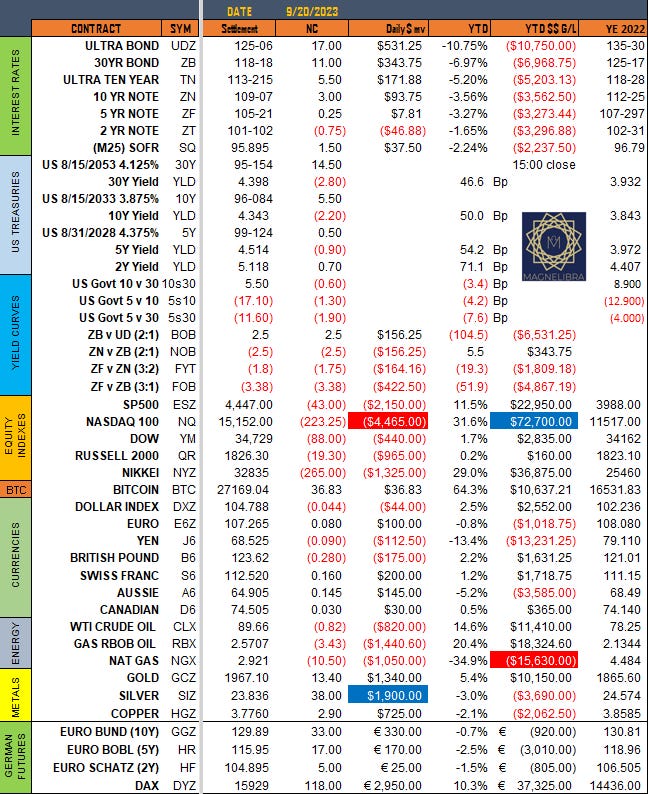
Overall here are the settlements for today, we will let the overall tone of the net changes speak for themselves, the 2pm settles for the fixed income arena don’t do it justice, the market continued to fall with the bonds down below 117-20 and the Tens below 108-25:
Here is the current picture of the US treasury yields as of this letter in early Asia session, the 5Y is +10bp to 4.614%!
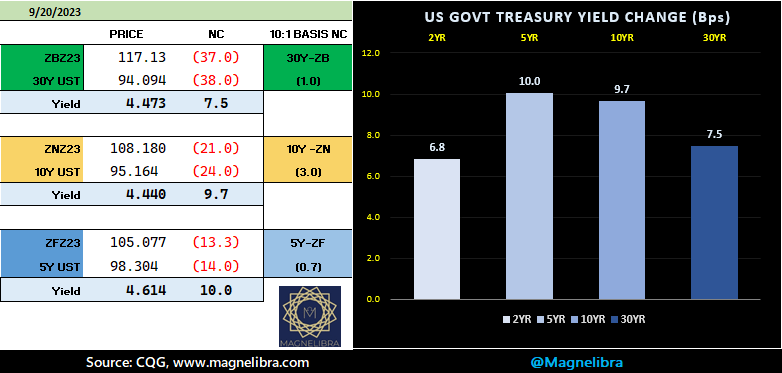
We are seeing real selling by cash accounts in the middle of the curve here as the higher for longer is forcing some accounts to bail! Currently the US govt 2Y note yield is 5.186% +6.8bps so far! In a little under 6 months the 2Y has gone from 3.77% to 5.18% a massive 141 basis point move, and to say that the global bond markets weren’t convinced about the FRBs resolve…well we say they are now! We suspect many large players are getting their asses handed to them and these bailers hitting the front end now, will give way to massive longer duration sales vs front end purchasers looking for some real longer term value, however the stock market needs to comply, if it tanks then they will show up, if it doesn’t, well then maybe all the US Govt Yields will converge at 5.33% the effective current Federal Funds Rate!
Ok its been a long day traders and investors, we made this one a freebie as its too much to hide behind a paywall and you deserve more. We would love for you to support our work if you can, or at least share it so we can gain a wider audience!
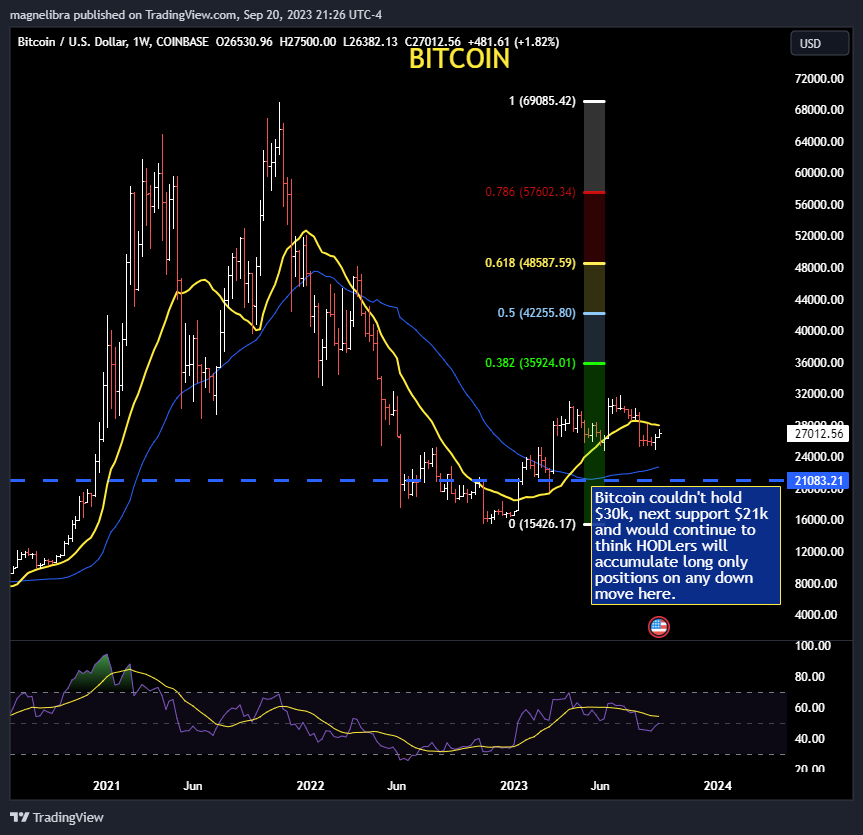
We leave you finally with the current Bitcoin chart, which has held up lately and we know many will continue to accumulate in anticipation of all the future ETFs in the pipeline. (side note we are core Bitcoin HODLERs and we do not recommend any Wall Street gaming of the core Bitcoin ledger, we view buying, holding and cold storage the only way)
Ok good luck traders and investors and please do what you can to spread our work to the masses, the knowledge you gain is something that shouldn’t be hoarded, rather shared, expanded upon so that we all can gain a wider understanding of the complexities that not only drive our markets, but that drive mankind!