

Alright, so we are breaking this weekends writings up into two different posts, this first one will be a freebie, because all the items we are covering are far too important to hide behind a paywall. The next one will provide our usual subscribers with our settlement and tracker updates as well as technical charts for the markets we follow.
If you aren’t subscribed, you should be, we believe the content we provide, the insight in which we comment and convey are second to none, non-linear and outside the irrational thinking that plagues all of media! For a mere $1.67 a day you can become one of the many whom we enlighten with our missives each and every day.
As we said, this one is a freebie too important to hide behind a paywall, we aren’t pigs because we know pigs eventually get slaughtered, rather we fight the long fight, the fight for humanity’s intellectual growth in hopes our kids have a world that is better than the one we were born into.
We believe that within humanity is the propensity to create and evolve to develop things of great magnitude, yet within that realm is also the prospect of creating great pain, suffering and destruction. Unfortunately we live in a system defined by duality, a binary intelligently designed construct by which we are mere players with deterministic potentiality parameterized by this duality.
Within it we must find balance and that is where we strive, where we intend to operate, on the fringe creating balance between these two subsets of light and darkness, good and evil, right from wrong.
Ok first up is something we originally shared on our Twitter and LinkedIn, it was a link to an article Fitch Ratings did in April of 2022 entitled:
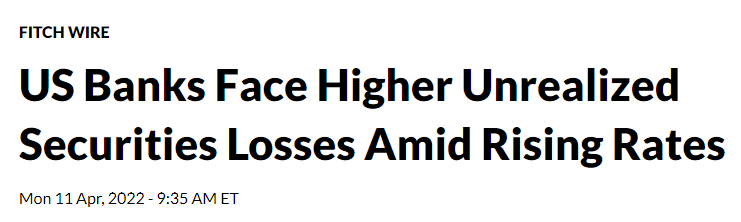
Here is the link to this article, FitchRatings on U.S. Banks Unrealized Losses
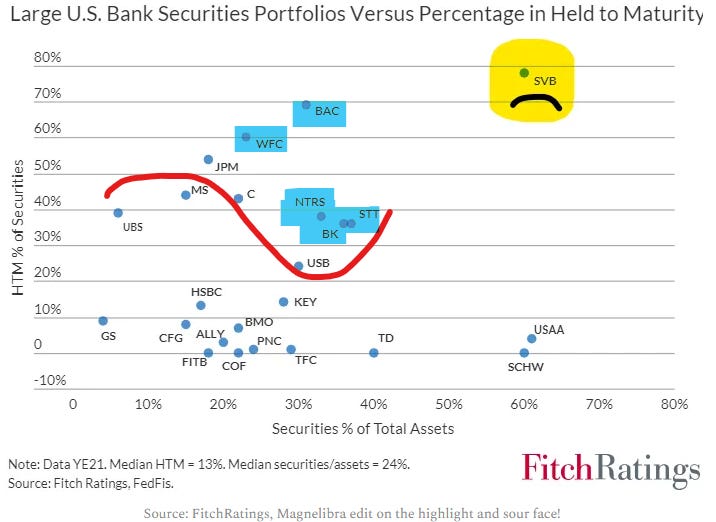
One of the charts that they posted was this one here showing just how much of an outlier, at the time SVB (Silicon Valley Bank, former that is) truly was:
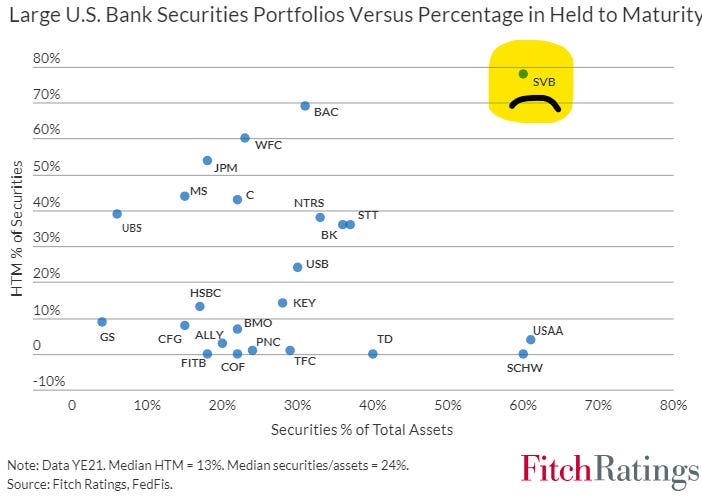
We believe any bank that is outside that 30% Securities and 30% HTM boundary is taking on heavy MTM losses and will most likely move AFS securities to HTM to avoid posting unrealized loss metrics and posting values “at cost” as opposed to fair value…even the Federal Reserve itself cut off reporting total bank unrealized losses in March of 2022, how convenient!
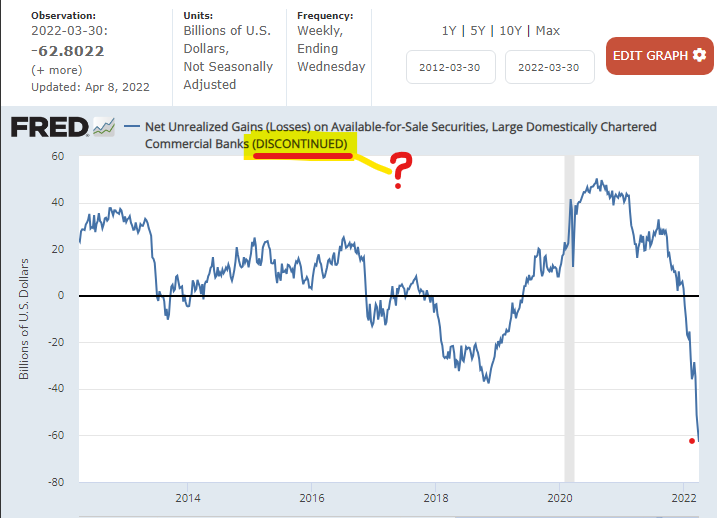
Yes this is April of 2022, no wonder SVBs chief risk offer decided in April of 2022 to forgo her duties, you think she didn’t know what was happening??? You think their regulator the Federal Reserve Bank of San Francisco didn’t know? Of course they knew and they admitted it in their report to the US congress oversight committee, in their opening paragraph shown here:
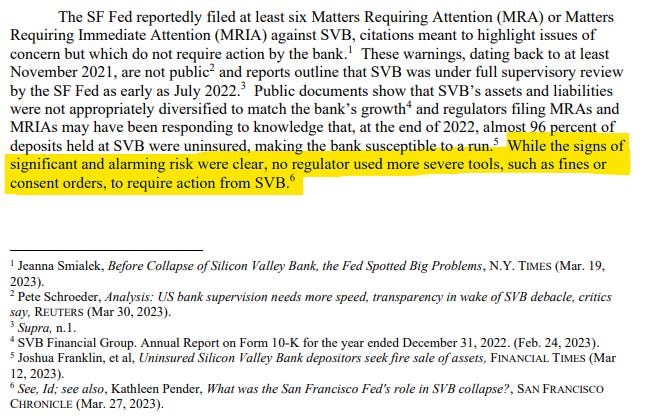
So yeah when we have a clear disdain for Central Banks, for tax payer funded bailout programs, this is just one of the many examples! We all know the real reason the bailout occurred was to protect the billions in UNINSURED DEPOSITS!
So considering the massive MTM losses that we know of now, given the fact that the US Govt 10Y yield has risen massively over the last year and a half. It has gone from a low of 0.333% in March of 2022 to currently 4.257%, nearly 400bps.
Yes you could hold it to maturity the 10Y note you bought say in May of 2020 for Par and collect your 0.75% annually, yet for the banks, they have capital ratios that will be effected by MTM losses. This is where we believe the next source of bank downgrades will be coming from. We can only estimate the banks MTM losses are probably somewhere in the vicinity of 35% meaning the security bought at Par is now worth 65 cents.
So with that let’s focus on the banks above or sine wave in particular Bank of America, Wells Fargo Corp and State Street:
Fundamentally we know this sector has been hit hard, but rightfully so. We also know they have the BTFP to rely on, so there is a decent buffer and programs in place to utilize, we get it.
However, if MTM losses become too much, well then we suspect the banks will have to raise capital, i.e. issue equity. This will hit the overall valuations very hard and we suspect the longer term play to expect technical levels below to be targeted. Despite already falling from $48.27 to $29.11 last Friday, a hefty 39% drop, we have to keep things in perspective and realize preCovid the high was around $33. So with that technically we believe the 0.786 Fib is our target below, that is $17.73 or a further drop of 61% over the next year:
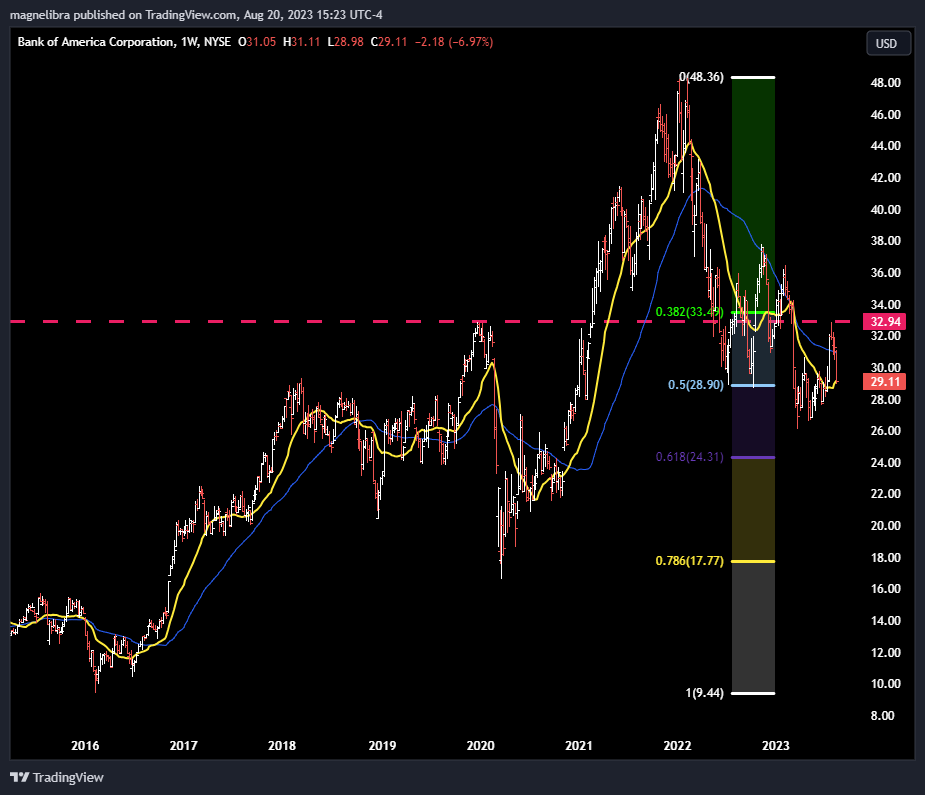
The June 2024, $25 BAC puts are trading $1.33, if we can get a move toward our target at full value of our target these puts would be worth about $7.25 or a 5.45:1 payoff. Market Cap wise a move down to this level from today’s valuations would mean a drop of around $141 Billion putting the Banks market cap at about $90Bn. The overall percentage down move to the 0.786 would be a 38.9% drop from current levels.
Moving to Wells Fargo the same Fib target threshold is down at$25.04 which indicates a further downside move of $17.46 or a loss of 41% from current levels. Its interesting to note that Wells is only down 26.6% off the highs, its held in quite well, probably because they have a big mortgage book of locked in rates:
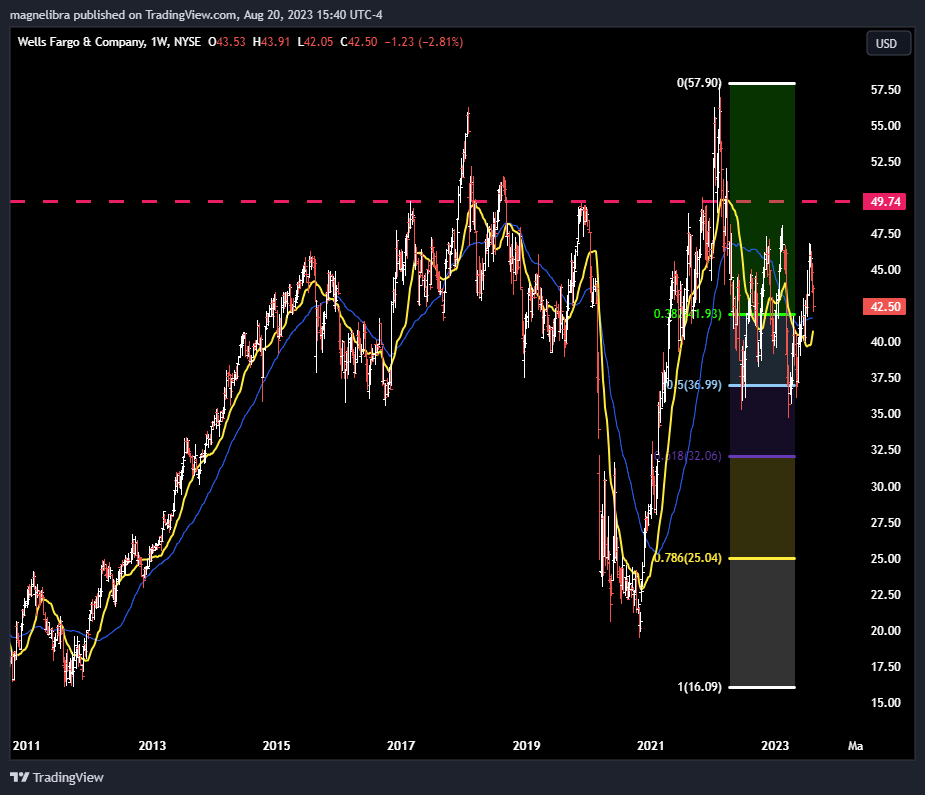
The June 2024, $30 puts are trading at $0.82. If we can get a move toward our target at full value of our target these puts would be worth about $5.00 or a 6.1:1 payoff. Market Cap wise a move down to this level from today’s valuations would mean a drop of around $64.2 Billion putting the Banks market cap at about $91.7Bn. We also took a look at the $22.50 puts they are $0.21.
If equity does come into question then this option does present a decent risk reward for those more risky bet players looking for some real volatility and a larger overall downward move. The overall percentage down move to the 0.786 would be a 41.1% drop from current levels.
When it comes to State Street, we believe nobody is looking at this company as a real downside risk, however we are. In fact they are down only 32% off their highs and the 0.786 Fib is down at $39.08 or 42.4% lower than current levels.
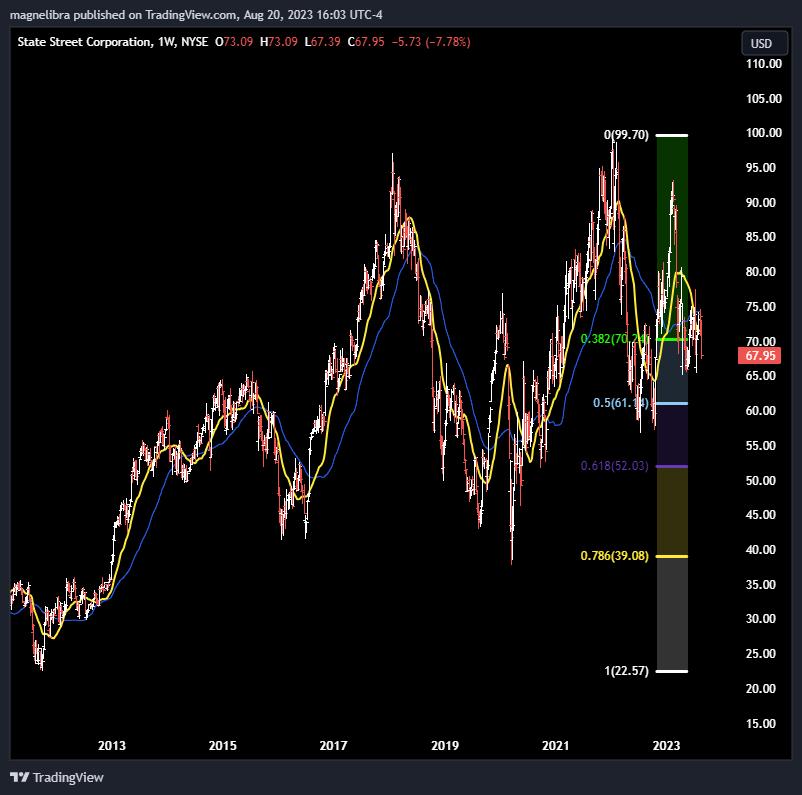
When we look at the June 2024, $45 puts they are trading $1.20 which down at the fib level these would be worth around $6. So a ratio of 5:1. This move market cap wise would be a reduction of $9.3Bn for a market cap of 12.6Bn. For a cheaper downside play you can move down to the $35 put and pay around $0.35. Risk and vol players can fund puts with selling calls for instance some players may be in a position to take on greater risk to make downside bets and will fund the purchase of puts with the selling of calls.
Let us stress, we are not inclined to recommend this type of naked option selling, rather we like set risk plays like premiums paid. However if players have a higher tolerance for risk, they could fund the $35 puts by selling the same date expiration $95 calls for a small credit, basically paying for their downside risk plays.
So why do we present potential downside plays like this? Because we believe the global risk off event is now underway and a lot of players are uninformed.
We know China and Japan continue to see their currencies get devalued. We continue to see war and offensives in Ukraine, Africa and soon in the Middle East again. We know the world post covid is fragile and still reeling from the massive government overreach all around the world.
We also know here in the United States, the FRB has driven rates so high above intrinsic economic equilibrium, that their main goal is not inflation deflation, but rather to destroy economic leverage that has run rampant from their prior decade of ZIRP and QE mistakes.
We know mark to market losses are massive and will continue to plague the banking sector and force more write-downs, more consolidation and eventually force capital to be raised. It is within this discounting of future capital raising that we initiated this letter today.
Back in 2008 nobody saw Countrywide, Merrill, Lehman, BearStearns…just like today nobody is looking once again. Everyone says the banks are “well capitalized” well we don’t think so, we believe the current economic landscape is full of landmines, full of false valuations built on ZIRP and QE levered monetary mechanisms and that NEGATIVE CARRY is the ultimate levered destroyer. We shared this chart before and we will share it again here, do you see any similarities to the years leading up to 2000, 2008 and now 2024?
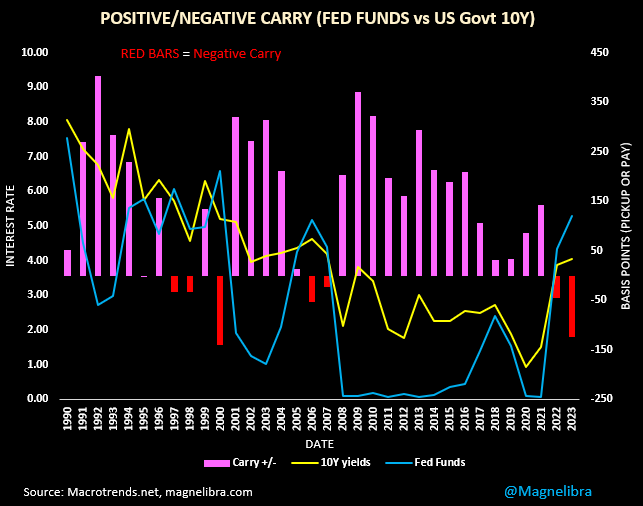
Maybe you can begin to see what we see…and if that isn’t enough, maybe this chart from Hussman Strategic Advisors will help:
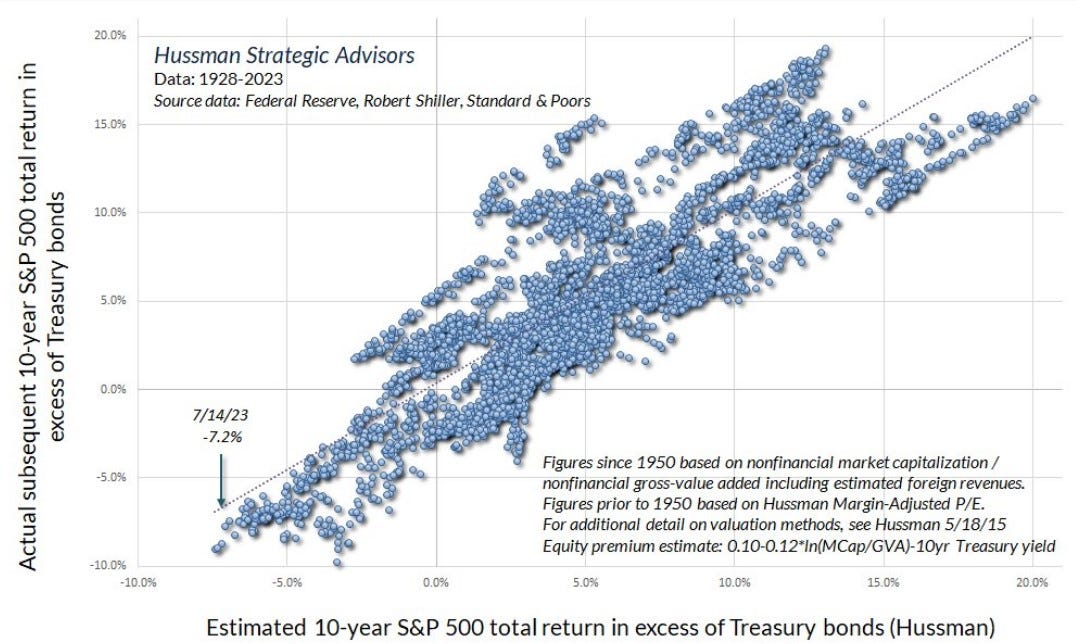
We have studied the period between 1967 and 1982 and we do not believe U.S. investors nor any investors around the world for that matter are prepared for a 15 year period like that.
Can your portfolio handle it?
Will the buy and hold work for you should equities move lower or nowhere over the next 15 years?
Do you honestly think a US govt that will have an estimated $50 Trillion in debt in 6 years will not impede on earnings via taxation changes?
There is a lot to unpack and that is what we try to do here at Magnelibra, so join us in this journey and realize there is always something more to learn. Basically for a $1.67 a day you get the kind of knowledge that does not exist in the main stream, it only exists in independents like us. So support our work, like, share and most definitely subscribe if you can afford to. If you can’t afford it we get it, maybe we can put you in a position where you one day can, that is our goal!
DISCLAIMER: For educational purposes only. This is not a solicitation to buy or sell commodity futures or options. The risk of trading securities, futures and options can be substantial and is not for everyone. Such investments may not be appropriate for the recipient. The valuation of futures and options may fluctuate, and, as a result, clients may lose more than their original investment. Nothing contained in this message may be construed as an express or an implied promise, guarantee or implication by, of, or from the author Michael Agne owner of Magnelibra Capital Advisors. Magnelibra the CTA and its Global Futures Benchmark Program may hold long and or short positions in the various futures and markets that Magnelibra covers. We will never claim that you will profit or that losses can or will be limited in any manner whatsoever. Past performance is not necessarily indicative of future results. Although care has been taken to assure the accuracy, completeness and reliability of the information contained herein, we make no warranty, express or implied, or assume any legal liability or responsibility for the accuracy, completeness, reliability or usefulness of any information, product, service or process disclosed.