


Hey guys, welcome to todays market update from Magnelibra Trading and Research. Today’s episode #66 is entitled “FOMC Day is Here, Will Risk Assets Recognize Lower Rates?”
Quick Disclaimer: The following podcast is for educational purposes only. This is not a solicitation to buy or sell commodity futures or options. The risk of trading securities, futures and options can be substantial and may not be appropriate for all listeners.
So the FOMC will deliver another 25bp cut this afternoon, or at least that is the widely expected result. The big question we have is, with equity and most risk assets pushing higher, will this be the market marker to reverse some of this euphoria? We pose this question because in general, the big players need certain market events to propel a certain narrative and we know the narrative has been one of continued bullishness, a sort of one way move for most of Q4 2024. The markets are in general moving as if interest rates do not matter, as if economic global slowdowns, do not matter and historically this type of ignorance by so many eventually turns and turns fast.
So this is an important meeting and we will look to the post press conference to see what J Powell has on his mind. What we think is, he sees global central banks cutting and cutting fast and perhaps the FOMC has the luxury to sit back and operate at a slow 25bp per meeting pace. This is probably the best scenario for risk assets, however if the FOMC gets too far behind the curve well, that is when fireworks begin as at that point the risk assets would have most likely taken a turn for the worst and now the FOMC has to be reactionary as opposed to the comfort level of sitting back as a patient observer.
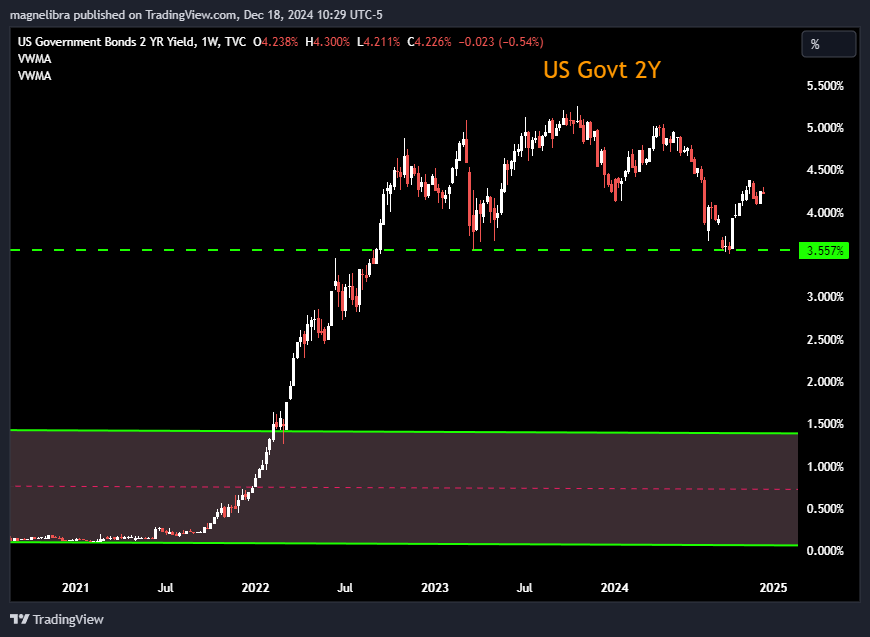
As far as the rates outlook, we continue to believe the FOMC will cut the Fed Funds below 3% next year and probably end at about 2.5%. We site deteriorating global economic demand, coupled with geopolitical unrest and a potential for the start of a major global risk sell off that is far long overdue. When we look at the US govt 2Y yield chart, you can just see a major decadal top forming and a break below 3.56% will solidify that for us:
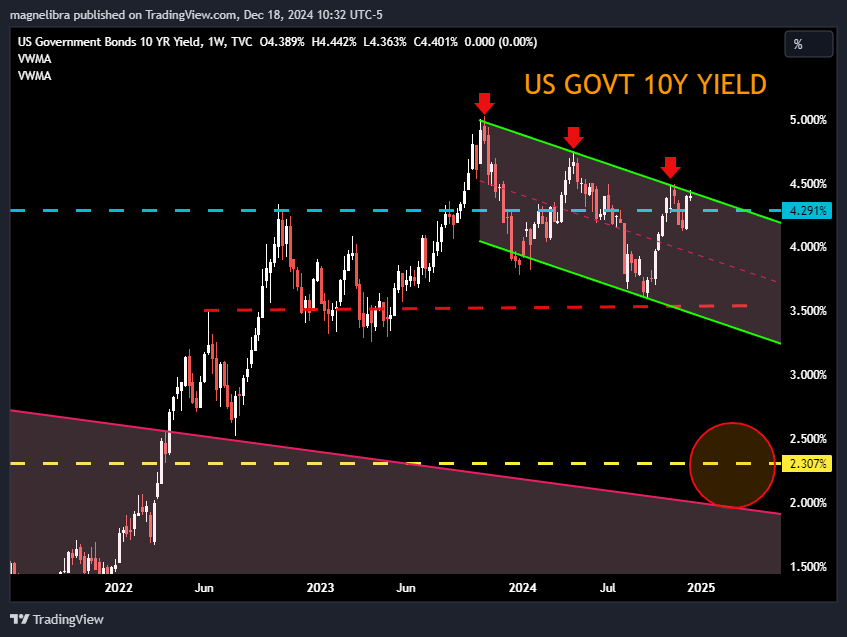
We can also see that 2024 has kept the US Govt 10Y in a nice trading band where 4.29% now on the weekly will close below our line in the sand there, currently the 10yr yield is 4.40% but this is still below our trend channel for now:
We also know that the incoming administration will be hell bent on getting US Debt interest costs down, which means political pressure on all fronts toward the FOMC!
In regards to market risk, one chart that does concern us is the Nasdaq Futures. When we look at the chart we see this nice trend channel, which has been in place since Q2 2023:
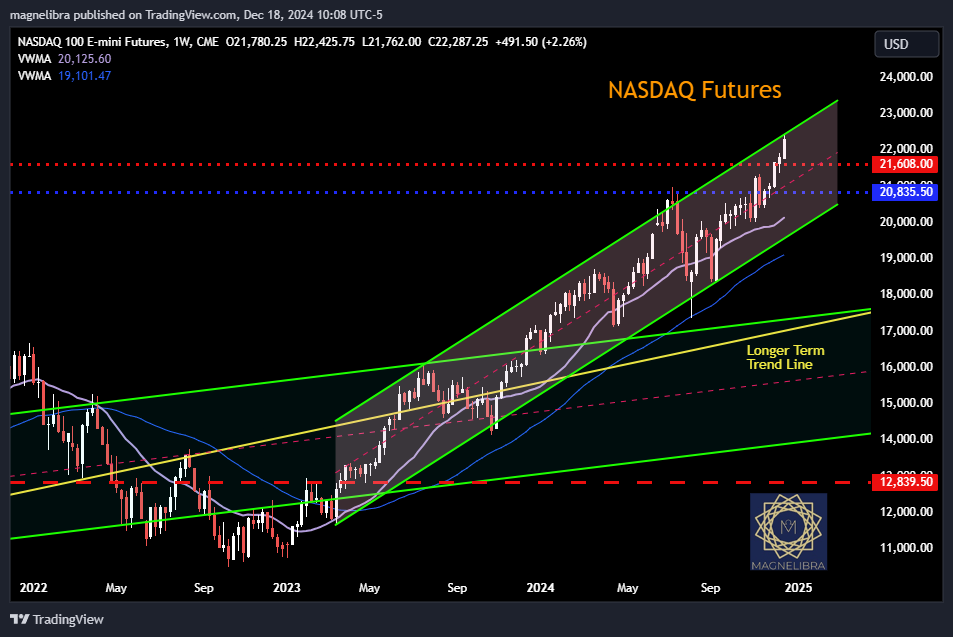
Now as we said, we aren’t picking tops, but our goal for you is to understand that there is nothing wrong with taking profits and reducing your risk. What we see when we see this chart is an extension level that could potentially see a reversal. We are not saying this will occur, but in the context of risk/reward, buying and staying long into this area is well tilted onto the risk side. For you newer traders or investors, to make this simple, let’s look at the next chart and let’s focus upon this trend channel and then place values on the lower/middle/upper areas of this, signified by a 1,5 and 10. These values represent a given level of long (buy) risk, meaning your risk of upside is greatest down at 1, and risk of downside is greatest up at 10:

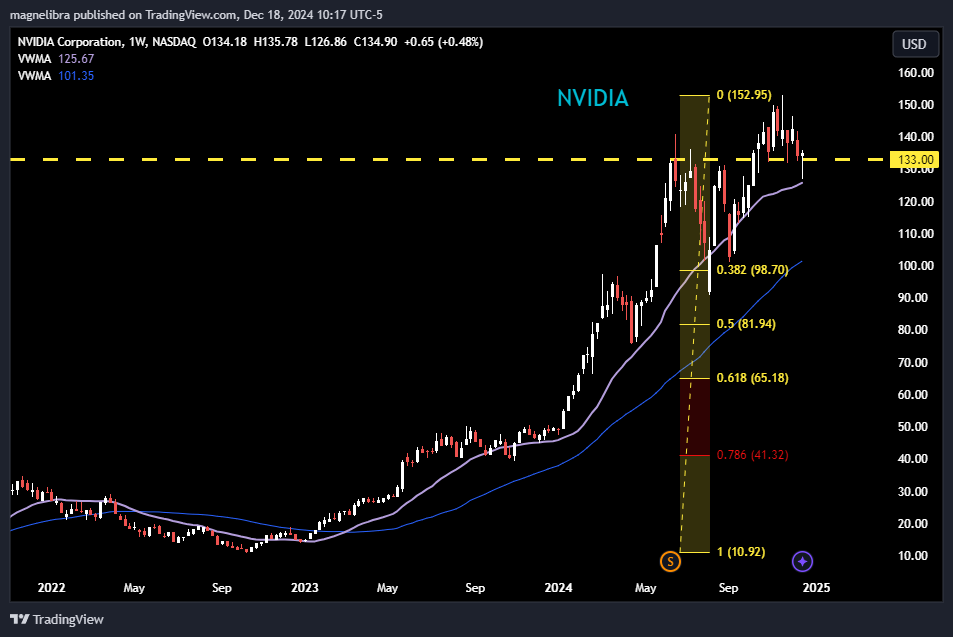
This is a very simplistic approach, but its something that you could use as a base case for your trading or even your long only equity investing. Anyway as far as the Nasdaq, we have seen liquidations out of some of those MEGA8s, in fact when we look at Nvidia, well let’s just say, its flashing a major red signal and a few podcasts back we talked about buying a cheap put spread, which is now working out. We have seen a close move toward the 21wk MA, which today has caused a technical bounce, but we believe that the $133 area is our line in the sand for the weekly close, so keep an eye out on this one:
Another interesting chart is the SP500 vs Nasdaq (futures) contract spread chart. In almost one month, the SP500 contract has lost almost $30,000 vs its Nasdaq counterparty. This shows you the dominance of the tech industry and a few names vs the broader market. We often say, the stock market is in no way a reflection of economic reality out on the street!
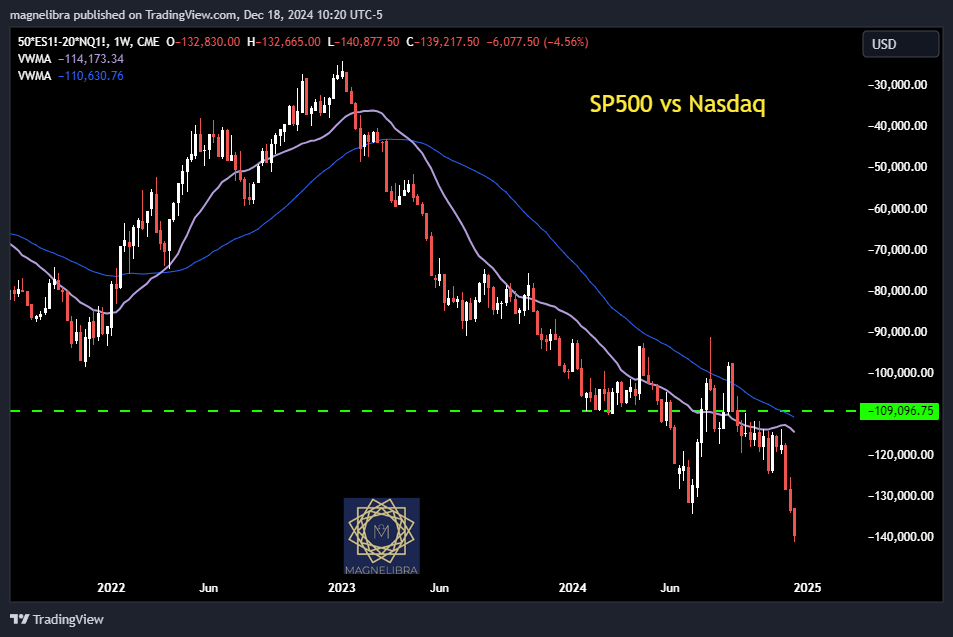
When you look at this spread, you can also see that in 2 years the SP500 contract has lost nearly $100k to the Nasdaq, an absolute amazing concentrated run!
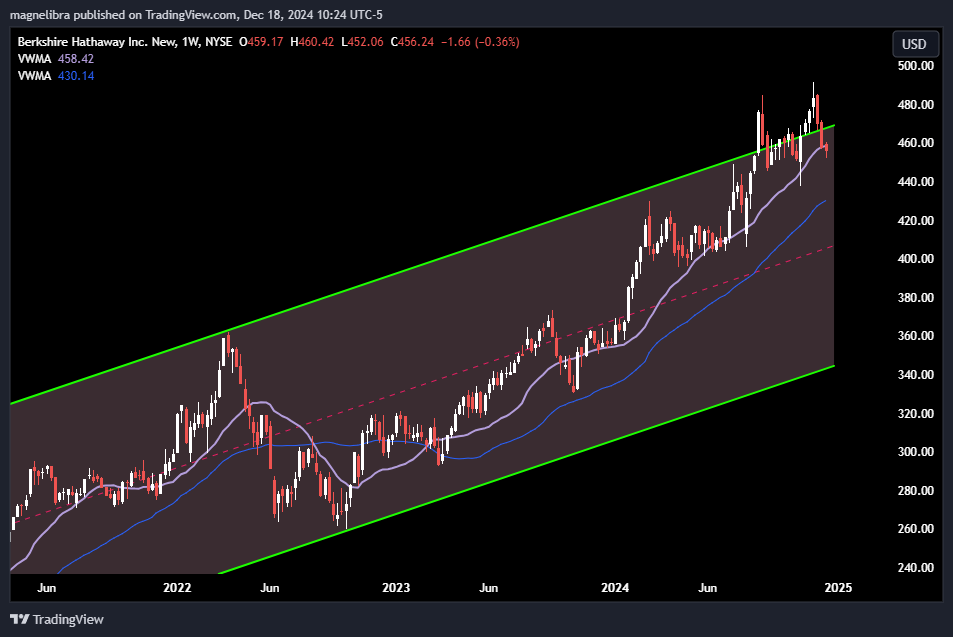
We see topping formations and or selling in the other techs as well, META, NFLX but we want to look at Berkshire. We know Buffett has been accumulating a lot of cash lately, > $330Bn and after a few attempts to break out of this long trend channel, its about to close below the 21wkMA for the first time since June:
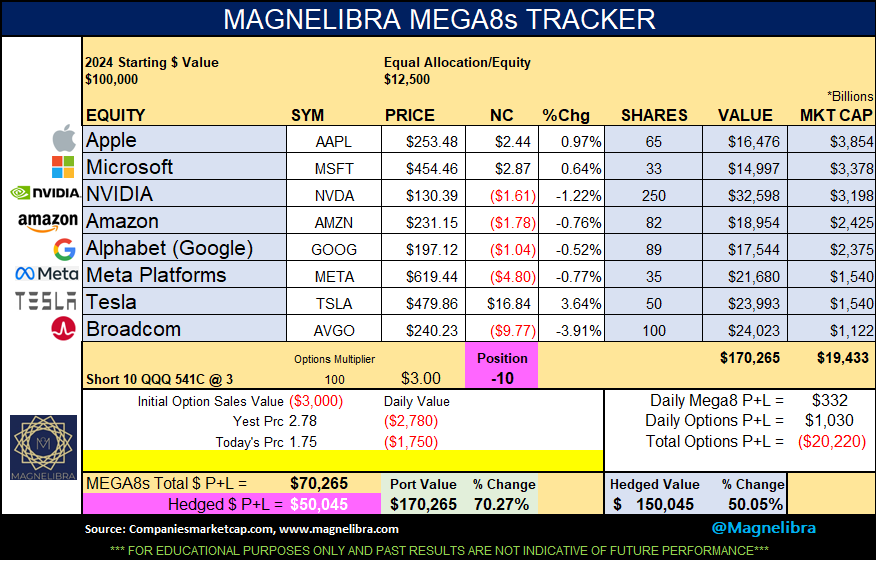
Ok let’s flip over to MEGA8s and take a look at our data there, Tesla continues to outperform as retail post election is all in and we see BroadCom saw some profit taking. This weeks hedge continues to perform well:
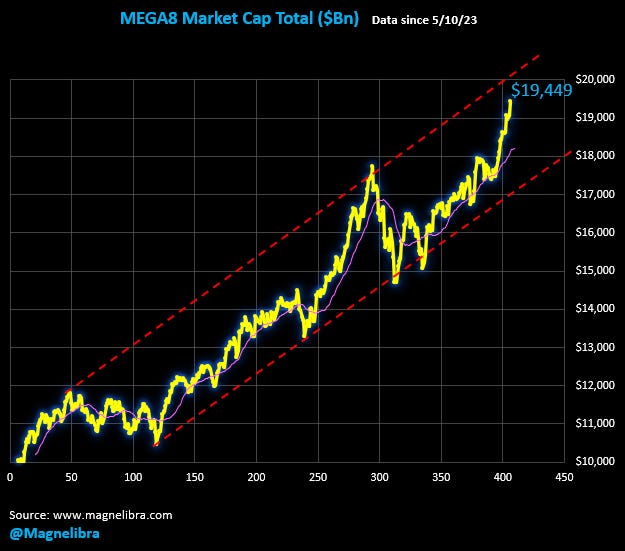
Here is the Market Cap chart total where $19449 is still the top:
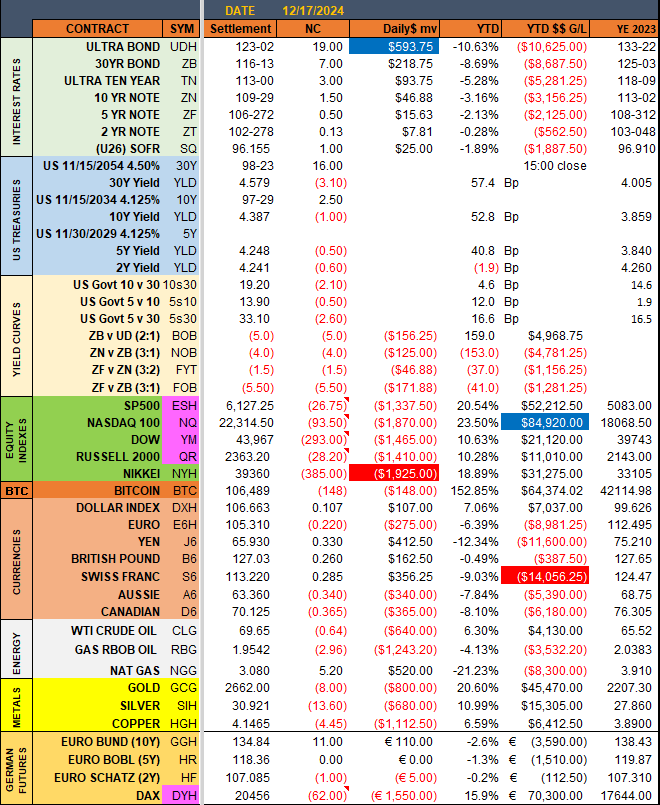
As far as the settlements we rolled US equity and Dax futures to March 2025 contracts the ultra bond contract the days meager winner with the Nikkei the biggest loser:
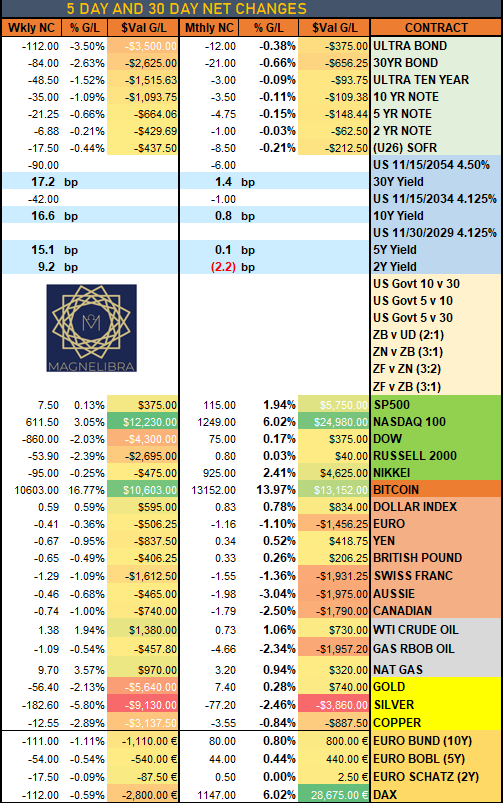
Rolling changes Nasdaq, Dax and Bitcoin dollar value winners over the last 4 weeks, with Silver the big loser:
Onto our MCA commodity trading advisor total market sentiment indicators:
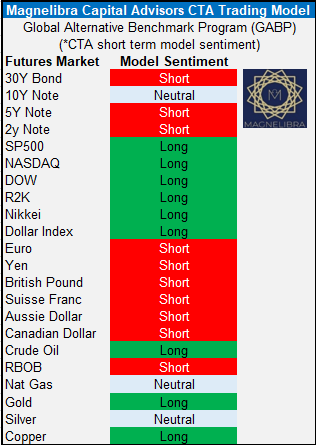
We offer this to our paid subscriber group now, its something we cannot divulge as to the derivation of this but we figure for those playing along, a look at a trend indicator model may assist in some format, if not you have it as a reference to the current trends of the markets we follow.
We hope you find our work insightful, we hope you like, share and if you are financially able, support our work. We know if you follow our data, if you follow our insight, that you will become a better investor, a better trader and you will look at not only investing in a non linear way, you will have a very different view of the world. Till next time…Cheers!
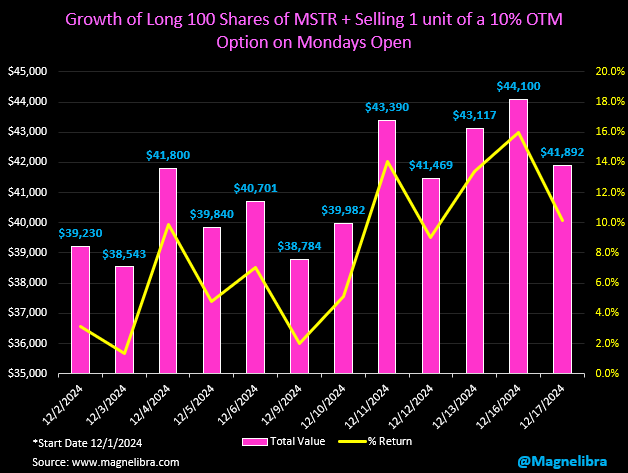
Bonus MicroStrategy/Options daily tracker:
DISCLAIMER: For educational purposes only. This is not a solicitation to buy or sell commodity futures or options. The risk of trading securities, futures and options can be substantial and is not for everyone. Such investments may not be appropriate for the recipient. The valuation of futures and options may fluctuate, and, as a result, clients may lose more than their original investment. Nothing contained in this message may be construed as an express or an implied promise, guarantee or implication by, of or from Magnelibra Capital Advisors. Magnelibra the Commodity Trading Advisory and its proprietary long/short commodities, futures and options managed accounts may hold long and or short positions in the various futures and markets that Magnelibra covers. We will never claim that you will profit or that losses can or will be limited in any manner whatsoever. Past performance is not necessarily indicative of future results. Although care has been taken to assure the accuracy, completeness and reliability of the information contained herein, we make no warranty, express or implied, or assume any legal liability or responsibility for the accuracy, completeness, reliability or usefulness of any information, product, service or process disclosed. If you are interested in opening an individual managed futures and options account to compliment your overall investment portfolio you can visit our website at https://magnelibra.com for more information. We are implementing a new trading program launching at the start of the new year, which will include access to Bitcoin futures and options. Please contact or make inquires directly to our introducing broker Capital Trading Group, please contact Nell Sloane at nsloane@capitaltradinggroup.com
All Rights Reserved Magnelibra Capital Advisors LLC 2024


