

Paywall removed guys so enjoy:
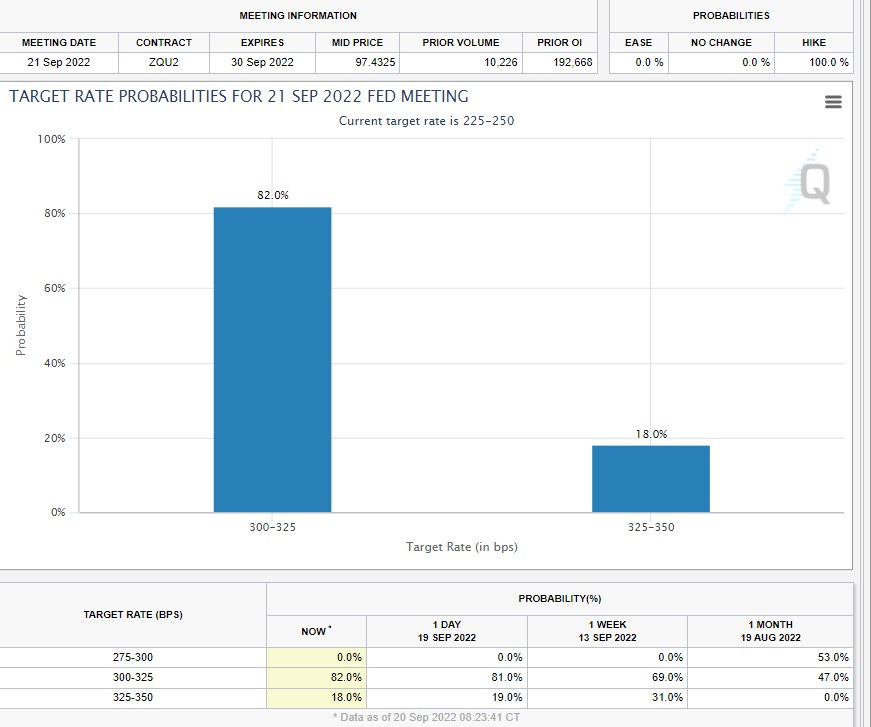
Alright so FOMC day is upon us and the latest CME watch tool is showing a 100% chance of 75bp hike with a little under 1 in 5 chance of a 100bp hike. We believe that Powell will deliver on the 75bp hike and that his tone will be defensive in nature. He will talk of energy prices easing but elevated inflation is still the main concern:
Speaking of inflation, well this sort of encapsulates our feelings right now, and no, inflation is not going unnoticed, that’s for damn sure:

Maybe this next chart will drive the inflation point home:
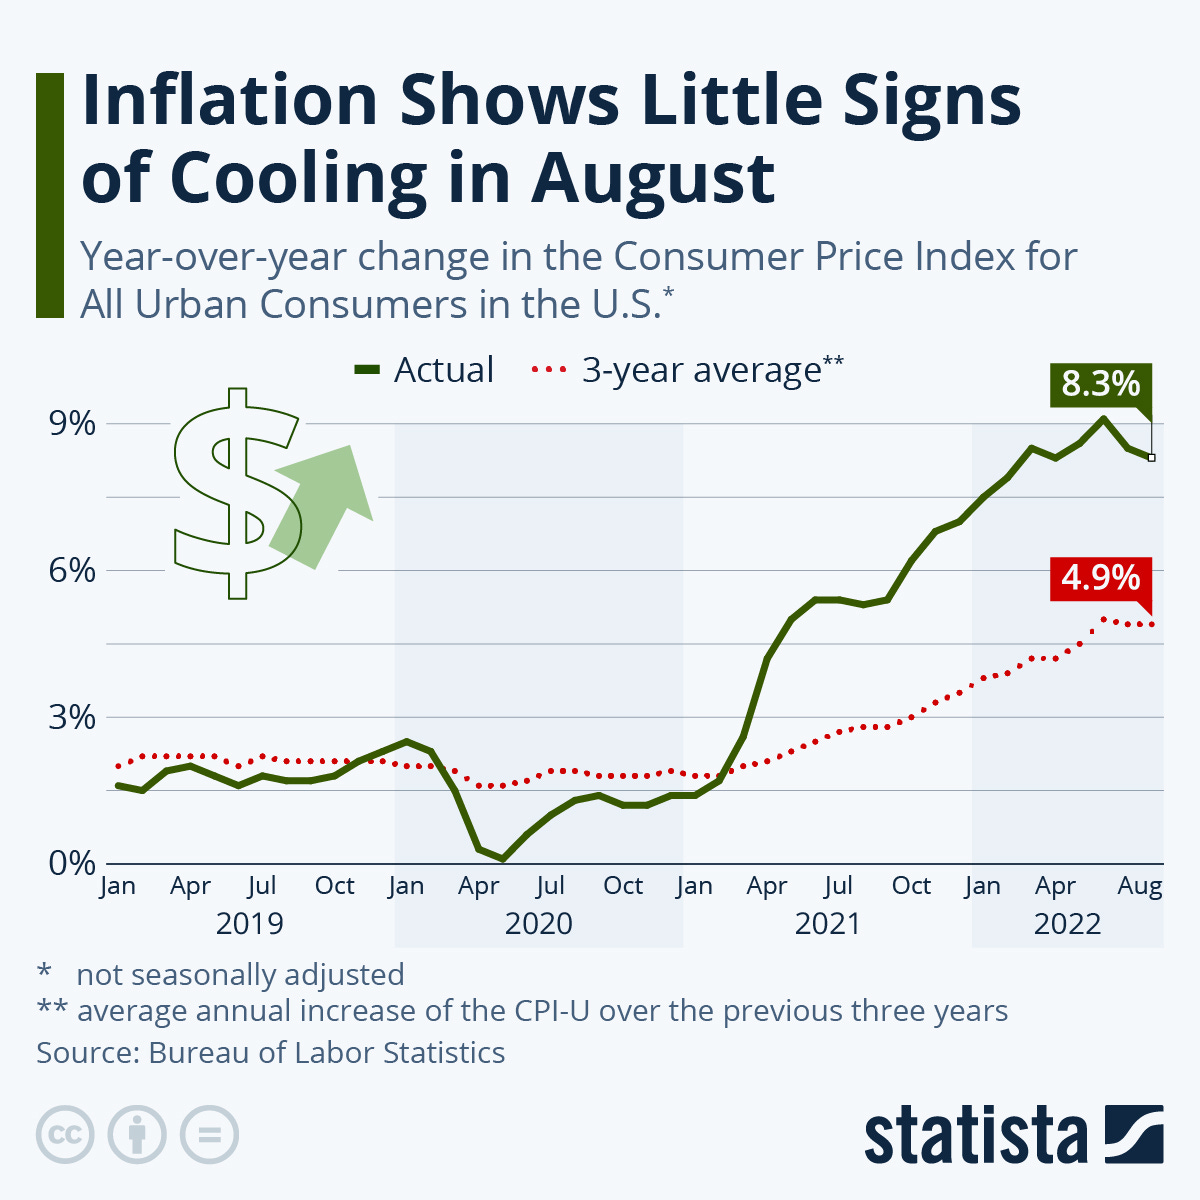
When you print money, when you increase the monetary supply vs a given output then you create inflation…PERIOD
We also know that interest rate hikes have a 6-12 month lag, but we can already tell that the real estate and mortgage market have taken a beating as US 30 Yr mortgage rates this week hit another high at 6.02%, the highest in 14 years!
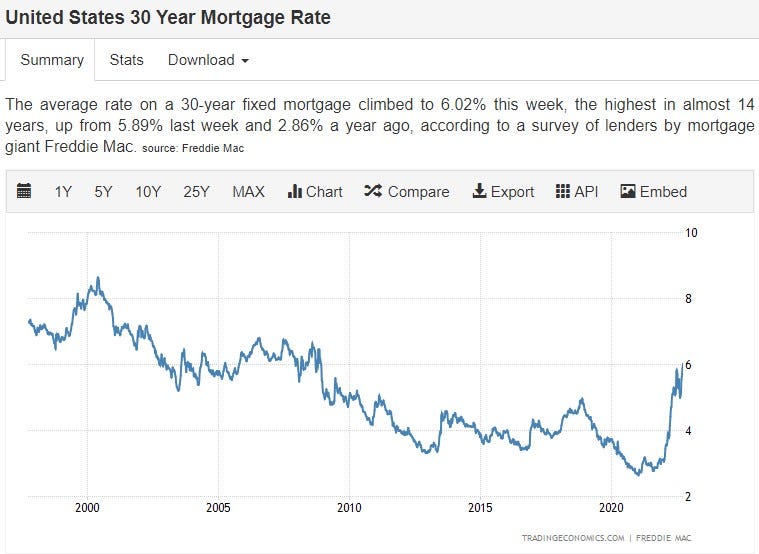
We expect the mortgage market to take a reprieve after this weeks rate hike as the Federal Reserve has no real intention of hitting their $95bln a month in USTs and MBS roll off as Balance Sheet reduction is more talk then anything else. They will be lucky to hit $50bln a month as Econemotions readers know, its the balance sheet that is the key. It is the base money that all things are levered with, including Real Estate and Equities. In fact we have been trying to calculate this phenomenon in hopes of gauging just exactly how much pain we have in store for the foreseeable future. This next chart summarizes the relationship between Equity market capitalization, Federal Reserve Balance Sheet Assets and we apply an average “Factor” to hypothesize where the SP500 may be at the end of 2023:
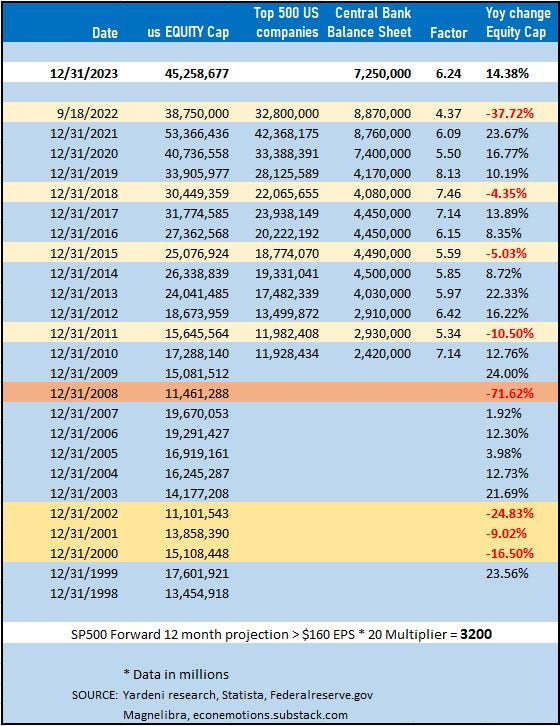
Based upon the factor method and a Federal Reserve Balance sheet around $7.25T from current levels today, would put the SP500 at 4400. This is the equivalent of a 22.5 multiplier with earnings of $195. This is highly optimistic, our more realistic analysis suggests a $160 Earnings Per Share with a $20 multiplier which is a 3200 SP500 marker, some 16.8% lower than current prices. This to us is a more plausible scenario given the 6/12 month horizon and current economic backdrop.
We have a hard time believing that nobody can fathom a 1999 to 2010 scenario by which it took 11 years for the equity market cap to get near its prior peak. Can 2021 to 2032 face a similar fate???
The Federal Reserves balance sheet basically doubled in that time from $500B to $1T and if you look now with an $8.9T starting point, we do not see us hitting $18T in the next decade…why?
Because the monetary base has already hijacked decades of future earnings. Not only have we kicked the can down the road, we have kicked it right off the damn cliff and purchasing power is dropping right with it. This is classic Milton Friedman,
“INFLATION IS ALWAYS AND EVERYWHERE A MONETARY PHENOMENON, A RESULT OF TOO MUCH MONEY AND A MORE RAPID INCREASE IN THE QUANTITY OF MONEY THAN AN OUTPUT. MOREOVER INFLATION IS MADE IN WASHINGTON DC AND NOWHERE ELSE”
A great lecture can be found here, a must watch for all our disciples that want to understand exactly what we are living through, Milton Friedman on Inflation
That last part of the statement couldn’t be more true and the inflation we see today is a direct result of political and monetary action on the back of the US Treasury and the Federal Reserve. Our chart above should clearly cement the evidence into your minds as you see the Federal Reserve Balance sheet expanded from $2.4T in 2010 to $9T this year, an increase of 375%!
The real question is who really benefits from this expansion in assets and asset prices?
I think its pretty evident now that the “mirage” of wealth as we call it, the “unrealized” economic gain is built on an increase in DEBT MONEY! We use the term mirage because paper gains are just that, a mirage, until you actually sell it and monetize it.
Who is wealthier the person who has a million dollar home with a $500k mortgage or the guy with no mortgage and $500k in cash? Both have assets whose net worth is $500k but in reality only one has actual tangible utility…meaning free to move and purchase at will in the amount of $500k. The guy with the $500k in equity is just theoretical, house prices can fall, it takes time to sell if necessary and its always why CASH IS KING! Which also why they want to remove cash from our system…You can’t control its utility…
Alright enough of the lecture let’s get to the technical charts:
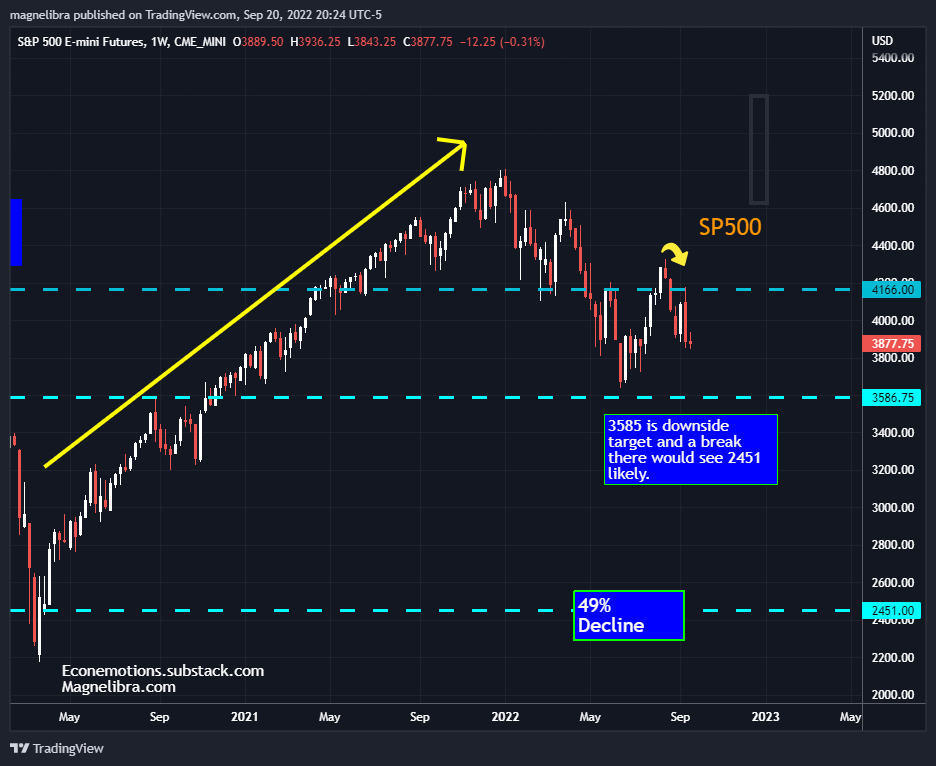
We believe any rally off of FOMC will be sold into as the yield curve inversion is a killer for levered players and thus we would suspect a move toward 3585 in the SP500.
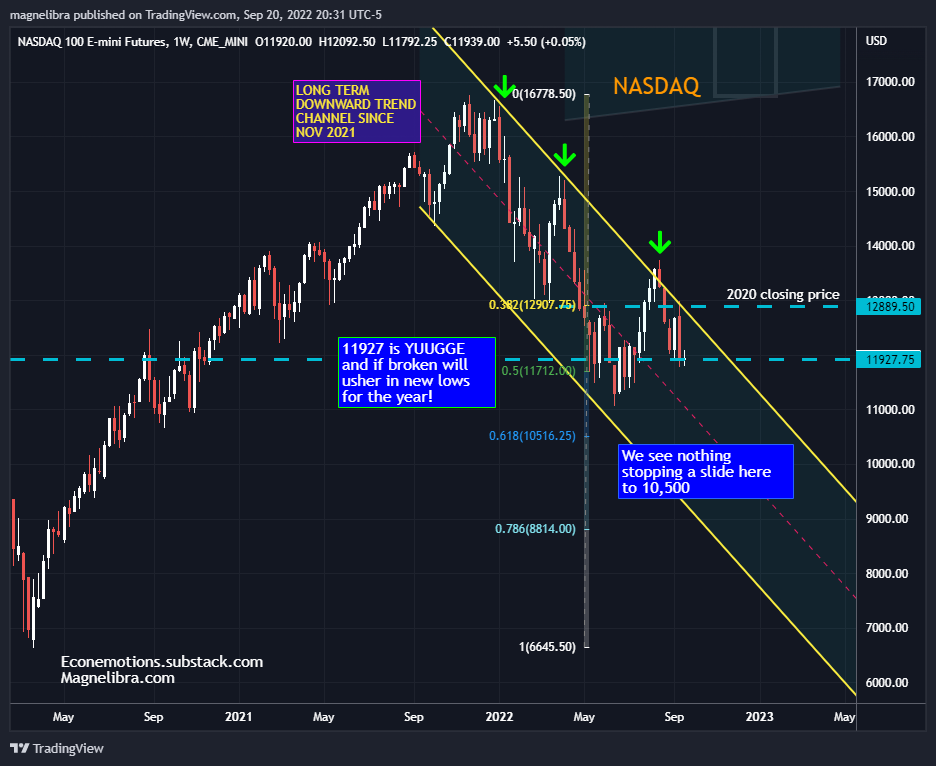
The Nasdaq futures look worse 11900 is huge and this time, the selloff will break free below there with 10,500 the next target or some 11.7% below:
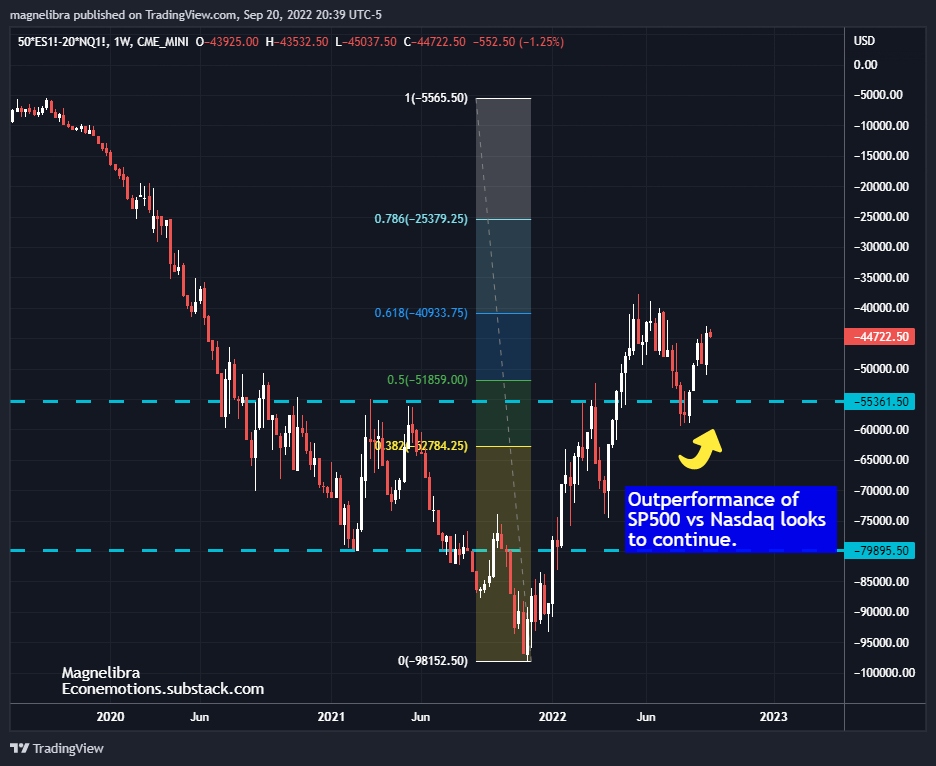
This setup seems confirmed as well by the SPvsNQ spread chart where the SP continues to outperform it:
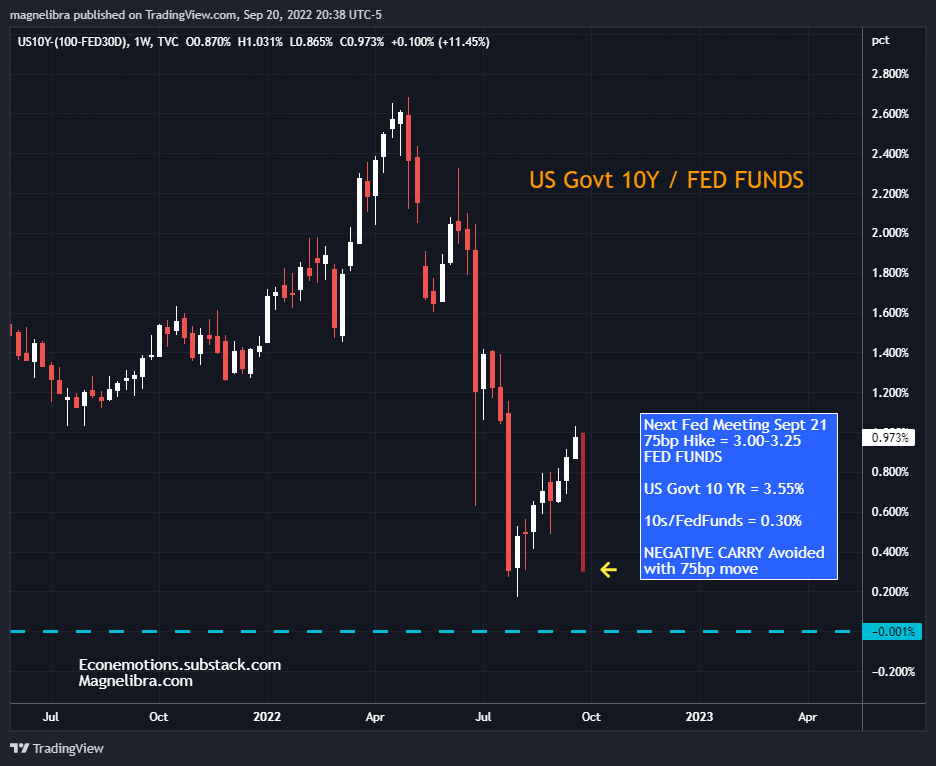
Finally many of our readers know we have been waiting for confirmation of the debt super cycle to end which will come when the Fed Funds rate climbs above the US Govt 10 Year rate, ushering in negative carry. Well the jump in 10 yr yields over the last few weeks and the 75bp expected hike, has prolonged this event, well till the next FOMC meeting that is. Anyway this is how the chart will look after tomorrows decision:
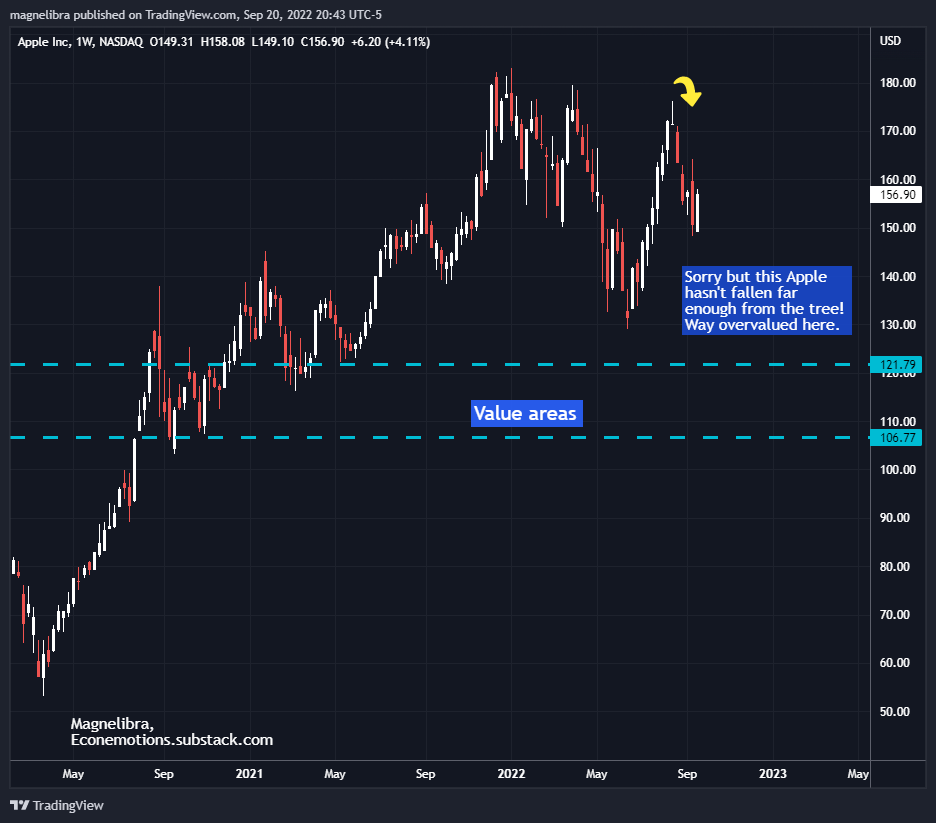
Finally we leave with the Apple Inc. chart…$150 puts seem logical:
Till next time…
DISCLAIMER: For educational purposes only. This is not a solicitation to buy or sell commodity futures or options. The risk of trading securities, futures and options can be substantial and is not for everyone. Such investments may not be appropriate for the recipient. The valuation of futures and options may fluctuate, and, as a result, clients may lose more than their original investment. Nothing contained in this message may be construed as an express or an implied promise, guarantee or implication by, of, or from the author Michael Agne owner of Magnelibra Capital Advisors. Magnelibra the CTA and its Global Futures Benchmark Program may hold long and or short positions in the various futures and markets that Econemotions covers. We will never claim that you will profit or that losses can or will be limited in any manner whatsoever. Past performance is not necessarily indicative of future results. Although care has been taken to assure the accuracy, completeness and reliability of the information contained herein, we make no warranty, express or implied, or assume any legal liability or responsibility for the accuracy, completeness, reliability or usefulness of any information, product, service or process disclosed.
ALL RIGHTS RESERVED 2022