

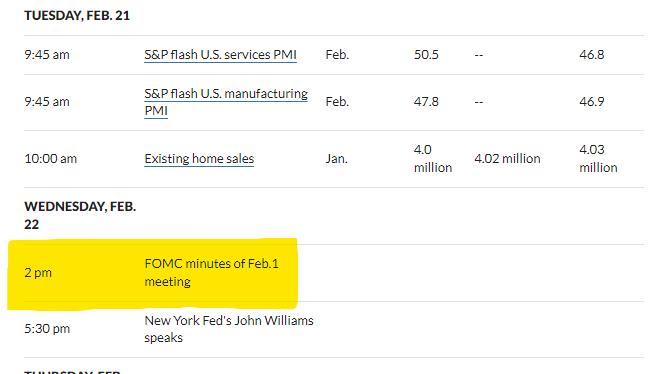
The US Equity markets continue to trade defensively as the reality of “higher for longer” in regards to interest rates is starting to settle in. Yesterday’s economic numbers on the inflation front didn’t help things as S&P flash services PMI came in well above the prior month at 50.5 vs 46.8 last month as did manufacturing 47.8 vs 46.9. However existing home sales disappointed and we find ourselves in this battle between higher for longer and what we feel is going to be a very hard landing. As far as today’s highlights, obviously the FOMC minutes will be in play as they are released at 2PM Est. We suspect we will see a few voting members that wanted to go 50bp as opposed to the 25bp hike that was done.
We decided to do a deep dive into the FOMC and their ability to sustain a 2% inflation target and we wanted to present our findings. What we have come to notice over the last 2 decades or so is that the FOMC has never on a YoY basis actually achieved this target.
Rather they have consistently and on an annualized basis targeted a rate more akin to 2.92%. This means that the FOMC has actually and consistently fostered an inflation target that is 46% higher than their target! No wonder everything get’s more expensive right?
Even worse, during our deep dive, we found that on an annualized basis, the Federal Reserve has increased their balance sheet (assets) by 12.14%. This is truly a staggering number and we would like to know exactly why and to what benefit this is done?
Now you really know how they keep certain rentiers in power. How can you compete in a free market when your central bank continues to shrink the pool of power via brute force by allowing for the acute concentration of wealth via this mechanism? We would love any sensible reporter out there to show this chart to Jerome Powell then ask, why is it you need to increase assets by 12% YoY? What objective is this serving in relation to your dual mandate?
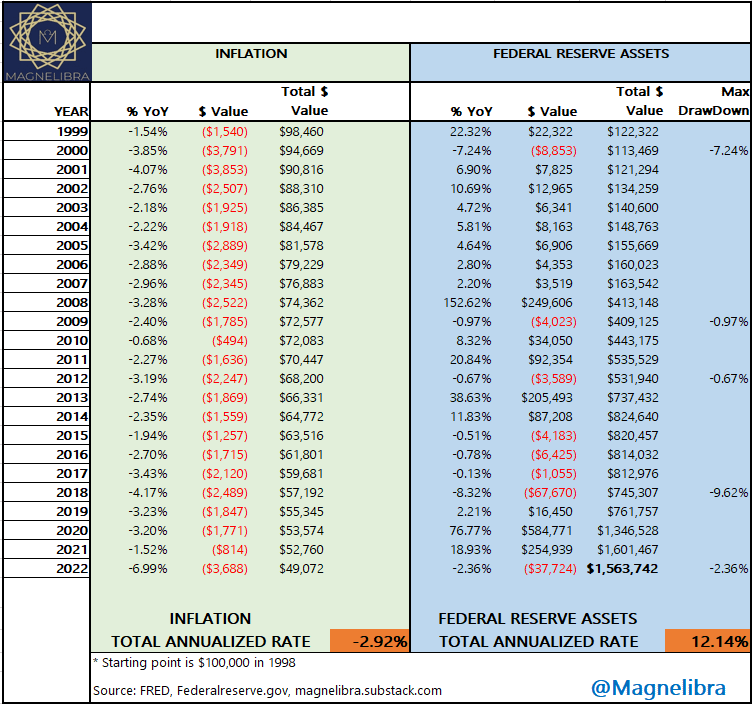
We feel data is truly the key to understanding and formulating accurate assumptions as to the future. You need to manipulate the data in a comprehensive and cohesive manner in order to create a visualization that makes sense, and we feel that prior chart not only does that, but it also scares the hell out of us, why?
Because in a world by which future return expectation relies on inflation being 2% or less, in a future that relies on robust economic growth, a 12% YoY printing press is not the kind of environment that fosters stable, nor sustainable economic viability. In fact the more time moves forward, the more many will begin to realize you can’t print your way to prosperity!
Are you prepared for consecutive or maybe 3 years in a row of negative returns? Have you discounted your current risk/return profile using a 3% inflation rate? We doubt it.
OK, on to other data, yesterday saw the US Govt auction off $42B, 2 Year notes and the auction had a slight tail with the high yield coming in at 4.673 which was the highest yield for this maturity in over 15 years! What is interesting and what we believe is going to be a very hot topic in the coming year, is the ongoing massive cost structure in regards to the amount of INTEREST being incurred at these high rates relative to the massive debt levels the United States has. For a visual comparison to 15 years ago, which was the last time rates were this high, you can see that interest costs are some 3.6x the amount now.
This equates to a difference of over $867 Billion dollars!
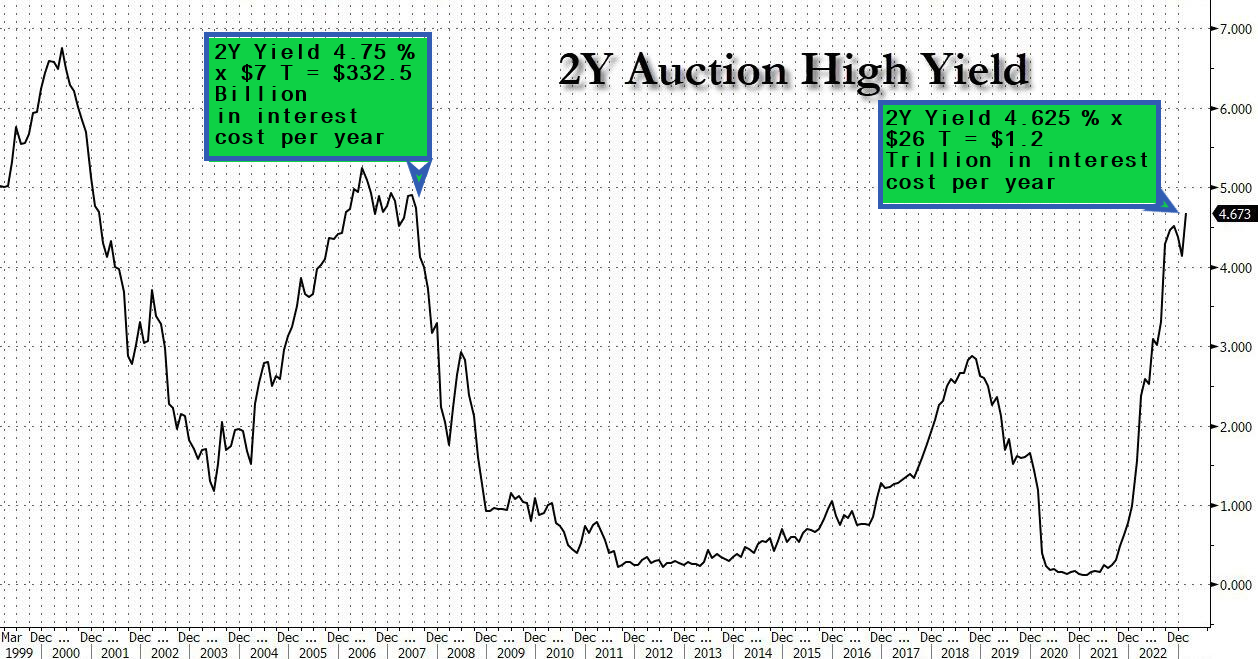
We know all of this interest comes at a major economic cost, it has too, don’t let anyone tell you otherwise. Look at it this way, if the US Govt is paying $1 Trillion dollars a year toward interest, then $1 Trillion dollars of utility is being diverted from improving let’s say our infrastructure, our society, our future all in the name of interest?
Yes this is a zero sum game and someone is gaining that interest and someone is incurring it, we get it, however this is why you are seeing a general increase in socialist constructs by the younger generation. They don’t like this idea of capitalist economic gaming in the name of free market capitalism, however what they do not know or understand is that this is not free market capitalism.
The system we have is more akin to a Technocractic Plutocracy. In a technocratic plutocracy, decision-making is often driven by the interests of the wealthy elite, who use their resources and influence to shape policy and maintain their hold on power. This form of government is often associated with high levels of inequality and lack of representation for marginalized groups, as decision-making is largely driven by the interests of the wealthy elite rather than the broader population.
Sound about right? Yea we thought so. Even worse is the strangle hold technology has put upon our younger generation. Shaping and molding minors minds unabated. When do we finally realize two very important things.
All of this technology like all other vices in the past will come with a warning label, we have often viewed EMF emitting devices as the cigarette companies of the 1940s, how long before the data proves this correct?
The fact that we do not have age restrictions on such powerful mind controlling devices is beyond us. The dangers that unregulated technologies such as TikTok, SnapChat, etc. pose toward our younger generation is incalculable.
Alright, well let’s move on to a couple of trading thoughts and technical analysis for the markets that we cover.
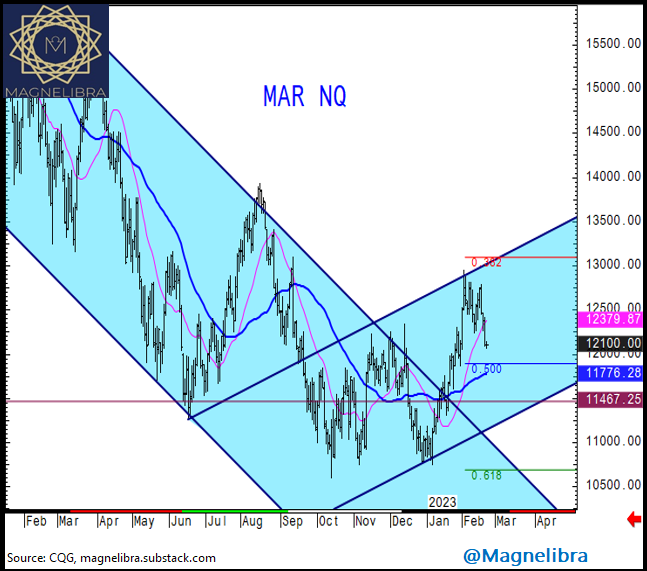
We know the higher for longer continues to weigh in both equity and bond markets and rightfully so. We discussed the possibility of many being caught offsides here and we have seen both markets come under attack as both bonds and equities have sold off. With that said let’s first look at the Equity Futures markets, starting with the Nasdaq. We can see the obvious rejection area up there at the longer term 0.382 retrace near 13k and now we look to be headed back toward the .50 fib area of 11776. What also stands out to us is for the greater part of the last year, we have pretty much stayed within the 0.382 and 0.618 fib ranges of 10750 to 13000:
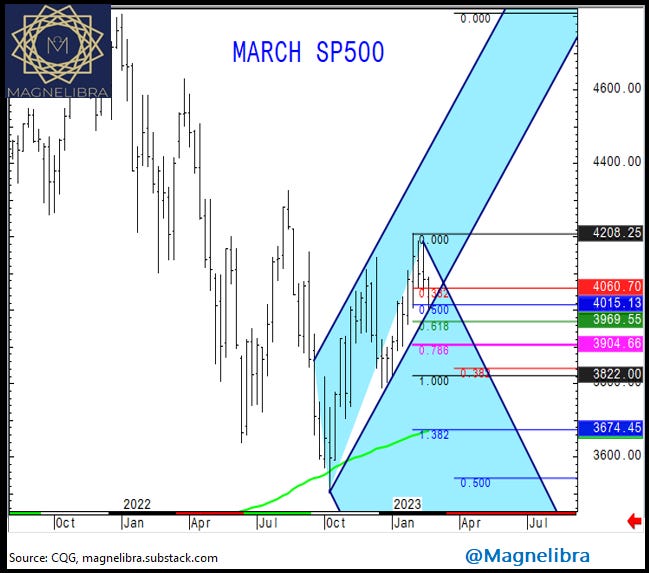
When we look at the SP500 futures we can see that the 5 month uptrend is being tested here near 4000. A close and break of this area should see a push to the 3969 then 3904 area, where longer term bulls need to hold or risk a full break down again toward 3674:
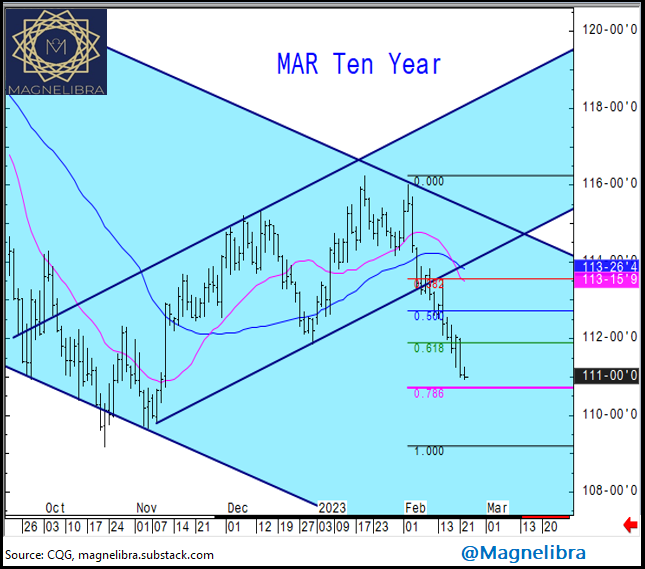
With the recent bout of yield rise in the US Govt treasuries, the Ten Year futures are now close to target/reversal support as prices have dipped below 111-00 and this level at 110-28 will be our line in the sand today, we would like to see a test and close above for confirmation of exhausted sellers. A close below will open up more downside, so today’s action will be of particular interest:
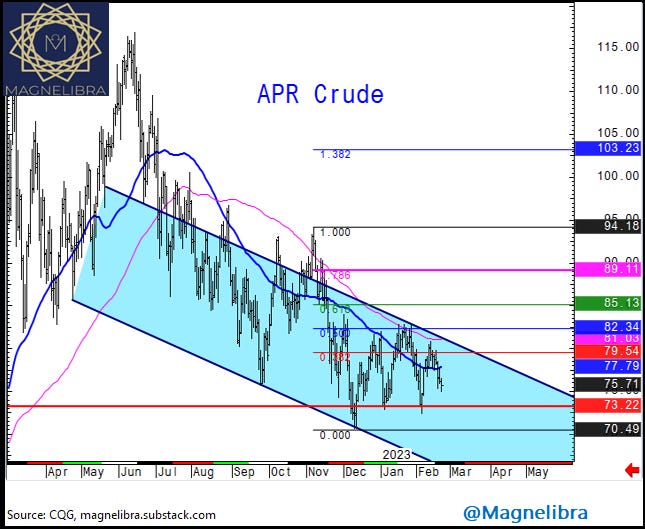
When we look at April Crude, we know the forces of an economic slowdown are butting heads with the prospects of a more prolonged war in Ukraine, so technically we aren’t going to make an opinion unless a breakout of the $73-$82 range is broken. However the downtrend in June is the larger time frame trend still:
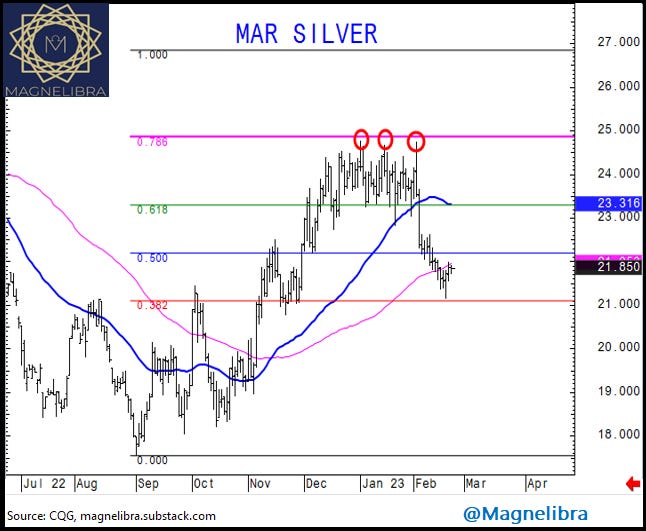
March Silver has bounced off the 0.382 and continues to hold above. This is a good sign here for continued support, and traders will most likely use that $21 as their stop sets for longs placed so keep an eye on that level:
Alright, stay vigilant, stay intuitive and continue to research and monitor whatever markets, interests that you may have. There is more to life than this game, so get out there and make it happen! As the great Michael Jordan once said:

Till next time…
DISCLAIMER: For educational purposes only. This is not a solicitation to buy or sell commodity futures or options. The risk of trading securities, futures and options can be substantial and is not for everyone. Such investments may not be appropriate for the recipient. The valuation of futures and options may fluctuate, and, as a result, clients may lose more than their original investment. Nothing contained in this message may be construed as an express or an implied promise, guarantee or implication by, of, or from the author Michael Agne owner of Magnelibra Capital Advisors. Magnelibra the CTA and its Global Futures Benchmark Program may hold long and or short positions in the various futures and markets that Econemotions covers. We will never claim that you will profit or that losses can or will be limited in any manner whatsoever. Past performance is not necessarily indicative of future results. Although care has been taken to assure the accuracy, completeness and reliability of the information contained herein, we make no warranty, express or implied, or assume any legal liability or responsibility for the accuracy, completeness, reliability or usefulness of any information, product, service or process disclosed.
ALL RIGHTS RESERVED 2023