


Good Evening, Magnelibra followers and welcome to another edition of the Magnelibra Markets Podcast. Today’s episode #49 is entitled “FOMC WEEK, AMD Reports Tomorrow”
Quick Disclaimer: The following podcast is for educational purposes only. This is not a solicitation to buy or sell commodity futures or options. The risk of trading securities, futures and options can be substantial and may not be appropriate for all listeners.
Before we get into the FOMC and a plethora of technical charts, with earnings season kicking into gear, let’s take a look at AMD. They report after the close tomorrow. AMD has already been trashed this year after reaching their highs up at $212 and currently sit right near their 2024 lows. So from their recent high to its current $140 price tag, this denotes a massive 34% drop. Here is a chart showing the price action this year:
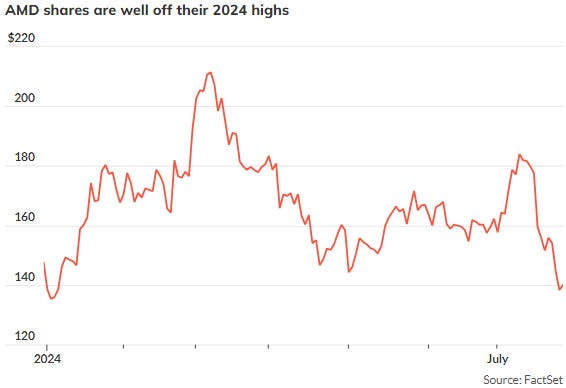
Analysts estimates- tracked by FactSet expect AMD to report 68 cents in adjusted earnings per share, up from 58 cents in the year-earlier quarter. The consensus view also calls for $5.72 billion in total revenue, up from $5.36 billion a year prior. (FactSet & MarketWatch)
However let’s keep things in perspective, AMD is down almost 5% YTD after that big up move, but being down slightly vs looking at AMD down 34% from the highs, offers two very different perspectives. Yes its obvious it has sold off pretty hard, yet its up 24% over the last 12 months so obviously the AI mania has led to this stock holding up pretty well.
When we look at the 8/2 options ATM straddle we can see that the 140 strike pricing indicates a $12 move or 8.5%. Calls are heavily favored in the options land but there is some decent interest some 13k puts from 130/125/120 area. Market Makers probably would like to see this thing trade above $130 but a bad miss could send AMD down to fresh lows. This sell off from $212 seems particularly harsh, given the full tilt optimism in this sector, so we would not be surprised to see this stock dump hard. The only saving grace we feel would be a buy back announcement, putting cash to work in order to repurchase stock and boost the price that way.
Now you can look at all the potential trades within the companies that are reporting and use the ATM straddle as your proxy for viewing potential moves. By looking at the options we can develop a little better of an understanding of the consumer bias and sentiment. Earnings Whispers puts out a great graphic of upcoming earnings shown here:
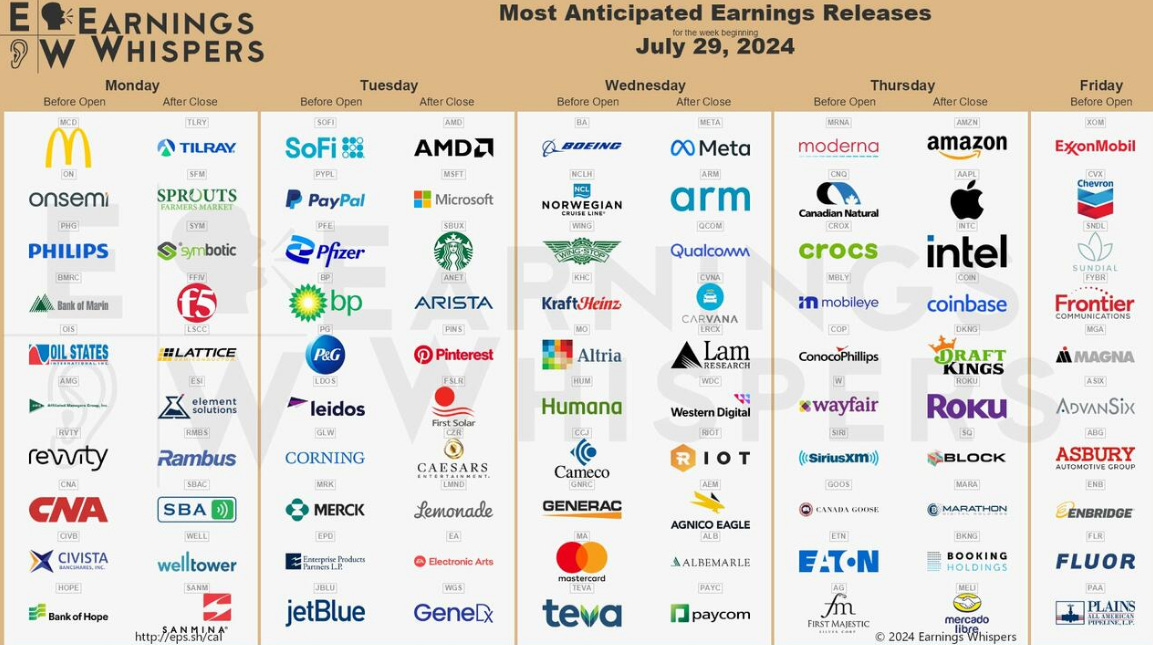
Alright, do your homework and see if you can spot any relative value trades within these upcoming earnings reports.
So we know that it is FOMC Week with the decision coming Wednesday afternoon, and its widely expected that the committee will keep interest rates steady and not opt for any cut at this time. We know that the data continues to point at inflation falling and the economy steadily putting the consumer in a precarious position. Without consumers home equity being a critical source of debt repayment via the cash out equity refinance, well let’s just say budgets will continue to strangle discretionary spending. So the FOMC will have its work cut out for itself.
We know we have seen a much larger inventory bulge of for sale and for rent homes and can only imagine the investor AirBnB free money types are rethinking their risk taking attributes right about now. Dare I mention the state of commercial real estate where we continue to see massive discounts being had all across the nation.
Remember we have the BOJ and BOE as well, not to mention non farm payrolls on Friday!
Alright, let’s get into some of the technical charts of the markets we like to follow. We are continuing to update our data base and will have the regular data back on our site shortly.
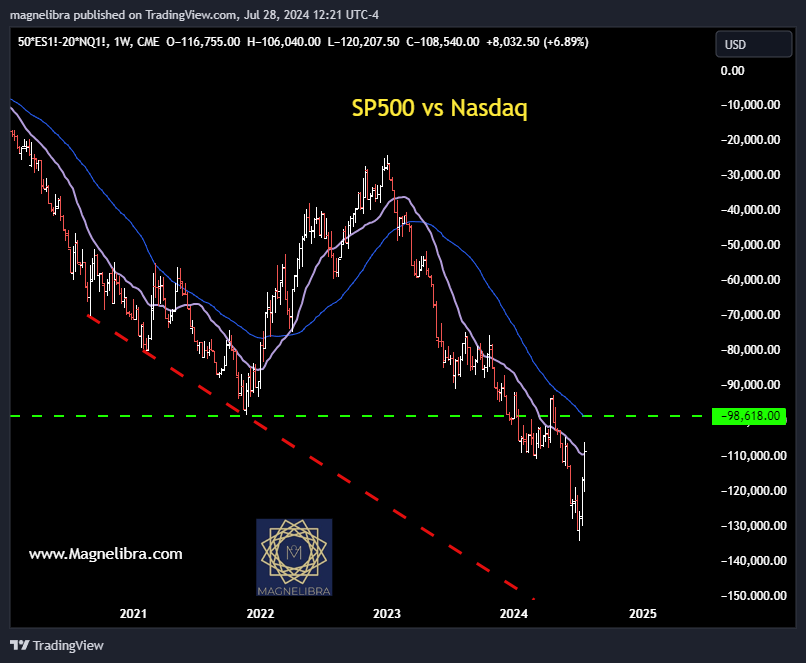
First chart we want to look at is the SP500 futures vs the Nasdaq futures. Obviously the Nasdaq has been the leader for quite some time, however now we are starting to see a reversal of this very large one way trade. One thing to keep in mind is this, when you have the big 3 who control most of the shares outstanding, you simply just don’t sell or buy all at once. You move stock over the course of time and in variable patterns so as to not set off the predatory algos looking for your flows. So with this in mind, and when I look at spread charts like this and the recent move, well, it would not shock me to see this thing completely take back the entire year and a half outperformance of the Nasdaq:
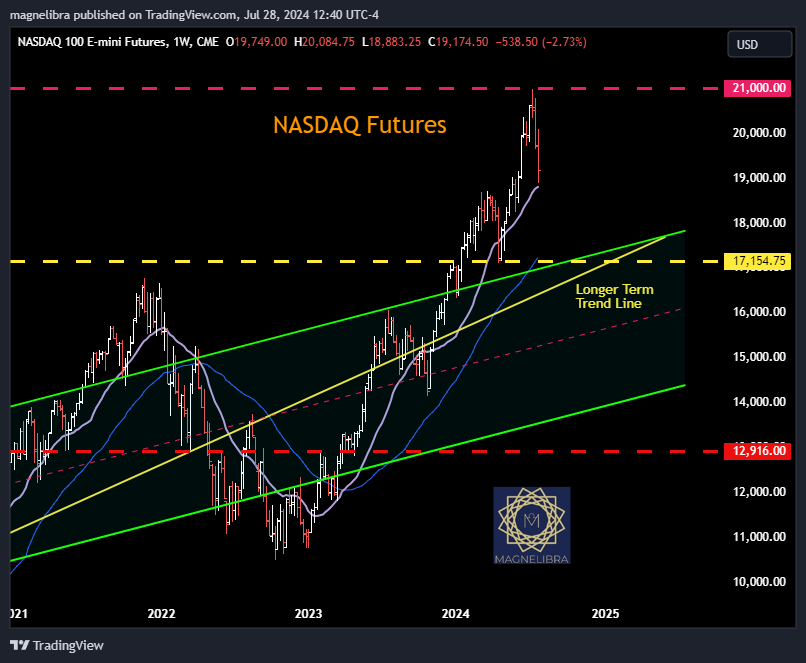
The Nasdaq futures have backed off in steadfast fashion from the 21k area and are now about to test some first real support. Honestly below 19k from our viewpoint should push this back down to test that 17100 area once again:
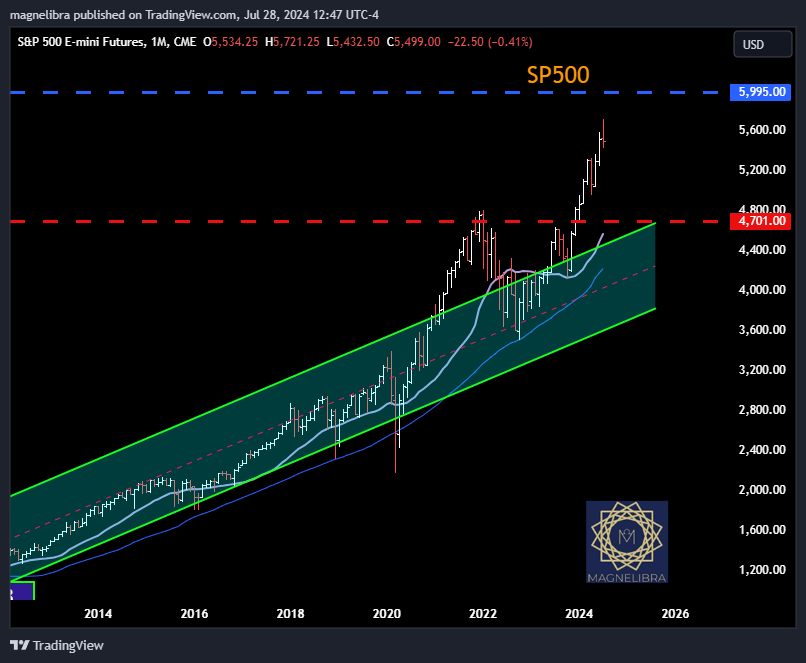
As far as the SP500 well it too looks as if a longer term top is trying to exert itself but we have seen this picture before in late 2023 and we know what happened since…however we are well long into the rate hike cycle and we are about to begin a new cycle and long time listeners and readers know that rate cuts are not good for equities at first:
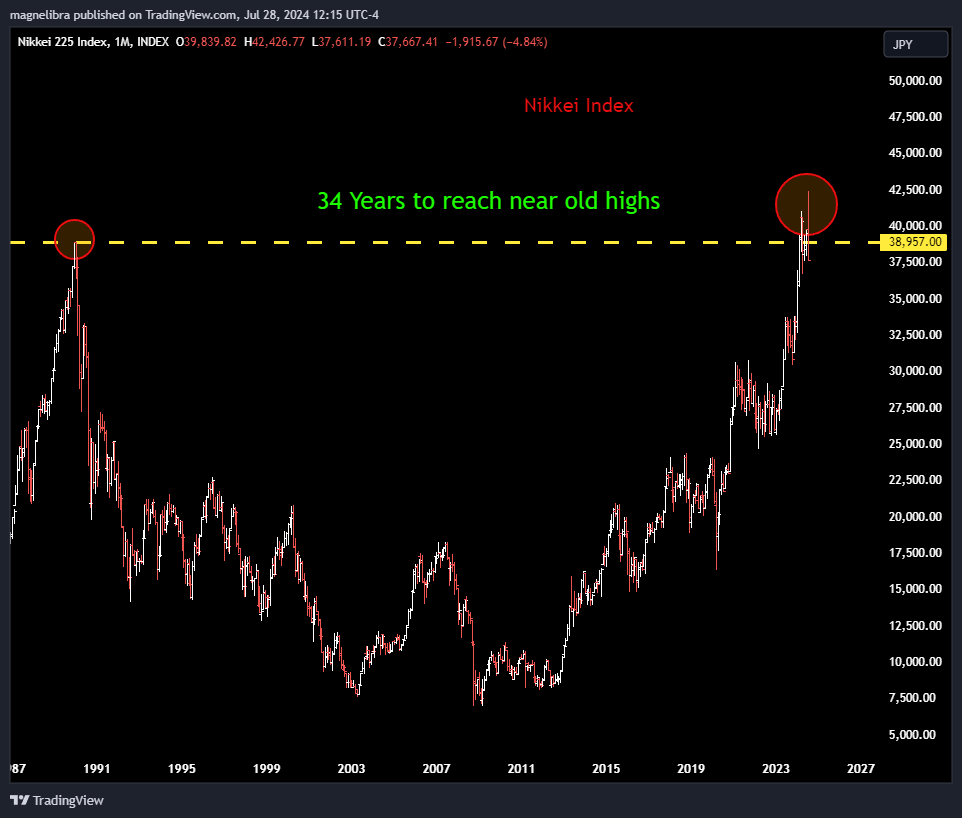
When we look at the Nikkei lets just say a weekly settlement below the 39k level will not be good technically nor historically as a rejection from this area would be very significant:
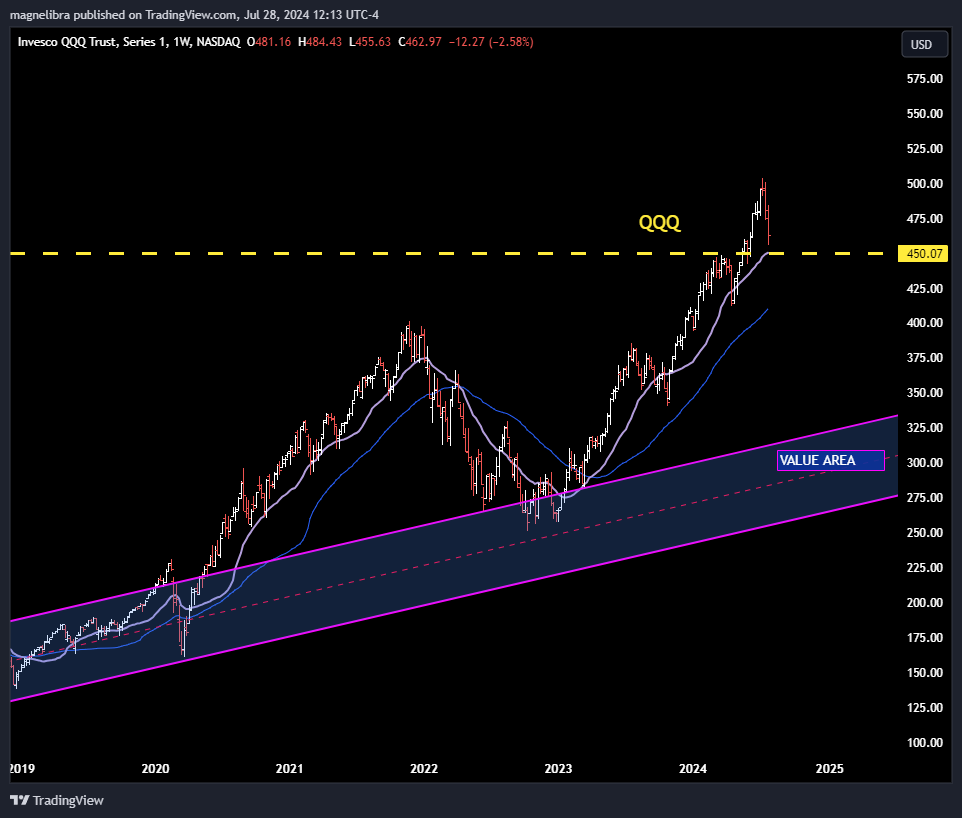
Also when we move from the futures to the QQQ ETF, the rejection from the 500 area is now pushing down toward the 450 level which would signify a 10% correction and we would think some mega funds would start to recognize the significance of this type of correction:
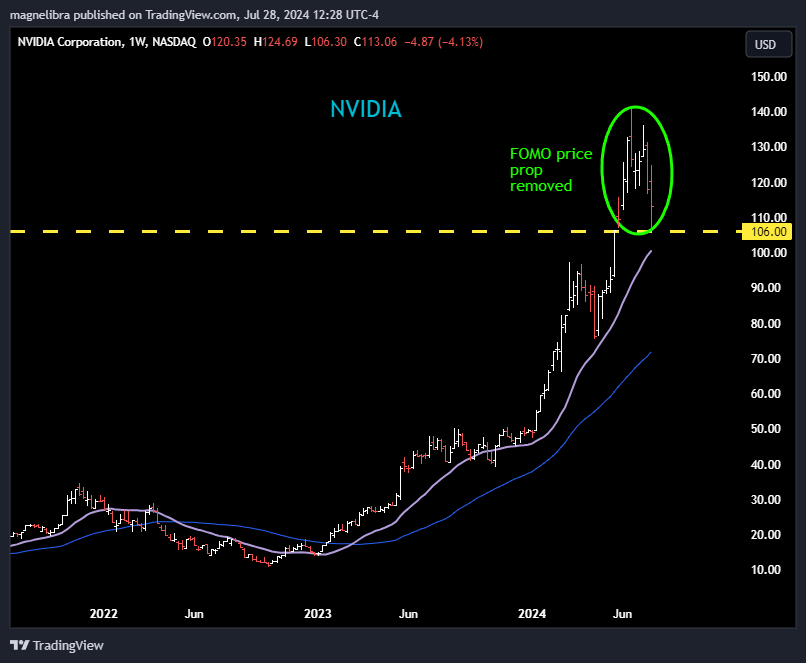
Let’s take a look at a few equity charts now, Nvidia has all but removed the stock split/AI mania pump over the last 2 months, a close below $106 is significant and we tend to think weak hands are and will continue to dump this here:
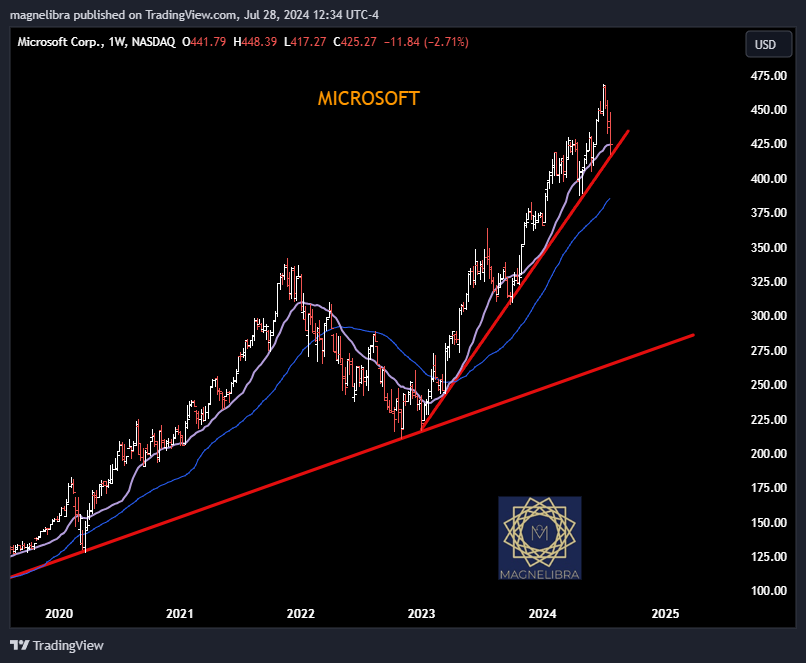
The stalwart Microsoft is now trading at a significant long term up trendline. The market seems to be exhibiting signs of exhaustion and when the stocks that have done the heavy lifting start to fall this means the large money alpha drivers are exiting stage left, this is significant:
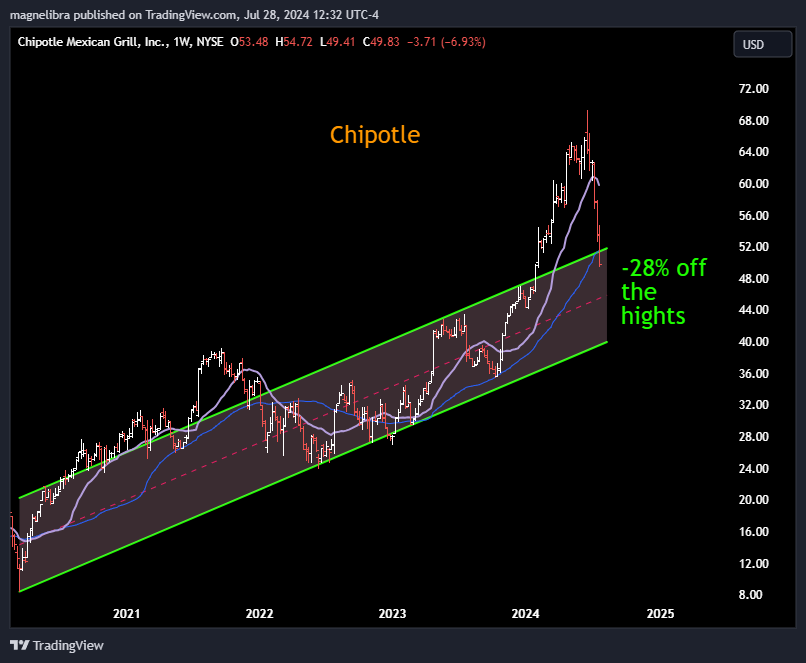
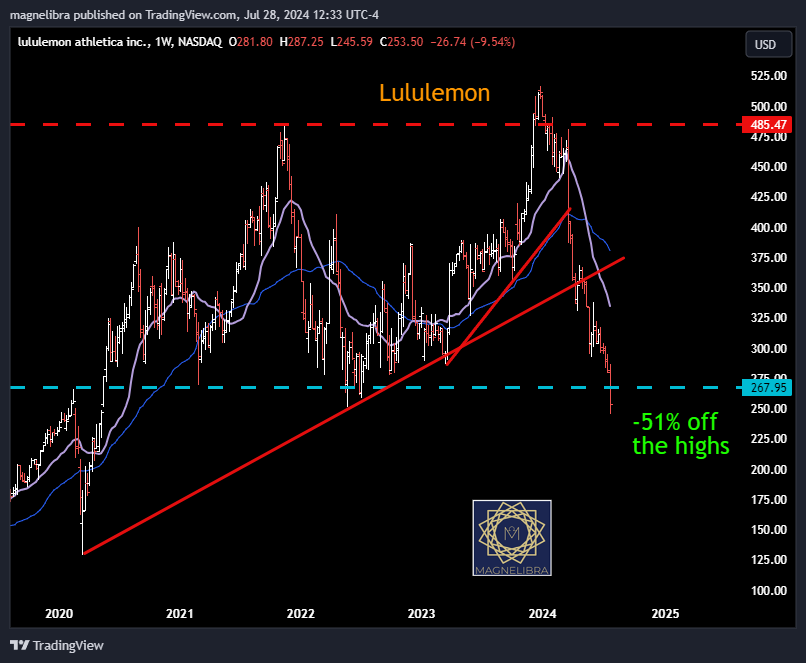
You guys know we love to look at Chipotle and Lululemon to gauge the health of the consumer base, well look at these charts, they should stand out to you as much as they do to us. As Chipotle is quietly down 28% and LULU down 51% off their highs:
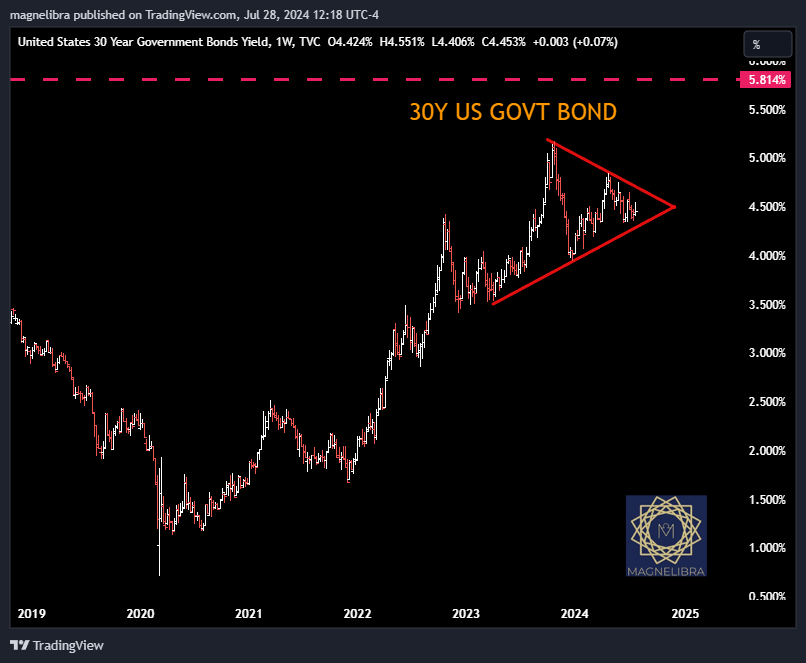
Alright let’s move over to the bond market which is also confirming this cycles rotation out of risk and into a more conservative based protection of profits mode. We will start with the 30Y government US bond where a massive triangle wedge pattern has emerged and we suspect the first rate cut will usher in the next massive convexity bid down in yields:
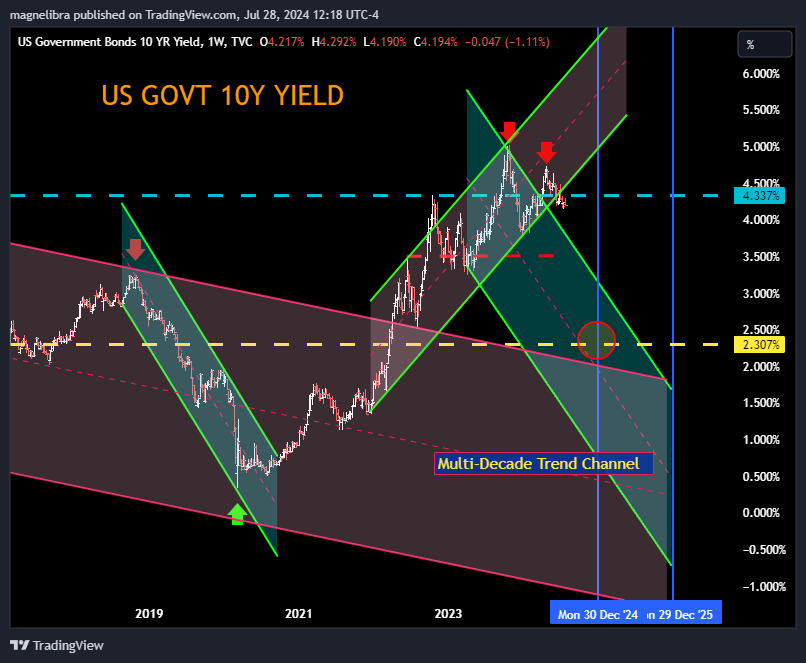
As far as the 10yr we will continue to show our expected path that we outlined in our 2024 Outlook and will we reach 2.3% by the end of this year? Well its doubtful but this is our next cycles target and we know once the mortgage hedgers come to play, 100bp drop in 10s will be swift and hard and full of volatility:
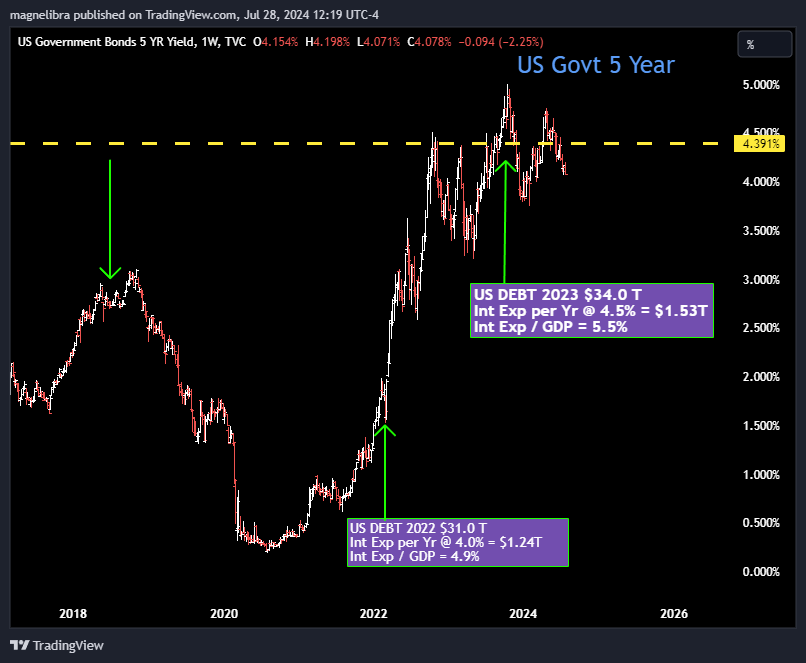
The US govt 5Y is 35bp below our topping formation line and confirms our bullish bias on short term US notes:
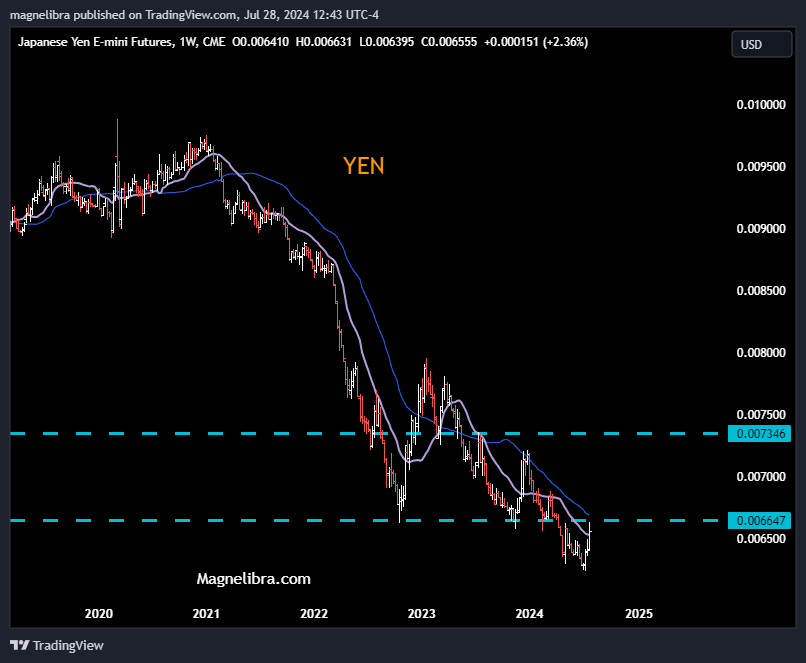
Now let’s move to some other futures markets, the YEN futures are bottoming out and this also confirms this cycles risk rotation as we suspect a weaker global equity market will see the Yen strengthen and this chart is definitely pointing toward that:
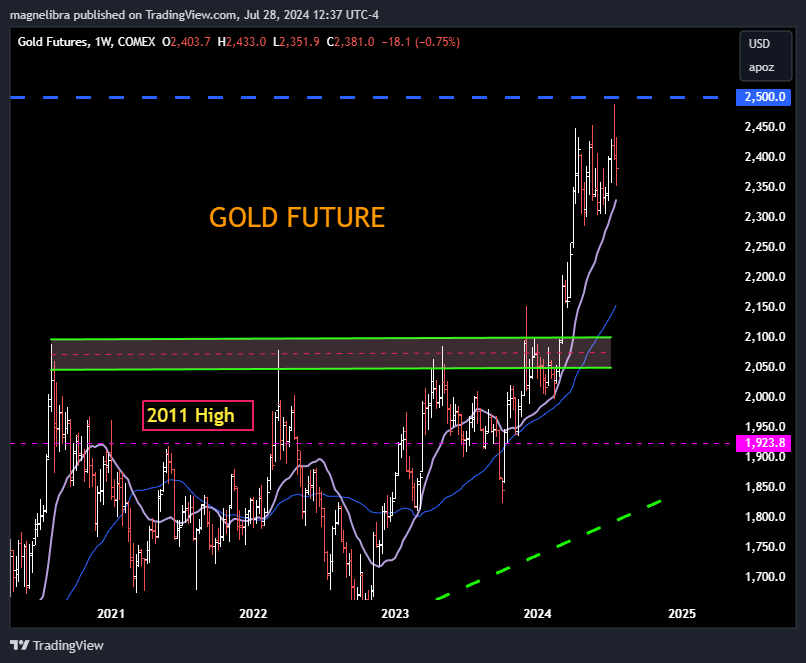
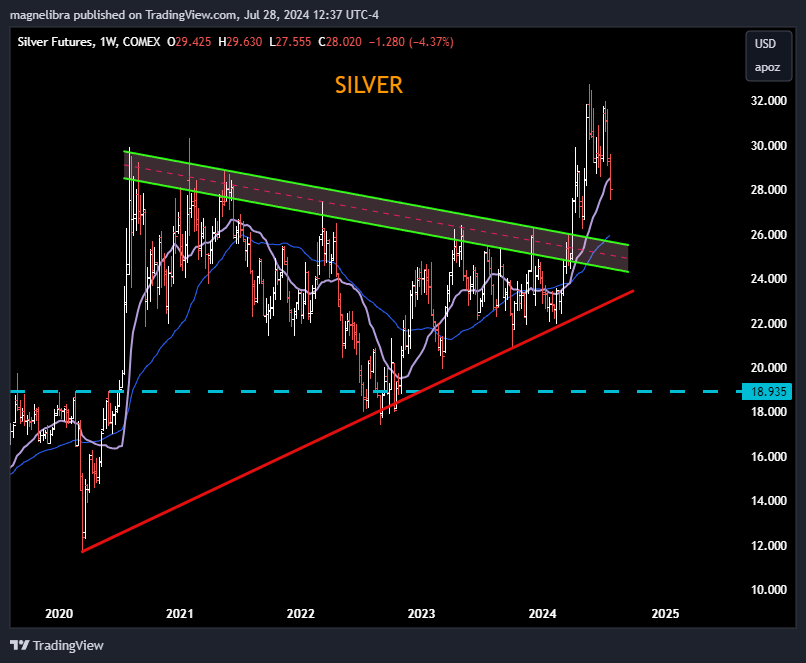
When we look at the metals, both gold and silver futures are also rolling over, Gold has held up a bit better than silver and above $2350 is positive, but a weekly close below would open the doors lower:
Silver is off 10% from the highs and has broken first real support via the 21 period VWMA and this is not a good thing, we suspect sellers will continue to sell any pops and ultimately a trade back into the prior upper value area band near $24 is in the offing:
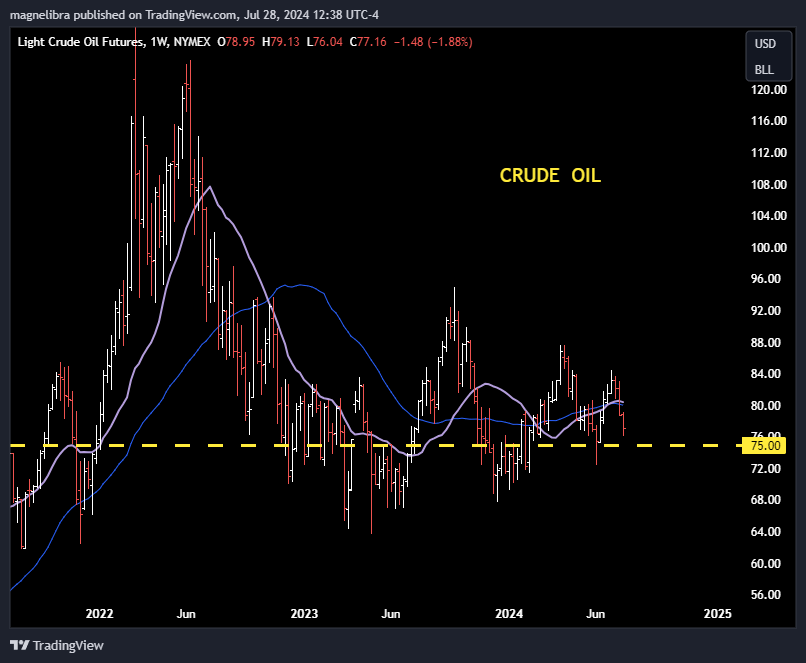
As far as Crude its pretty obvious that the $75 area is very important, its like the market knows its going to crater below there its just waiting for the right catalyst:
Alright this one is getting long but we wanted to share the Bitcoin chart. As long time readers and listeners know we have been massive proponents of Bitcoin and its hope for its ecosystem to continue to grow. However what we see now is starting to look more like a Big Wall Street, US govt sanctioned take over of it in co-opting fashion. You see our thoughts are simple, when too many especially in main stream start to push for massive in roads to Bitcoin accumulation by large funds, or by the US govt itself it always smells of co-opting of a movement. We do not agree with the full scale Wall Street adoption, especially the ETF type of adoption which is nothing more than a claim on Bitcoin and not individual ownership. So as much as we love the idea of Bitcoin and what it represents, the fact that so many are pushing for mainstream adoption yet we do not have a full Bitcoin Ecosystem, tells me that they are looking to use your capital to co-opt it and take it out of the reach of the general public.
This is not the real intent and no all the calls for the US govt to buy it up as a reserve and buy 2 million Bitcoin are farcical. They would never be able to accumulate that much and even if they did, what would they do with them? Are we too believe that the US population trusts Bitcoin so much now and we aren’t sure whats changed in a few years, but it seems that when the tide has tilted so much that there is a bigger agenda at work here.
Anyway here is the chart and no we do not recommend buying this at this price or any other price above $40k at this point and we are ultimately long term bullish, but being bullish and being foolish are well, too different things:
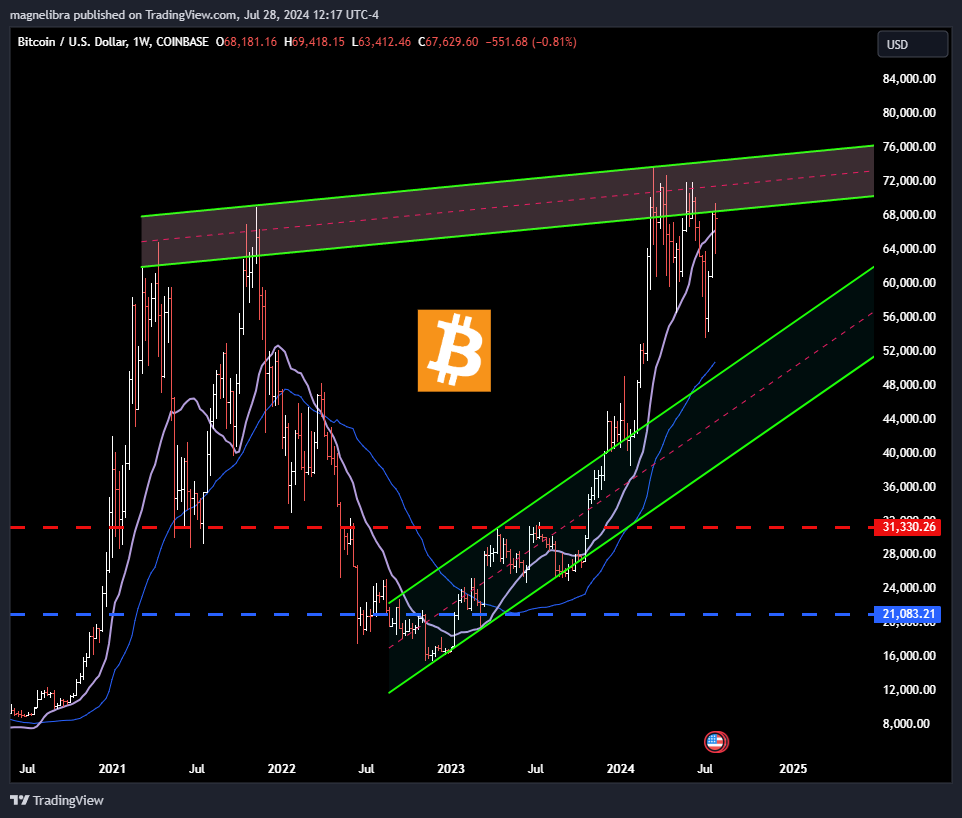
We ultimately believe Bitcoin will trade back to the $28k area once the rate cuts start to begin and we will stick to that call right now.
Alright, thank you for staying the course, Magnelibra has shut off the auto billing for its paying subscribers and will do so for the next month as well. We owe it to you guys for being pulled in a different direction over the last two months. We will continue to monitor these markets and we will continue to give you insight that we believe matters. All too often we feel like we get overwhelmed with the day to day and we lose sight of the bigger picture.
Yes we know rate cuts are coming, yes we know that all that Covid stim money has now been concentrated into mainly billionaire hands one way or another and no that money has not exited the system. Asset prices still benefit from that nominal levered game and remember despite the FOMC assets moving from $9T to $7.2T over the 2.5 years just remember in January of 2020 the FOMC assets were $4.2T, so we are still $3T above those levels or 71.4% more base money than 4 years ago and all earning a 5.25% risk free rate…when many can’t understand inflation, well its the FOMC assets and current interest rate that put it all into perspective. As the great Milton Friedman said,
“Inflation is created in one place and one place only, Washington DC”
This was true 45 years ago when he said and its still true to this day!
Alright till next time, hopefully our databases are cleaned and updated for our next post, we will do our best and we greatly appreciate all of you. For those active traders, look at the options of the companies earnings you are interested in and see which way they are tilting you, see if anything stands out. If it stands out put a measured, well calculated, well defined risk/reward bet out there and see how things shake out. Remember in trading and investing there are only 3 choices, Buy, Sell or do Nothing, it really is that simple.


