
JPM Earnings Not Impressed
Maybe 6% + rates are the new normal?

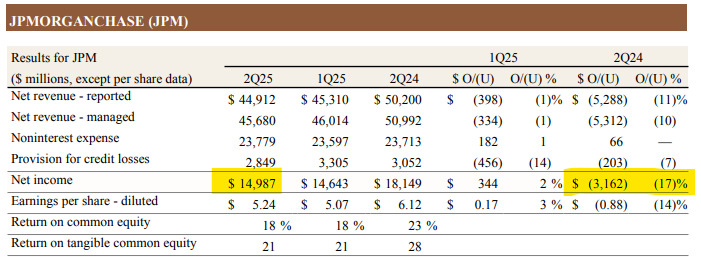
JPM, Citibank and Wells Fargo all posted results that came in better than expected, but we take that with a grain of salt. In regards to JPM, we would rather focus on the -17% YoY drop in their Net Income:
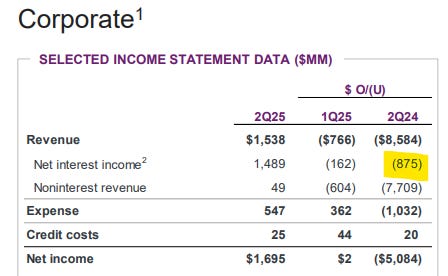
Even worse was their NII (Net Interest Income) falling $875m YoY which is a drop of 37%:
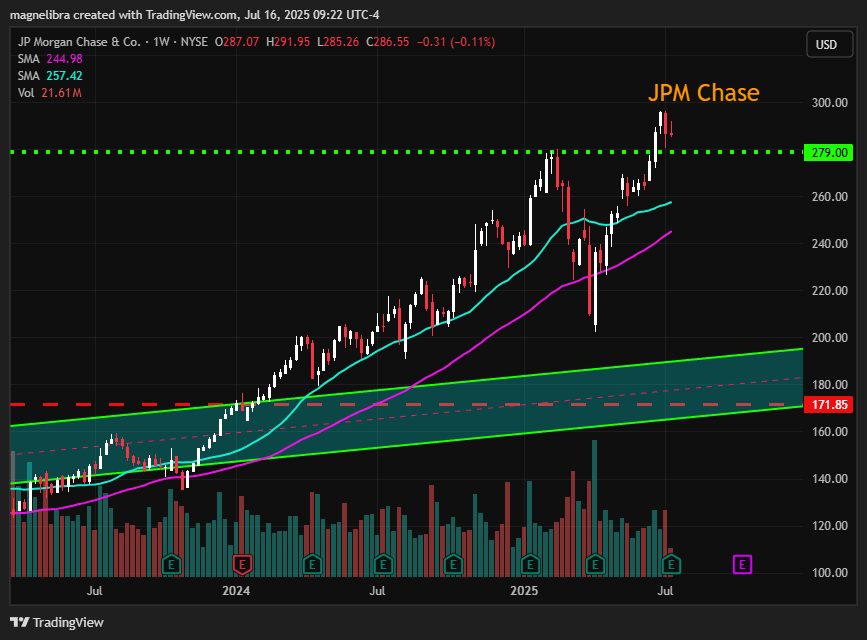
As far as the chart structure for JPM, the $279 is really the key, we didn’t get as much movement off earnings as we thought. Ultimately we would like to see $279 to hold for the bulls, but below brings continued selling with $250 the target and then ultimately you guys see the green long term value channel below:
We also had the CPI report which showed the core rate +0.1% to 2.9% YoY but below the 3.0% expected. We aren’t going to focus on these numbers as the trend in inflation is down and has flat lined. We really do not expect inflation to continue to fall until we get a reduction in overall aggregate demand stemming from increases in unemployment. We also know that a July cut is out of the question now and a September cut probability has been reduced to a coin toss.
We believe the FOMC has done a very good job at keeping rates exactly where they need to be. There was a time where we felt they would continue to operate as they always have, cut rates in succession till we get back to a much lower level. This has not been the case this time around and its why you see many calling for Jerome Powell’s removal. Honestly if I were the FOMC, I would resume cutting the balance sheet and allowing securities to roll off, to push Trump to a more fiscal US Govt spending position.
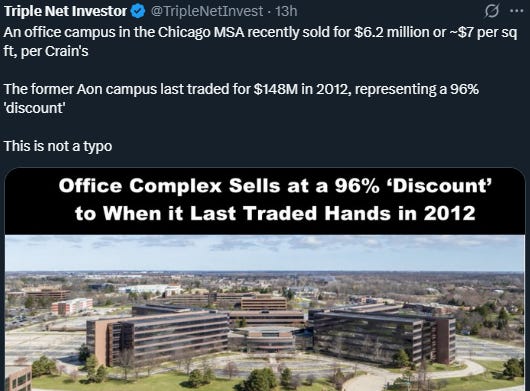
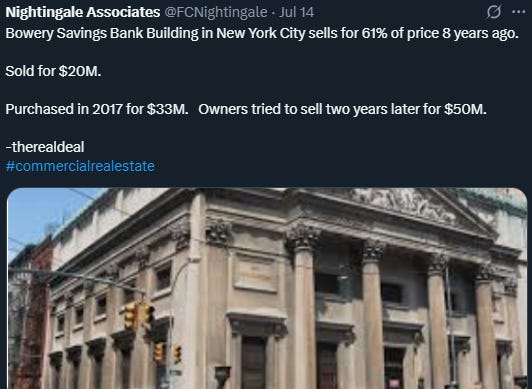
We also continue to see real estate prices tumble, especially on the commercial side, here are two recent examples:
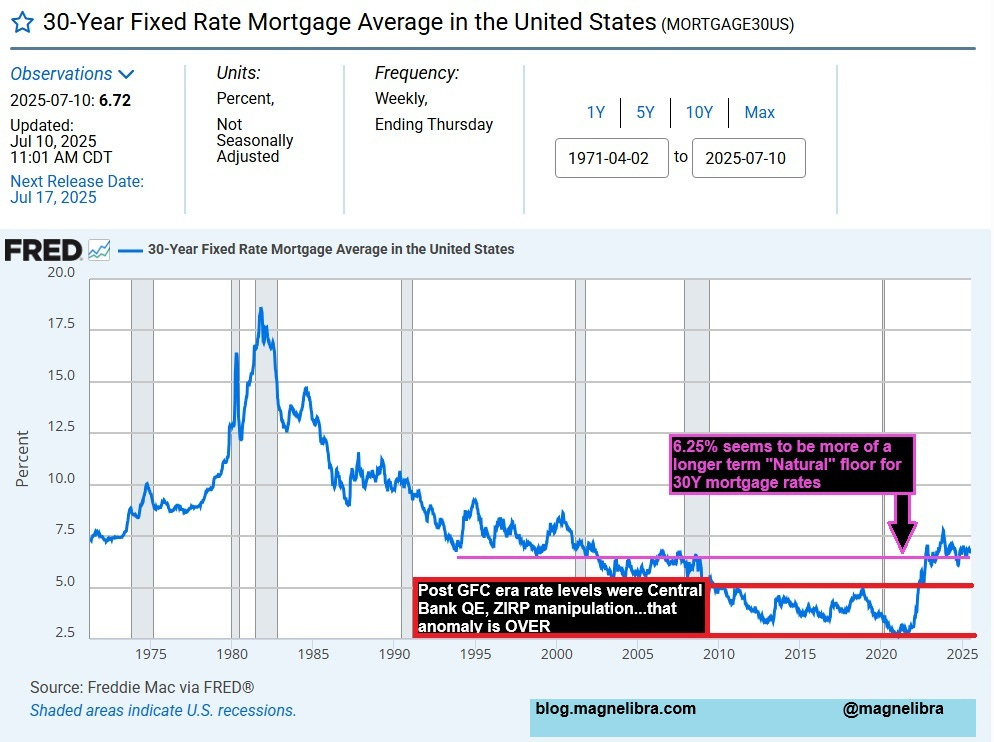
On the retail side of things, we continue to see people failing to truly be realistic about what their home might be worth when trying to sell. In fact many do not realize that given the near 7% 30Y fixed rate, your pool of buyers is reduced by 70%:
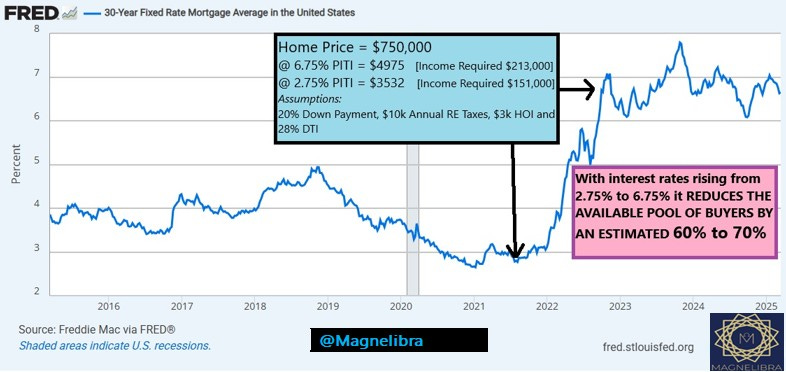
When you look at the chart above, one may believe “interest rates” are high. However let me pose this chart to you. We believer the last decade and a half was an anomaly and that people will slowly have to adjust to affording rates that are 6% and above. Think back if you were a mid 20 something in 1985 and were waiting to afford a home. By early 1990 rates were near 7% from 10%, you would think this was a great rate. So don’t let the nominal price of anything fool you, everything is relative to price and time. If rates are prone to stay elevated, rest assure that prices will have to fall to meet an expected optimal clearing price:
Alright, we have all the subscriber only data up next, however we are making this one a “full access.” We urge you to become a full subscriber and truly break through that barrier of understanding in regards to our global financial system and perhaps implement some of our trading trackers into your own investment profiles! If you are sick of stagnating, sick of losing then join the ranks of MTR Subscribers!
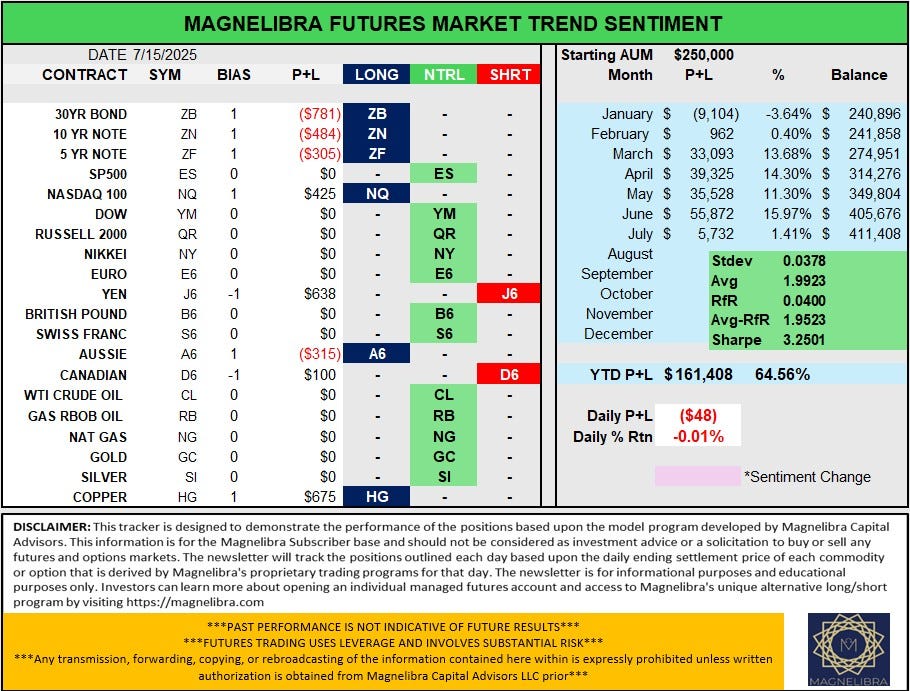
Magnelibra CTA Futures Market Trend Sentiment (Our proprietary commodity trading advisory futures market sentiment long/neutral/short market flows indicator) The portfolio is made up of the core futures markets we cover and the indicators are for single contracts of the futures market, whether long, short or zero neutral. The P+L is generated via the starting daily position and the ending daily settlement. This is considered a high risk alternative strategy. However most investors should leave a portion of their overall portfolio within a high risk basket. Some of the percentages of the overall portfolio dedicated to high risk should vary from 3% to 18% depending on ones overall time to invest and risk profiles. We added the Sharpe to our data now as well for those quantitative types!
Magnelibra Futures Market Trend Sentiment: NO changes:
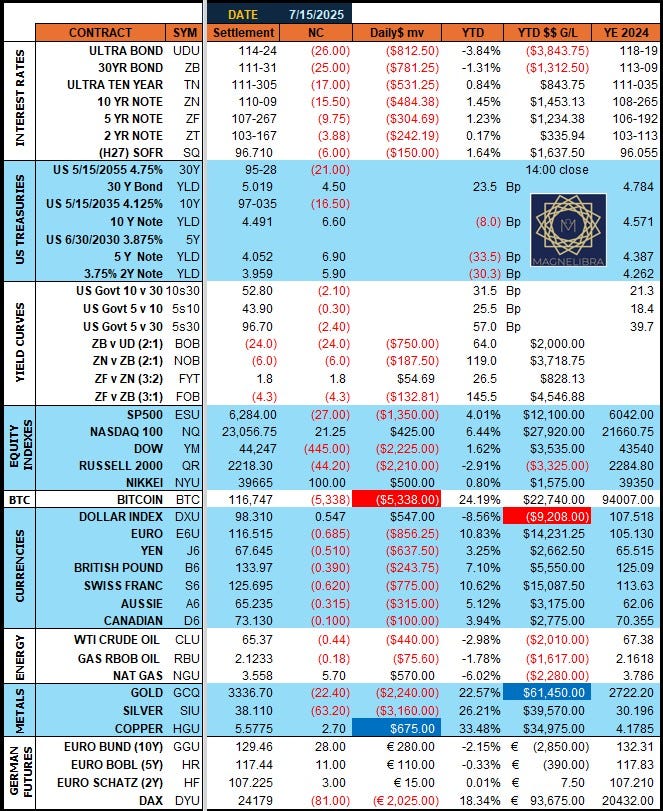
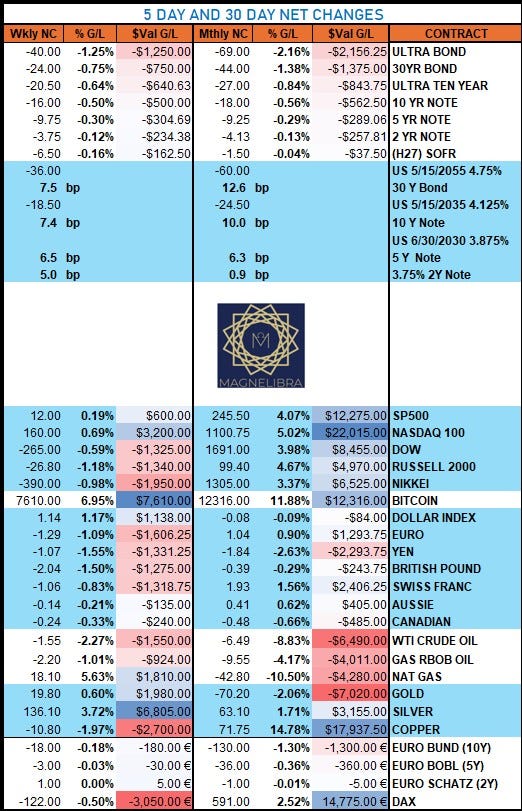
Daily Settlement Sheet (Magnelibra’s Futures and Cash bond market coverage of the daily settlement prices and dollar value of the contracts given move)
We are starting to see a lot of red across the board indicating risk was being pared:
The U.S. Bond Yield Curve (This is our daily graphic displaying the U.S. bond market yield curve changes. We follow the 2 year thru 30 year durations. Please note that bond prices work inversely to yield changes so for instance if bond prices are rising and moving upward, then their yields are falling or moving downward. We also track the relationship between the durations known as US YCurve Spreads, when we list it as 2s5, we are comparing the yield differential between the 2 year vs the 5 year with the positive/negative viewed from the higher durations perspective.
The 5s30 curve once again backs off the 100bp level and yields rose across the board in a bear flattening fashion for most of the curve with the front end staying a bit steeper (2s5 +1bp):
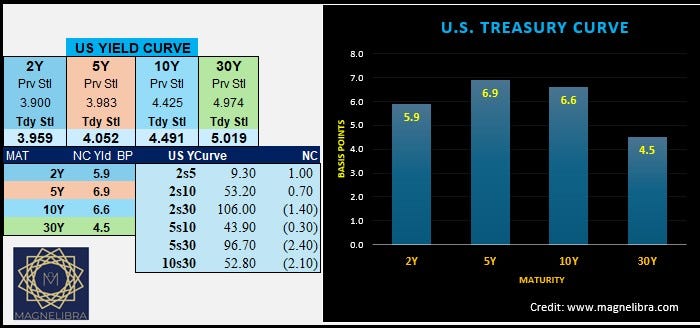
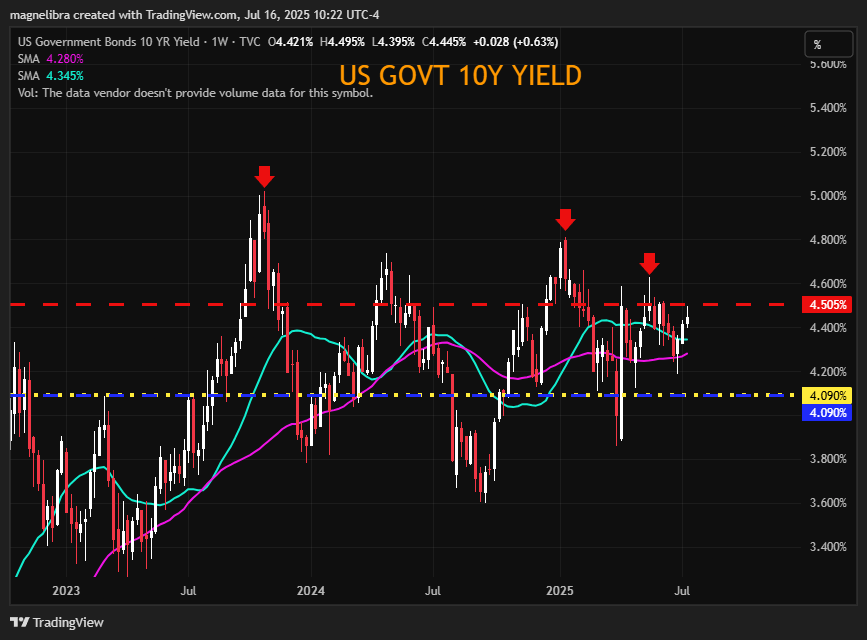
We will continue to watch the US Govt 10Y at the 4.50% level, its been pretty solid pivot above we risk a move to 4.70% and figure if this is rising equities may be topping out a bit:
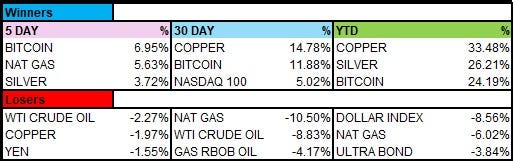
The 5 & 30 Day rolling changes with top 3 Winners and losers (The last 5 trading days and 22 trading days net changes)
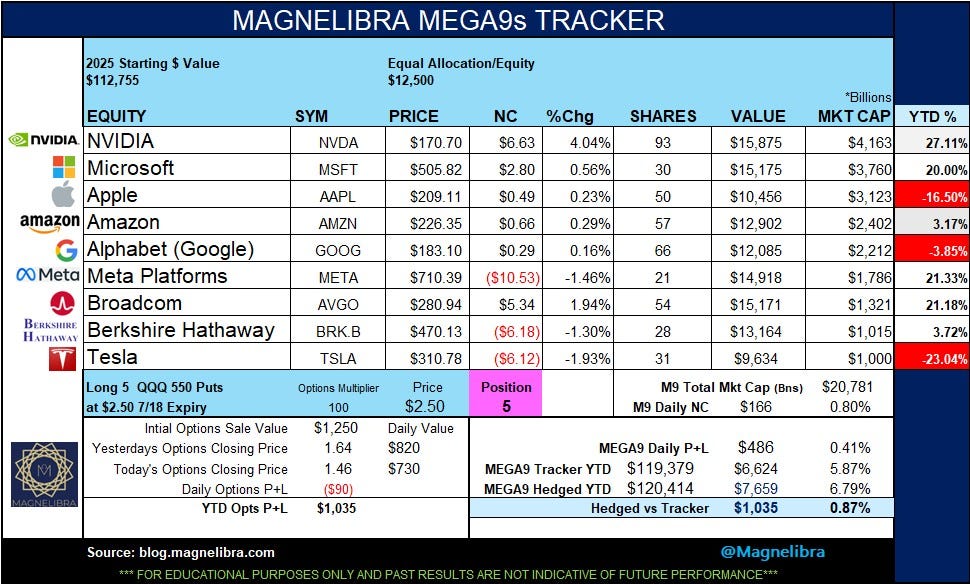
Magnelibra MEGA9s Portfolio Tracker (This is a synthetic long only portfolio of the Top 9 largest equities by market cap. We started this tracker because we understand Ai dominates the investment landscape and operates in a binary construct. What we mean is that it issues a buy or a sell and will do so in reinforcing mechanisms, meaning if alpha is rising it will add, if it is falling it well sell and remove. We also created a “hedge” for those that want a more active approach to tactically maximizing their long only static portfolio of equities)
The MEGA9s market cap gained $166Bn today. This weeks hedge is the long the QQQ 550 puts at $2.50:
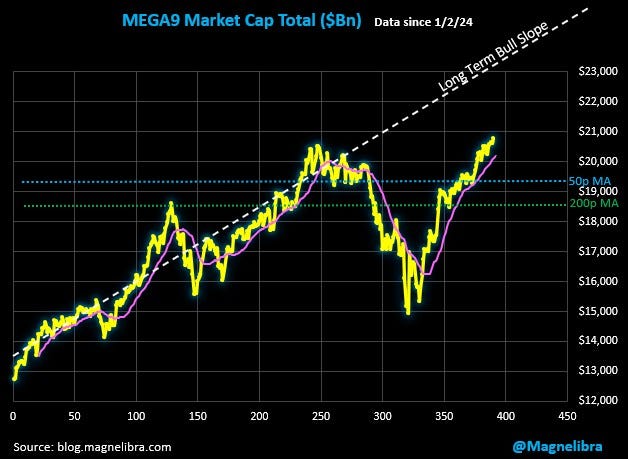
MEGA9s total market cap chart (This chart represents the total market cap of the MEGA9s and lists the 21pMA in pink along with the 50p and 200p MA)
StrategyB/ BTC Trading Tracker (Bitcoin vs MSTR equity, Our MicroStrategy Covered Call Portfolio Tracker, Long 100 shares MSTR and short 1, 4% to 10% out of the money call on Monday’s open each week)
This weeks hedge for the covered call strategy in MSTR is the 7/18 expiry $470 Call
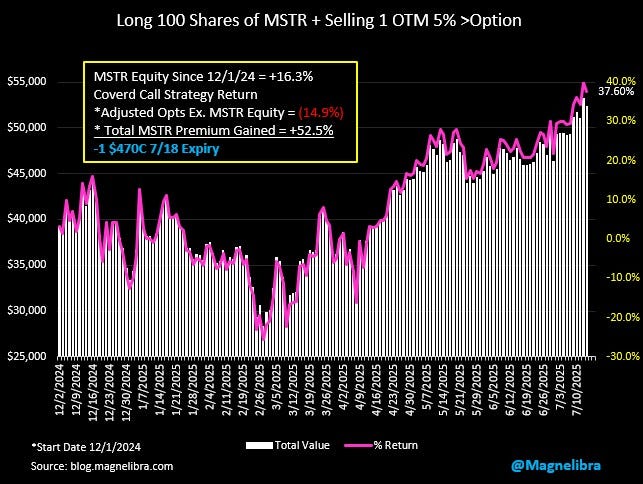
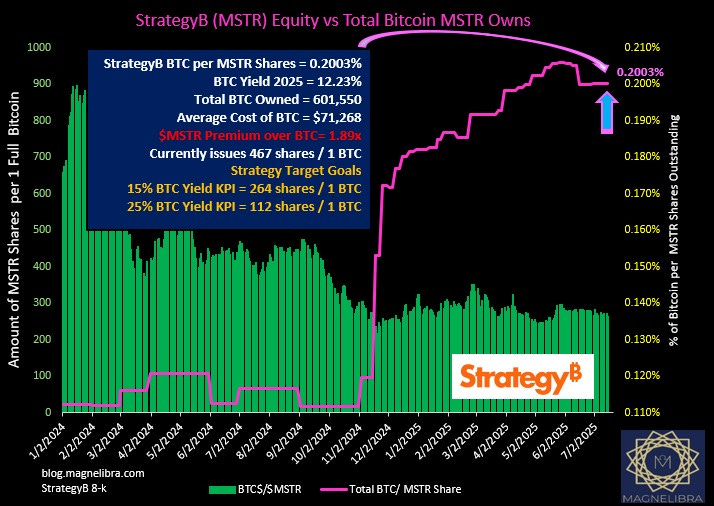
Strategy added more BTC yesterday and now have pushed their total BTC holdings to 601,550 and the MSTR premium over outright Bitcoin is 1.89x. Their dollar cost average is now $71,268. MSTR BTC Yield from our calculations is 12.23% well below their 15% target level. We have included the new metric goals of 15% and 25% BTC yield as with this recent issuance, the share per BTC jumped from 350 to 467:
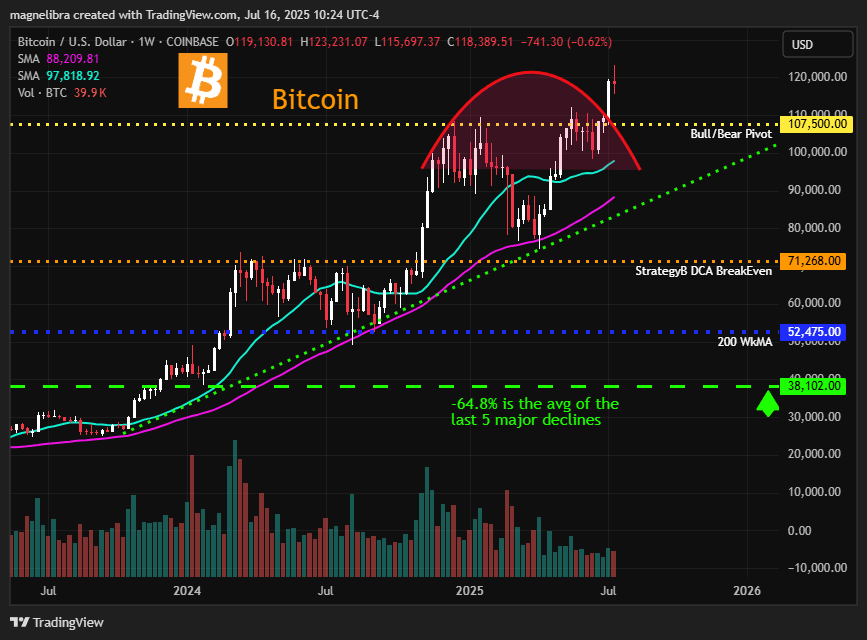
Let’s take a look at Bitcoin (BTC) and Monero (XMR). As far as Bitcoin, the breakout from the topping patter is clear, but this Doji star is concerning this week. A move back below $107,500 will put the major top back into play:
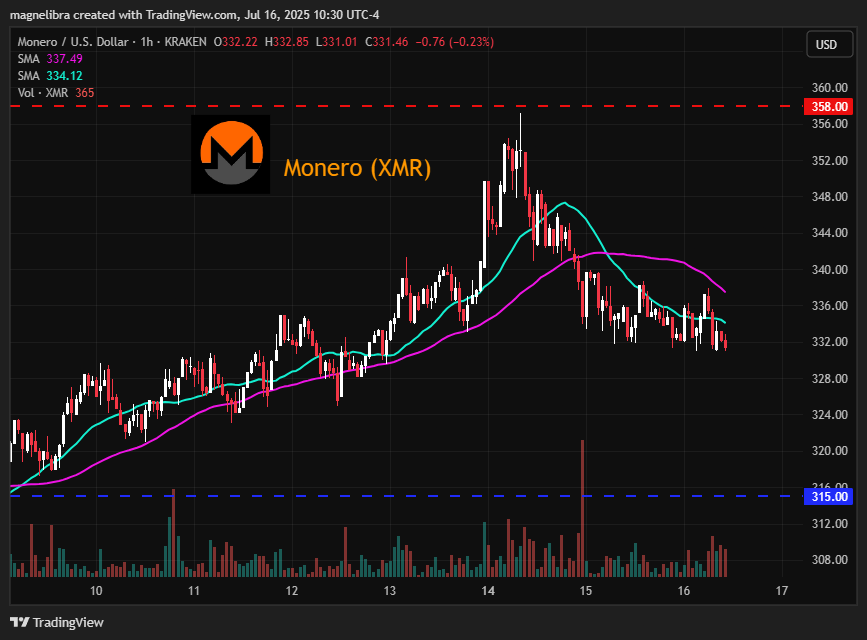
As far as XMR, we seem to be right in the middle of the range:
Ok guys that is it for today, please try to share our work, try to subscribe, if you see value and want to support us please see our BTC address below to use and our just outright subscribe. We know many cannot afford anything extra at this time due to inflation and costs, so please reach out via DM here and we can try to accommodate anyone that wants full access. We would be hypocrites if we focused purely on monetary gain for our letter as we view knowledge as something that should be attainable for everyone. Yet we are realists as well and understand mankind and its nature to exploit and take advantage even in the slightest of ways, so we are not naive either!
We have changed our Substack address, which was located prior at www.magnelibra.com, that address sends you to our main corporate site where you can find all the information on our Commodity Trading Advisory. Our newsletter/podcast will now be at https://blog.magnelibra.com.
Anyone interested in investing in XMR Monero please reach out, we have a link to Kraken and would be glad to consult anyone interested in getting involved here. As always we view these crypto currencies in the same realm as futures, high risk, high reward, and every portfolio should have a small percentage of their overall portfolio in investments like this. So if interested please reach out to the email below directly and we can discuss this further. The future of financial payment systems will be digital decentralized and we are still in the infancy of this fascinating technology!
If anyone is interested in working on a digital currency project and joining in as a core investor to help lay the foundation for what is to come, please reach out!
Support directly to our BTC address: 3DvDvPnjwu5Fd6sagAYmiFXA2fPkjJf2cp