Full Edition · Sunday Publication
-Settlements as of Thursday, July 2, 2026 · U.S. markets observed Independence Day holiday Friday, July 3
The Number the BLS Does Not Want You to Linger On
June nonfarm payrolls printed at +57,000 on Thursday, against a consensus expectation of +115,000 and well below the already downward revised May figure of +129,000. On its own, that miss would be notable. What elevates it to something more significant is the revision backdrop: April and May were marked down by a combined 74,000 positions, producing a net three-month picture that is essentially flat when you account for what was initially reported as reacceleration. The 12-month trailing average now stands at +36,000, a labor market that is barely treading water, not one that supports the rate-hike narrative that had been building into the number.
The unemployment rate fell to 4.2%, which sounds constructive until you read how it got there. The labor force participation rate declined 0.3 percentage points to 61.5%, the lowest reading since March 2021. Household employment fell by 507,000 people in a single month. People are not finding jobs, they are leaving the workforce entirely. A falling unemployment rate driven by participation collapse is not a sign of economic health. It is how a deteriorating labor market disguises itself in a headline statistic. We have maintained for some time that BLS data is serially understated and subsequently revised lower. This report is consistent with that pattern, and the revision trajectory confirms it. We do not believe the labor market is in the position the prior three months of headlines suggested.
Warsh, the Dot Plot, and the Performative Hawk
Kevin Warsh’s first FOMC press conference on June 17 was, by any institutional measure, aggressively hawkish. (By design, but we don’t and never have bought that narrative) The policy statement was stripped to 130 words. Forward guidance was removed entirely. Nine of eighteen policymakers signaled support for a rate hike before year-end, with six penciling in two increases. The committee raised its 2026 headline inflation forecast to 3.6% and core to 3.3%, sharply above the 2.7% March projection. Warsh himself declined to submit a dot, stating it is “not helpful in the conduct of policy.” (He is a dove in hawks rhetoric clothing)
The contrarian read gaining institutional traction is that the hawkishness was structural rather than genuine, that Warsh needed to draw a visible line between himself and White House pressure for cuts, and that the first meeting was the cleanest opportunity to do it credibly. The Citi Research team has maintained throughout that the data ultimately points toward cuts, not hikes. Following Thursday’s payrolls print, the September hike that was 30% priced heading into the number was completely removed from the CME FedWatch curve. The next inflection point is June CPI on July 14. That number determines whether the hawkish posture survives the summer or begins to unravel. Our framework remains that rate hikes into supply-shock, fiscally-driven inflation are pro-inflationary, not disinflationary. This is a dynamic we have documented extensively and which has not been disproven by the 2026 data. (we wrote a whole thesis on why this is in our article entitled, “Fiscal Dominance and the Inversion of Monetary Transmission”, on June 15th)
BOJ at 1%: The Intervention Trap and Fiscal Dominance in Practice
The Bank of Japan raised its policy rate to 1.0% on June 16 in a 7-1 decision, the highest level since 1995 and its first hike since December 2025. The yen was trading at approximately 160 against the dollar before the decision and remained there after it. Japan spent an estimated 11.7 trillion yen ($73.5 billion) on intervention operations in May alone. The currency barely moved. This is the intervention trap in real time: without a structural change in the interest rate differential between Japan and the rest of the world, currency intervention is a fiscal expenditure, not a monetary solution. Deputy Governor Himino has signaled continued tightening, and board member Tamura is publicly targeting 2% as the neutral rate with quarter-point moves every few months. The BOJ’s producer price index printed +6.3% in May, the fastest pace in over three years. The yen at 160 after a historic tightening cycle is our fiscal dominance thesis operating in a different jurisdiction with identical mechanics.
CRE Writedowns and the Private Credit Rotation
Two structural themes that do not make weekly headlines but are accumulating in the system: commercial real estate write-downs continue to compound through bank balance sheets and CMBS structures at a pace that the quarterly earnings cycle continues to absorb in small, digestible tranches. The aggregate is not small. Simultaneously, we are observing early evidence of redemption pressure in private credit vehicles among ultrahigh-net-worth allocators, a rotation out of illiquid, floating-rate credit exposure and toward assets with cleaner liquidity profiles and more transparent pricing. When the investor base that built the private credit infrastructure begins to exit, the marks that have been held at cost come under pressure. This is a slow-moving event, not a crisis trigger, but it is directionally consistent with a late-cycle credit environment where the risk premium on illiquidity is being repriced. We recommend you follow “FCNightingale” on X as he is a go to source for witnessing first hand the massive amount of CRE valuation collapse across the country.

SECTION I. Magnelibra Futures Market Trend Program
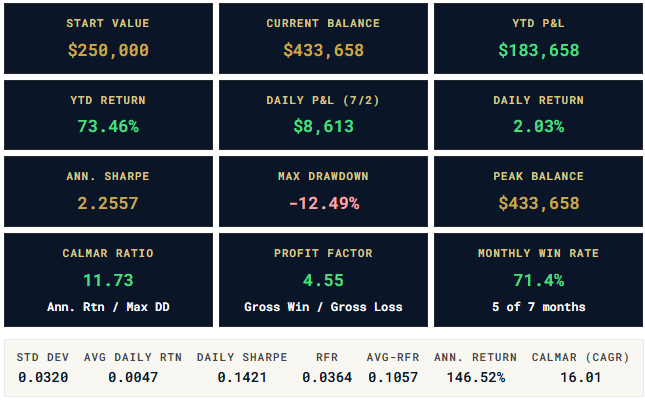
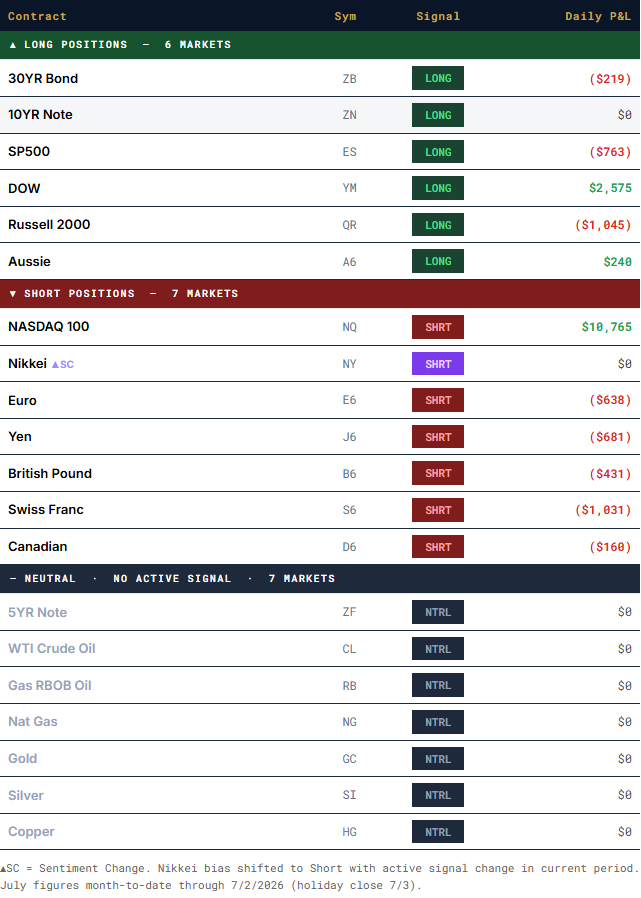
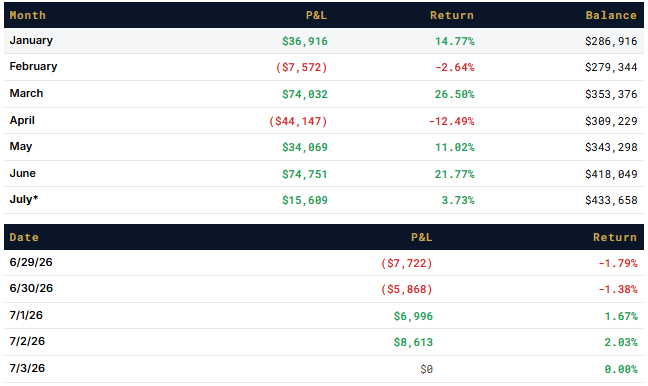
What You Are Reading: A hypothetical systematic trend-following program tracking 20 futures markets with a $250,000 notional starting value (January 1, 2026). Bias signals are generated by the Magnelibra proprietary methodology. All results are hypothetical and for educational purposes only. Past performance is not indicative of future results.
SECTION II. MEGA9 Equal-Weight Tracker
What You Are Reading: The MEGA9 tracks the nine largest U.S. companies by market cap on an equal-weighted basis, $100,000 notional start with $11,111 per position. A long put options overlay provides downside mitigation. YTD through July 2, 2026. All results hypothetical and for educational purposes only.
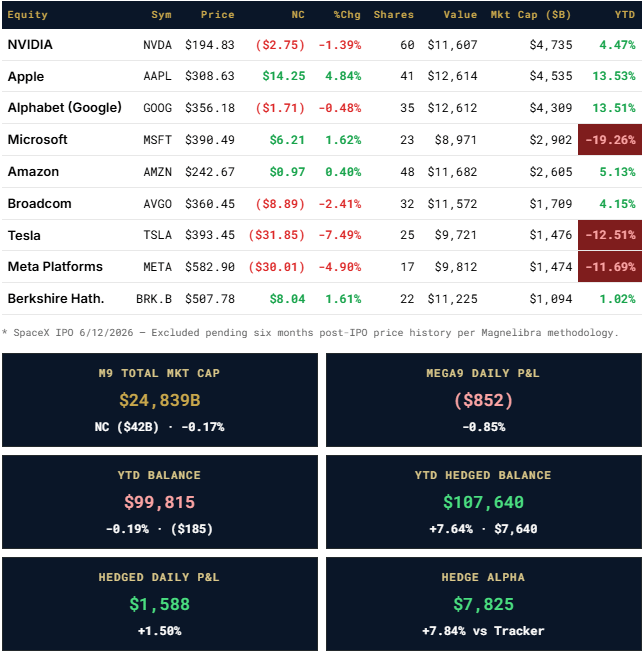
Options Hedge · 7/2/2026 -Long 5 QQQ 720 Puts at $3, Expired 7/2/26
Closing Price: $7.19 · Daily Options P&L: $2,440
YTD Options P&L: $7,825This week we will target to sell 5 of the QQQ 730 Call at $5 or better for 7/10 expiry
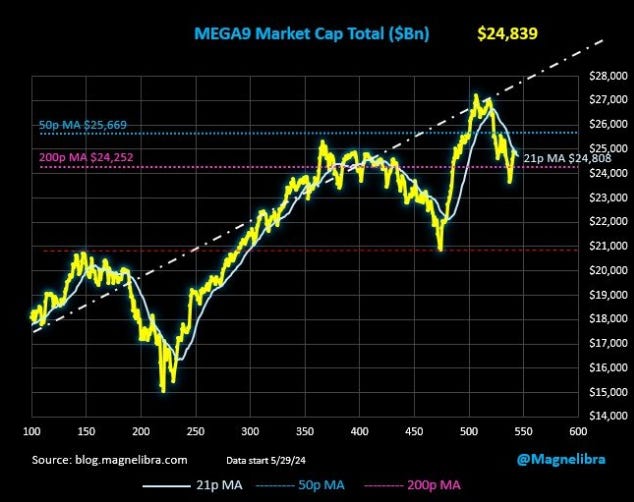
Aggregate Market Cap: At $24,839B the MEGA9 aggregate cap is testing its 21-period MA ($24,808), sitting between the 50p MA ($25,669) and 200p MA ($24,252). The index has retraced from highs near $27,000. A hold of the 200p MA is constructive; a break below would represent the second meaningful structural rebound deterioration in the mega-cap universe since the recent rally off of the 21k market cap level.
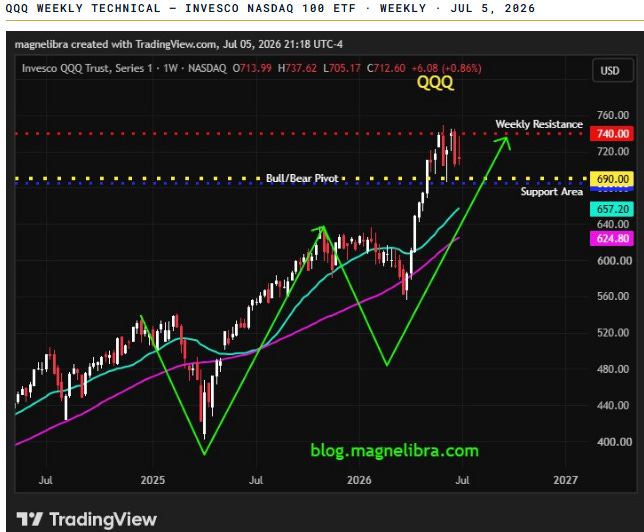
Weekly resistance: $740.00 (red dashed) is a level that has held since first tagged in early 2026. Bull/Bear pivot at $690.00 (yellow/blue band) is the line that separates constructive from corrective structure on a weekly close basis. Support area $657.20 / $624.80 below. Current price is in recovery from the $690 pivot test but has not yet definitively cleared $740 resistance. The options hedge in the MEGA9 tracker (Long QQQ 720P) expired July 2 and was a good hedge for the program. The $720 put strike reflects the mid-range between current price and the $690 pivot.
SECTION III. Interest Rate Futures
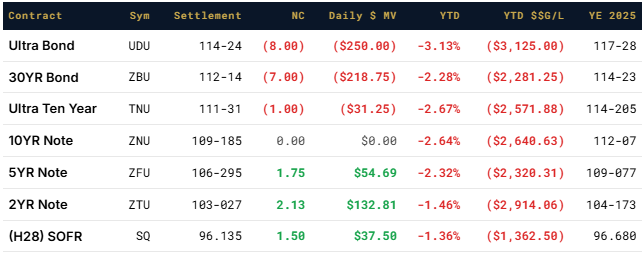
SECTION IV. U.S. Treasuries & Yield Curve
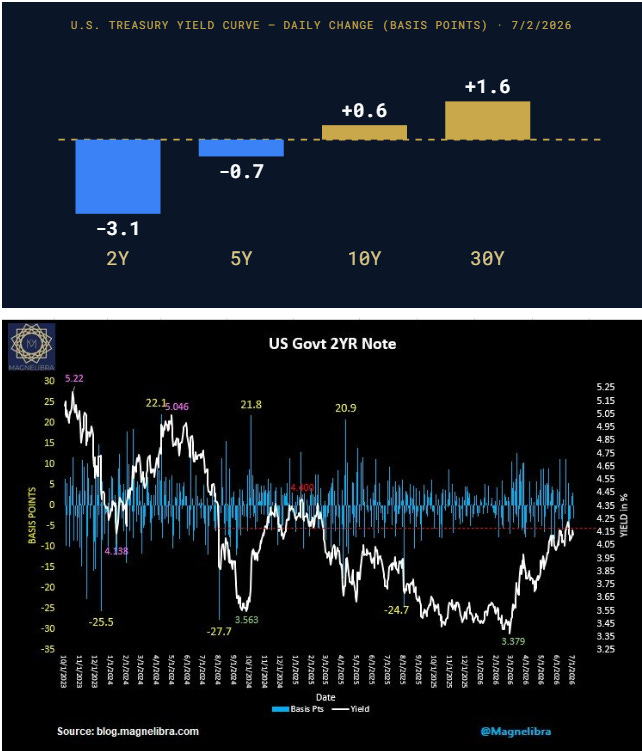
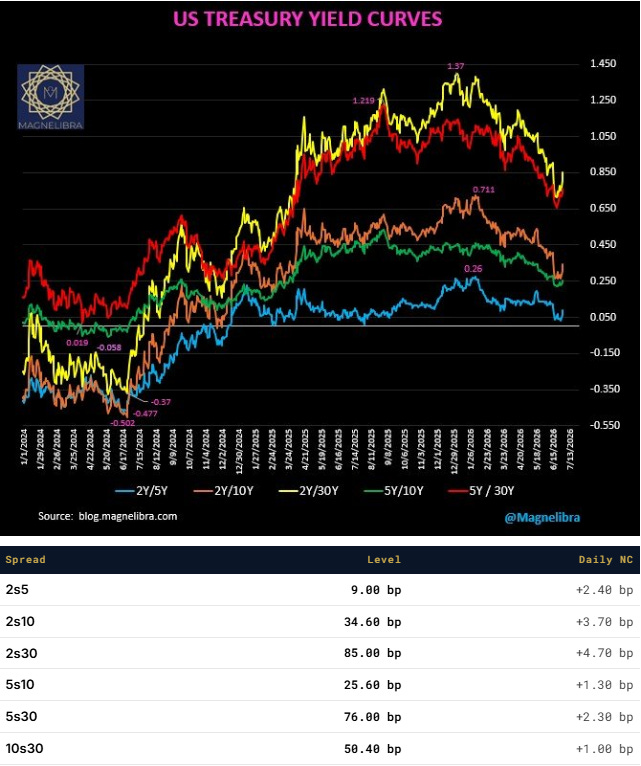
What You Are Reading: On-the-run Treasury yields and spot yield curve spreads. A steepening 2s30 with a bull-flattening front end reflects the classic post-NFP reaction: front-end pricing out rate hike risk while the long end reprices fiscal premium. The 2Y yield fell 3.1bp on the day while the 30Y rose 1.6bp, a pattern consistent with our fiscal dominance thesis.
Technical Levels
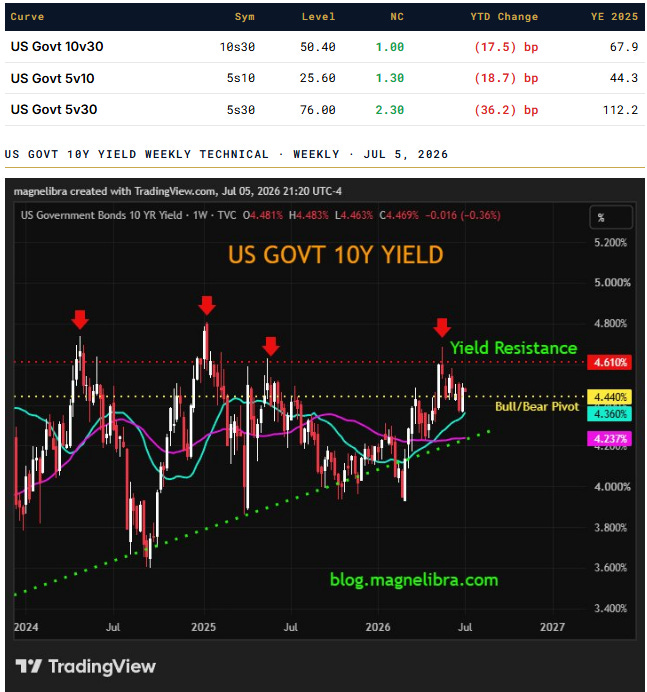
Current 4.469%, closing below the 4.610% weekly resistance level that has capped multiple rally attempts since 2024 (four distinct rejections annotated). The Bull/Bear pivot band at 4.440%/4.360% represents the critical medium-term inflection zone, a sustained close below 4.360% would be structurally significant for duration positioning. Rising green trendline support continues to be the initial downside target for bond bulls to overcome. The June NFP miss compressed the 2Y by 3.1bp while the 10Y held relatively firm (+0.60bp), reinforcing the bear-steepening thesis as fiscal premium continues to dominate the long end.
SECTION V. Equity Index Futures
What You Are Reading: Global equity index futures on the settlement date. The DOW outperformed on the day while NASDAQ and SPX softened. The Nikkei shed over 1,300 points. YTD dollar gains reflect hypothetical single-contract performance from YE 2025 reference prices.
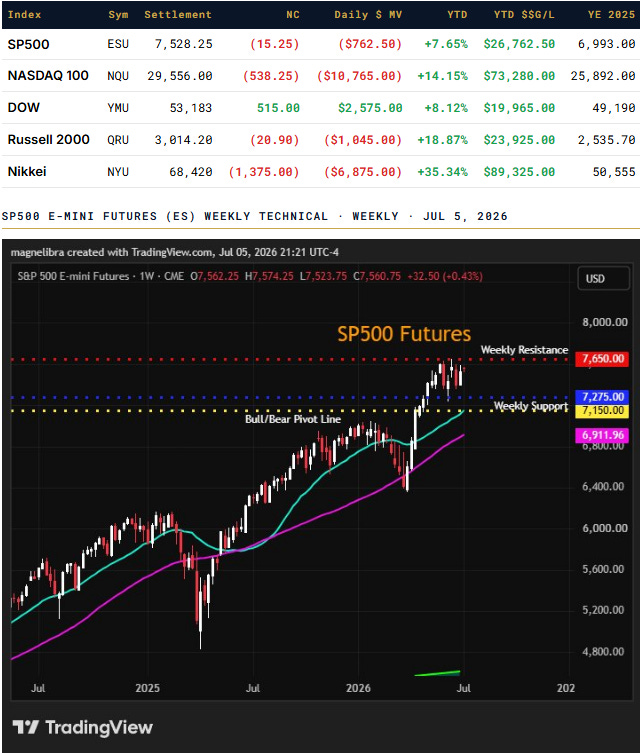
Weekly resistance at 7,650, the index has been pressing this level with the current week opening above the Bull/Bear pivot at 7,150. Weekly support band 7,275/7,150 provides the key range floor. Clean channel structure intact with both moving averages still positively sloped. A confirmed weekly close above 7,650 would open extension toward 8,000. The Trend Program maintains a long ES bias.
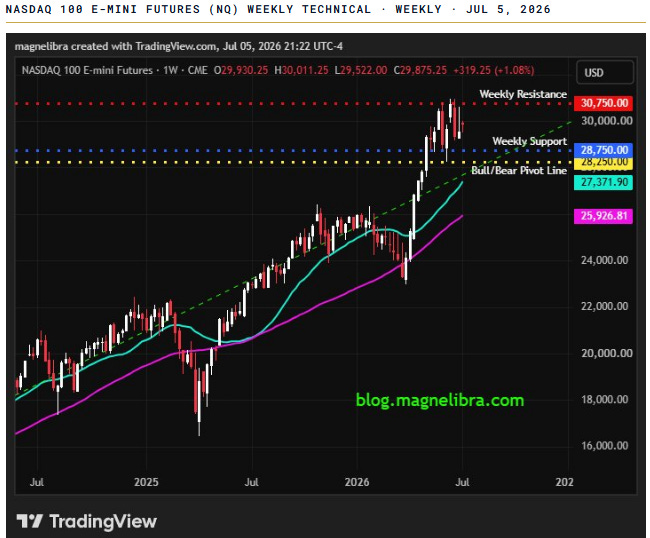
Weekly resistance: 30,750, tested last week and rejected. Weekly support: 28,750. Bull/Bear pivot line: 28,250. The index retraced sharply from the 30,750 resistance zone after making a marginal new high, a pattern consistent with distribution at the top of the range. MA support at 27,371.90 (cyan) with longer-term MA at 25,926.81 (magenta). The Trend Program carries a short NQ bias, which produced the largest single-contract gain on July 2 at +$10,765. The spread chart below contextualizes the NQ underperformance relative to ES on a dollar-weighted basis.
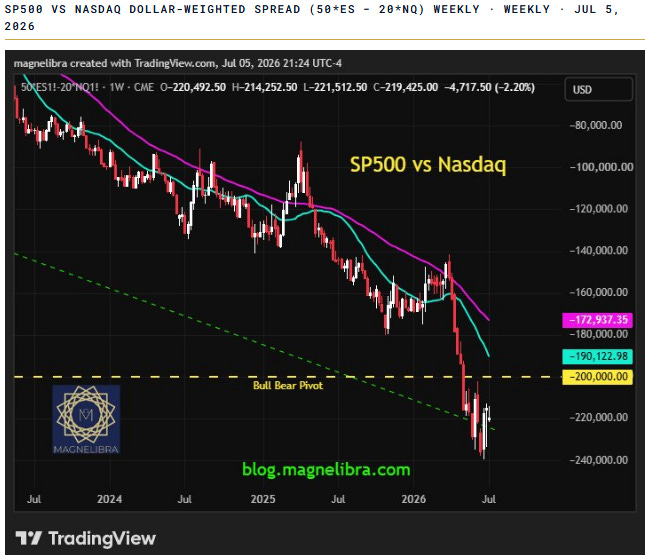
Spread value: -$219,425 (-2.20% on the week). The Bull/Bear pivot at -$200,000 remains decisively broken to the downside, with price well below both moving averages (-$172,937 magenta, -$190,122 cyan). The persistent negative trend confirms structural SP500 underperformance relative to the NQ on a dollar-equivalent basis especially since 2025. However we believe the real back and forth here near the -220000 level is consistent with the Trend Program’s long ES / short NQ configuration. A close back above -$200,000 would be the first meaningful signal of spread reversal.
SECTION VI. Currencies & Bitcoin
What You Are Reading: G10 currency futures and Bitcoin settlement. The dollar index softened modestly on the NFP miss. Yen at 62.445 (futures) reflects a spot rate near 160.0 per USD essentially unchanged despite the BOJ’s historic 1.0% policy rate and $73.5B in May intervention. Bitcoin YTD -29.75% against a YE 2025 reference of $87,455.
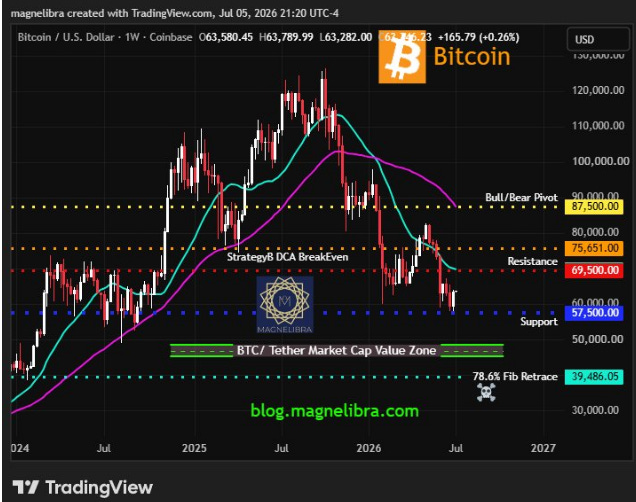
Key structural levels: Bull/Bear pivot $87,500 (significantly above); StrategyB DCA Break-Even $75,651 (Strategy Inc average acquisition cost, BTC is currently trading $13,210 below this level); Resistance $69,500; Support $57,500. The BTC/Tether Market Cap Value Zone (green horizontal band) represents the structural demand zone identified by the relative market cap of BTC vs Tether, historically coinciding with major accumulation periods. The 78.6% Fibonacci retracement from the cycle peak at $39,486 is the critical downside level. Current price is between the $57,500 support and $69,500 resistance, a range-bound structure that must resolve before a directional trend reasserts. YTD BTC: -29.75%. MSTR mNAV at 0.96x reflects BTC trading below MSTR’s average cost. (total dilution)
SECTION VII. Energy
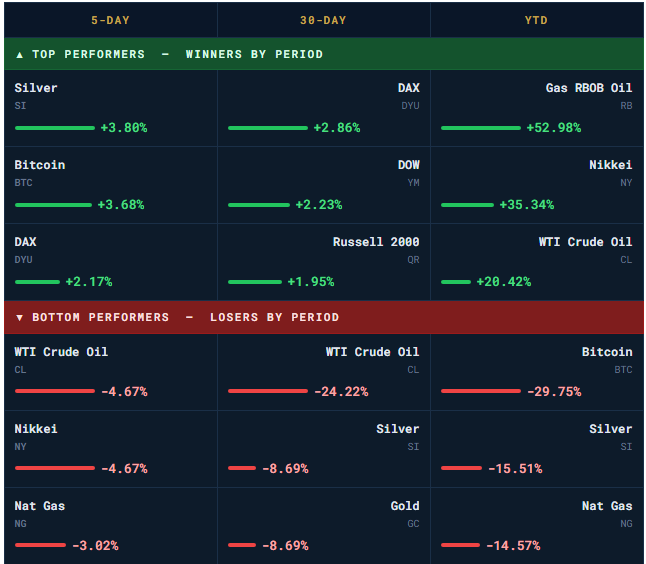
What You Are Reading: WTI crude and refined products settlement. RBOB gasoline remains the standout YTD performer at +52.98%, reflecting cumulative Iran-related supply disruption. Crude WTI at $68.69 is still +20.42% YTD. Natural gas continues its secular underperformance at -14.57% YTD.

SECTION VIII. Metals
What You Are Reading: Precious and industrial metals futures. Gold at $4,125.70 is -7.09% YTD from the $4,440 YE 2025 reference, a notable pullback from all-time highs that is consistent with real yield compression and a dollar that has held bid. Silver at $61.064 is -15.51% YTD. Copper +5.62% reflects industrial demand resilience.
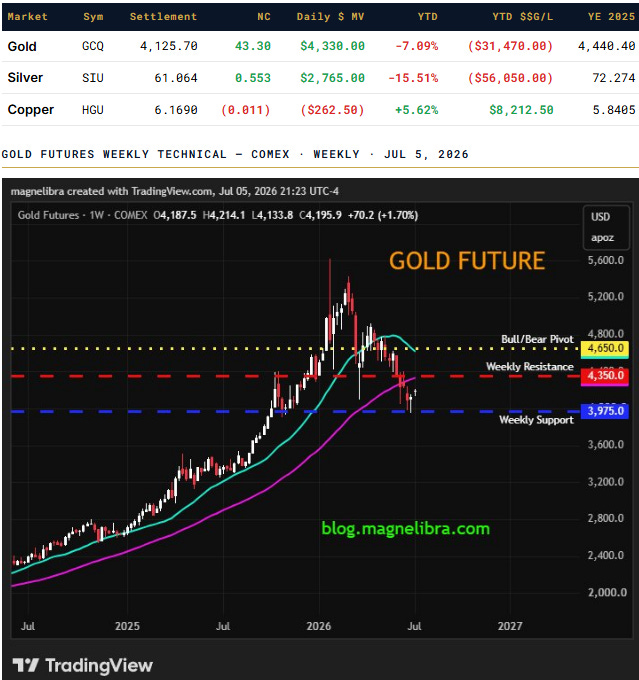
Significant structural deterioration from the 2026 high above $5,200. Gold has broken below the Bull/Bear pivot at $4,650 and now trades just above the former weekly resistance at $4,350, now acting as resistance on recovery attempts. Weekly support at $3,975. The moving average structure (cyan and magenta) is beginning to roll over, a bearish technical development for the intermediate trend. YTD: -7.09% from the $4,440 YE 2025 reference. The real yield compression thesis that drove gold’s 2025-2026 rally is being challenged by the Warsh Fed’s explicit hawkish posture and the dollar holding bid at 100.6. However as you know we do not believe the FOMC hawk rhetoric, but that doesn’t mean metals can’t remain in a lower price pattern.
SECTION IX. German Futures
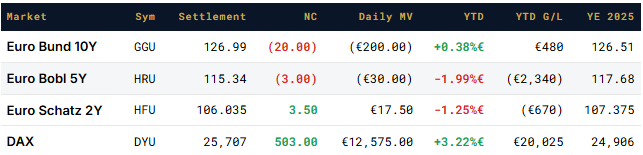
What You Are Reading: Eurex-listed German government bond futures and the DAX equity index. The Bund softened on the day, consistent with European rates tracking the global fixed income tone. The DAX gained 503 points on the session and remains modestly positive YTD in euro terms at +3.22%. YTD figures denominated in euros.
SECTION X. Winners & Losers
SECTION XI. Founders Digital Strategy
What You Are Reading: The Magnelibra Founders Digital Strategy is a proprietary basket model benchmarked against an equal-weighted top 10 digital assets composite. Inception date 10/20/2025 at $250 NAV. Crypto markets trade continuously; 7/3/2026 data reflects the Independence Day session. All values are hypothetical NAV for educational purposes only. Founder Tier subscribers receive discretionary year-end benefits. We encourage our well liquified subscriber base to take advantage of this unique truly decentralized offer.
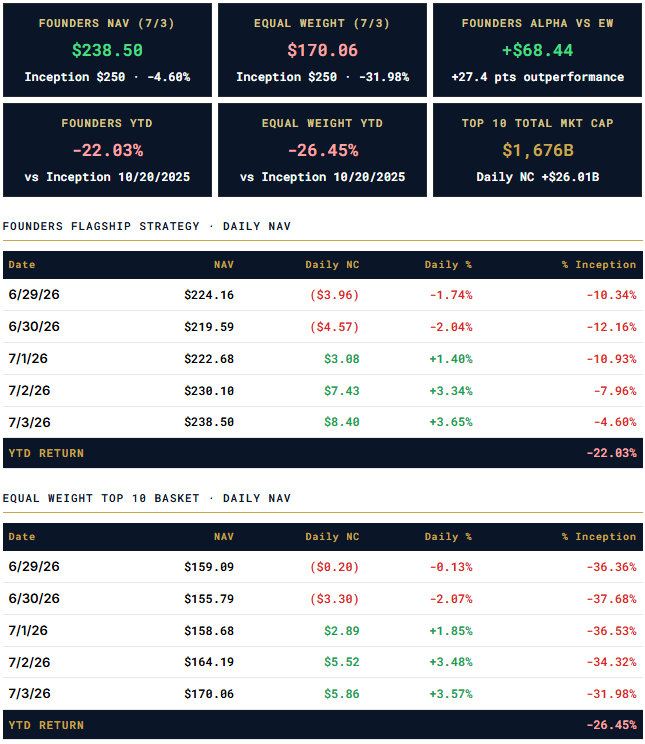
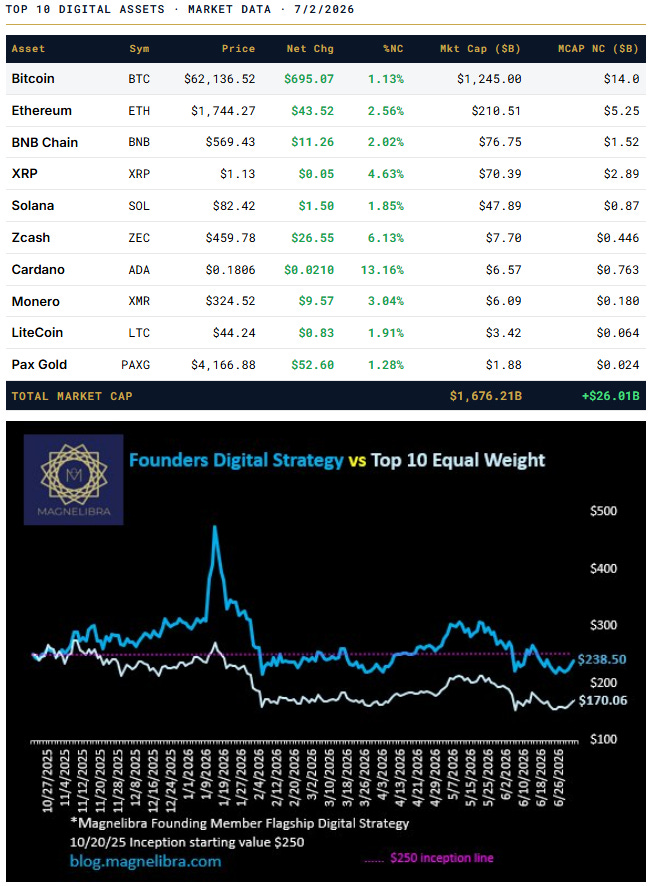
Performance Context: The Founders flagship strategy NAV of $238.50 represents a -4.60% drawdown from the $250 inception value, outperforming the equal-weight top 10 basket ($170.06, -31.98% from inception) by approximately 27.4 points. Selective composition has materially dampened the drawdown experienced by the broad digital asset market since October 2025.
SECTION XII. Strategy Inc / MSTR
What You Are Reading: Strategy Inc (MSTR) is the largest corporate holder of Bitcoin with 847,363 BTC at an average cost of $75,651. The mNAV ratio measures MSTR’s market capitalization relative to the fair value of its Bitcoin holdings. An mNAV below 1.0x implies the equity is trading at a discount to its underlying BTC asset value. This week the option to sell will be the $110 Call at $3 or better and is not consistent with the Monday 5% OTM. This is a strategic call based upon the drawdown and level that MSTR currently sits at. We feel that investors are better off being patient here at these levels and its this dynamic capacity that all investors should be aware of as things are not always static
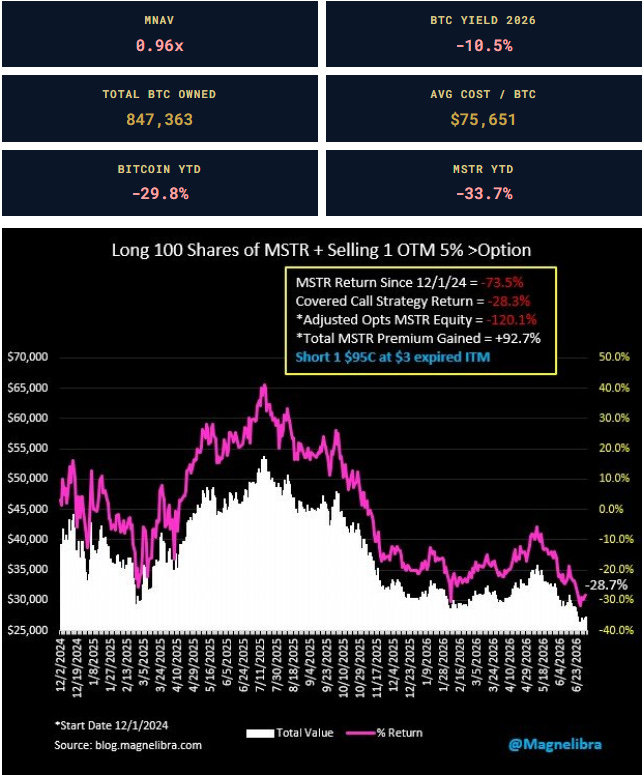
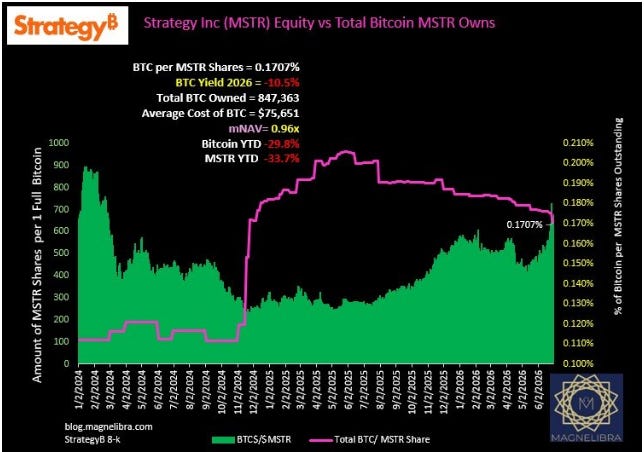
mNAV Explained: mNAV (modified Net Asset Value) = MSTR Market Cap / (Total BTC Owned × Current BTC Price). An mNAV of 0.96x means the market is currently valuing MSTR’s equity at approximately $0.96 for every $1.00 of Bitcoin it holds. At 0.96x, MSTR is trading at a discount to its underlying BTC asset value. The BTC Yield metric of -10.5% for 2026 reflects dilutive equity issuances that have reduced BTC per share outstanding- a dynamic we flagged at the onset of the Strategy Inc transformation thesis.
EDITORIAL- The Long View
The June employment report creates a fork in the road for the second half of 2026. The consensus that was building toward a late-summer Federal Reserve rate hike has been materially disrupted. (As we knew it would) However Thursday’s payrolls number does not, by itself, resolve the policy question it only removes the most urgent rationale for tightening.
The next real report to watch is the June CPI, due July 14, two weeks before the next FOMC decision. If CPI comes in at or above 4.0%, the argument for a hold-then-hike survives. If it prints closer to 3.5% or below, particularly if core softens meaningfully, the contrarian thesis that Warsh’s hawkishness was structural positioning rather than durable policy intent gains its first real piece of supporting evidence.
The yield curve has already begun to express this uncertainty. The front end bull-flattened on the NFP print while the long end continued to steepen with the 2Y -3.1bp, 30Y +1.6bp on the day. The bond market is simultaneously pricing out hike risk at the short end and building in fiscal premium at the long end. This is not a contradiction. It is the market’s rational expression of our fiscal dominance framework: monetary optionality is returning at the front while the cost of the government’s long-dated borrowing continues to rise regardless. The 2s30 spread at 85bp, while still historically compressed, has widened materially from the inversion low. The directionality is set.
The Futures Market Trend Program’s current positioning reflects this macro backdrop with reasonable fidelity. Long duration in ZB and ZN, short NASDAQ, short the major funding currencies (EUR, JPY, GBP, CHF, CAD) while long AUD a configuration that is net long risk-adjusted carry where it exists and positioned for continued dollar strength in the near term while maintaining duration longs as a rate-cut optionality position. The 2.2557 annualized Sharpe and 73.46% YTD return are the outputs of that framework operating in a regime that has been consistent with our thesis. July 14 is the next regime test. We hope a few institutions and investors are beginning to notice how important it is to read our work. We aren’t in it for the money, we never were, we are in it because you and every investor out there needs to know the truth of our system!