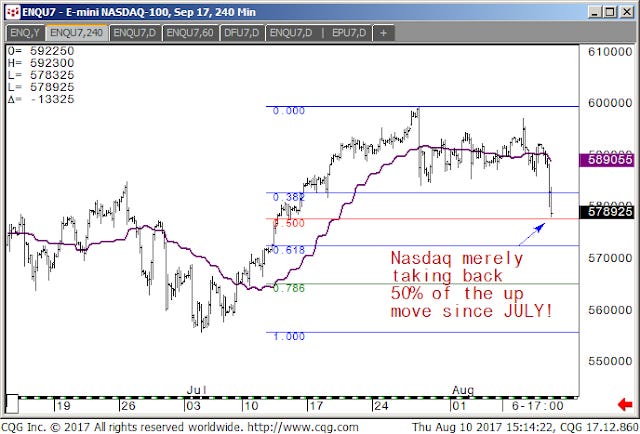
We had penned a letter for this week and were about to submit it, but yesterday and today’s market action has prompted us to enlighten our readers with a little insight into the recent rare sell off in equities instead. We wrote a few weeks ago about how the Nasdaq which is basically the FAANGs for all intents and purposes was being quietly sold off. Here is a chart showing that initial sell off on the 27th of July:
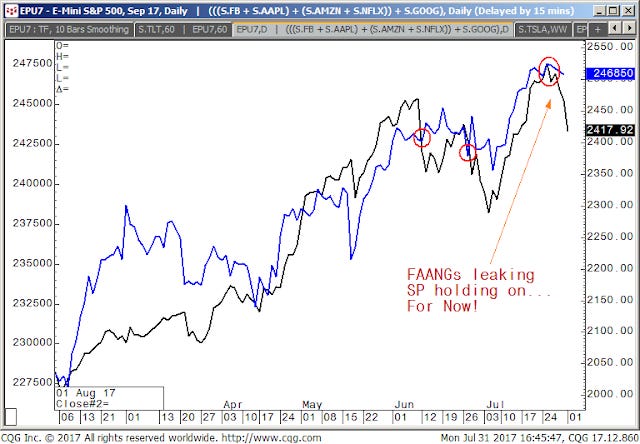
It’s not that we didn’t agree with whomever decided enough was enough and the risk of owning just a few stocks and calling it a diversified portfolio seemed to have had enough. Here was the chart we used a few weeks ago, you can see the SP (blue) didn’t follow:
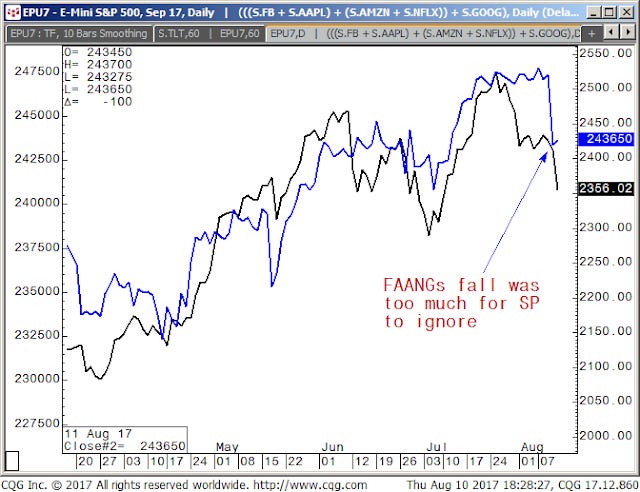
Fast forward to today’s action and we can see that what began a few weeks ago in the Nasdaq, has spilled over to the SP500 now. In a binary HFT Algo driven risk parity, spread based investment world, one would generally expect the FAANGs to be sold and the broader markets to be bought. This was the case and we can tell by the weekly settles of the Nasdaq, which last week settled -12.25 for the week and the DOW which was up some 242 points. However, this spread risk parity swap trade didn’t last long as all three indexes were hit hard today and for only the 3rd time this year settled down more than 1%. The Nasdaq -132.75, SP500 -35.50 and the Dow lost 182. Here is the FAANG/SP500 chart as it looks today as you can see the SP500 did turn lower:
This all comes on the cusp of central bankers last week warning investors that they are becoming far too complacent about the policy outlook. John Hussman also put out a great piece at the end of July in his weekly market comment entitled Hot Potatoes and Dutch Tulips which can be found Here. In his piece John displayed a great chart on a few key valuation measures that they watch, which they seem to utilize to obtain a longer term expected return on equities. The chart speaks for itself and the extreme overvaluation is second only to the dotcom peak in 2001, chart is shown here:
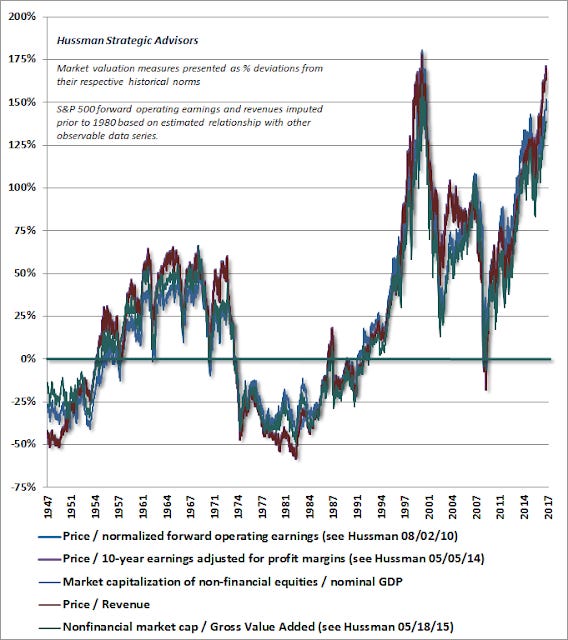
We know many have been warning about these imbalances and we know that many have the all to ingrained by the dip mentality, but at some point, heeding a word of caution makes prudent sense. We aren’t advocating a sell all, get out of everything run for the hills, rather we would suggest you take a very mindful approach to your portfolio and figure out if things do finally turn, how insulated are you from substantial loss. It’s very easy for markets like this, one in which the central banks clearly wield a healthy helping hand of monetary stimulus to get lulled into complacency. We feel we will continue to bring these ongoing developments to the forefront so you are informed and always aware.
The North Korean issue has raised the global balance of power struggle to new heights and any time major powers start talking about nukes, we deem it a very sensitive and highly dangerous scenario. So, we aren’t sure if what’s developing in the markets is merely a fundamental de-risking or if broader geopolitical events are slowly forcing some to remove risk just for the short term. Whatever the case, we are cognizant that many of the global macro indicators do not justify valuations and lack of risk that is running rampant throughout the markets. We understand full well the fact that everyone and we mean everyone is selling volatility to generate whatever little alpha they can above their fee structures to justify their utility. We understand that one day, the market will not come back that selling will beget more selling and that many will get smoked, our job is to make you aware so you can make good informed decisions. We know that the human minds ability to hold and remember any substantial inundated 24/7 info is a mere few days and this whole North Korea thing could be over in an instant and it’s all roses for the markets once again. The only question is how long can the central banks keep up this charade?
So, with the equity markets getting hit and the bond markets despite a week of auctions and supply have been the beneficiary of this stock market sell off, we feel that risk must constantly be monitored. Our original weekly piece was more geared toward the recent US dollar weakness and whether this so-called King Dollar has just been the recipient of a less than hawkish FED or if this down move is just the beginning of something larger. UBS had a piece out this week stating the selloff in the US dollar hit their initial target at the 93.00 level (DXY) and that it should find a firmer footing here. We know that this level is important and it is holding, but we feel that further weakness is ahead. We are reminded of and cognizant of the 1985 US dollar and the Plaza Accord that devalued it and we think this should be on our radar. We feel that this type of move will catch everyone by surprise but from a debt perspective, seems to make some sense. One of our friends sent us this chart showing the 1985 move, which lost over 50% in just over a year and a half:
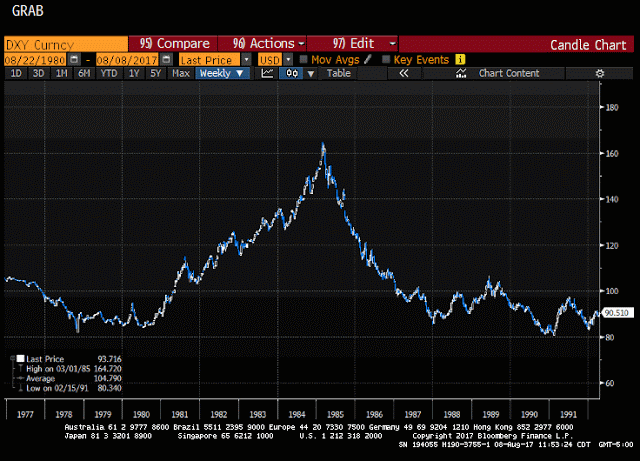
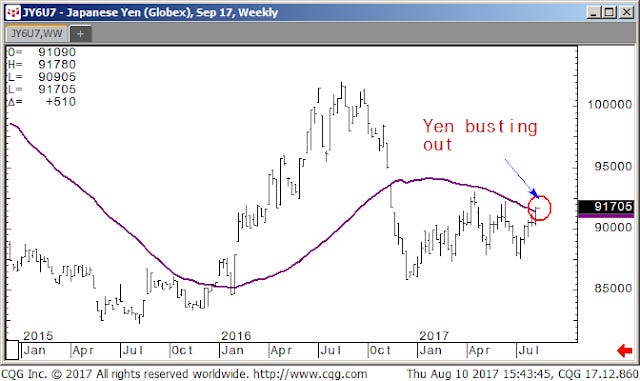
We can’t help but think of the problems this would cause if the Yen and Euro decidedly took off higher, a dollar deval? Debt ceiling issues, hmm we really need to keep an eye on all of this. As far as the Yen portion of the dollar, it seems as if someone is quietly accumulating long positions as the Yen is breaking above resistance:
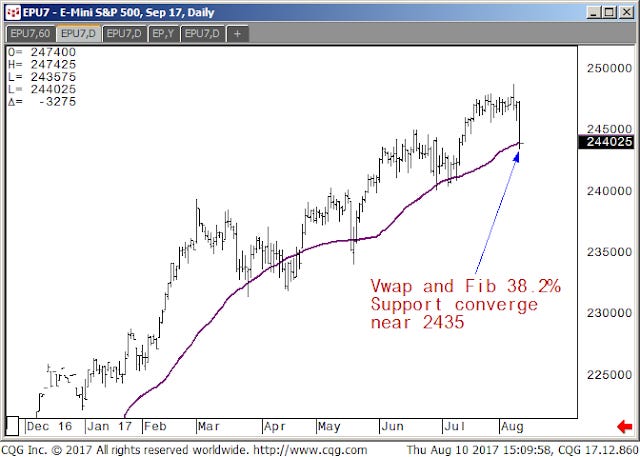
Ok we know today’s equity selloff move is usually taken back swiftly by some miracle central banker speak or some other buy side algo induced illiquidity move, but geopolitically the events of NK might keep the market a little bit on its heels here. We do know support exists in the SP500 at the VWAP and 38.2 % retracement which both converge around the 2435 level in the SP500, chart here:
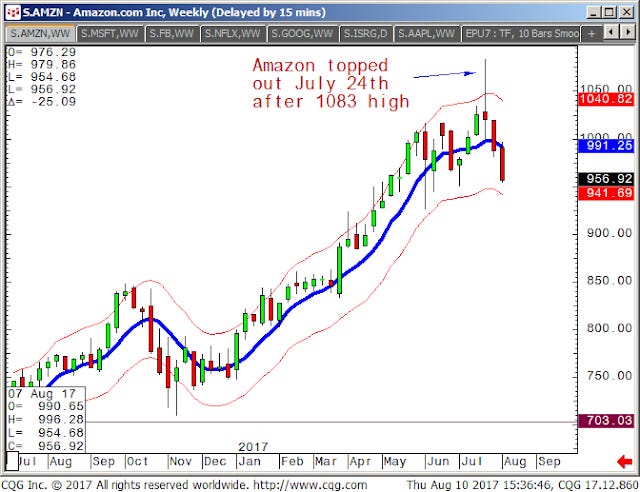
Now staying in the equity space, we hate to pick on Amazon, but the whole $1000 a share press coverage just begs to be picked on. Any way you can see the dramatic turnaround after hitting $1083:
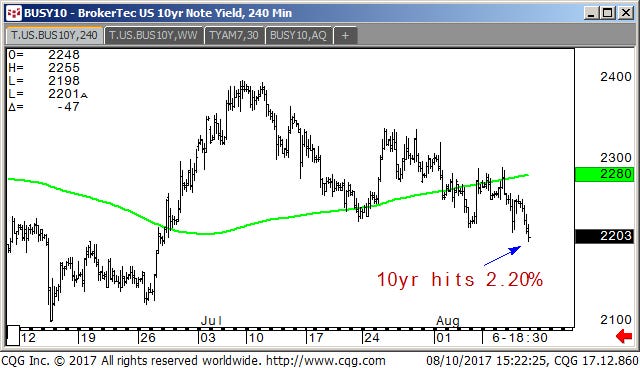
Moving over to US fixed income particularly the US 10yr Note, we can see that the yields continue to fall and are now below that pivot area we talk about around 2.30%, settling near 2.20% down 20 basis points from its July highs:
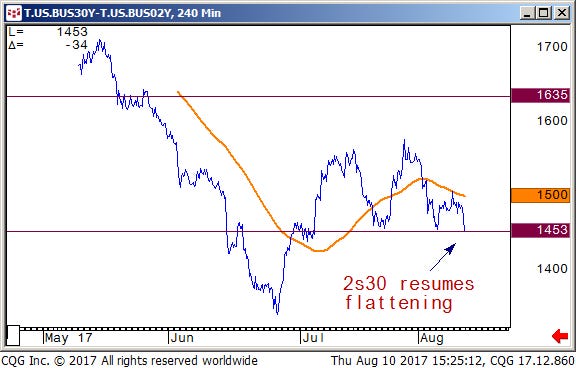
All this flight to quality it seems has resumed the flattening trend in the US treasury curve as the 2s30 curve is pressing the 145 basis points level for the third time in as many weeks:
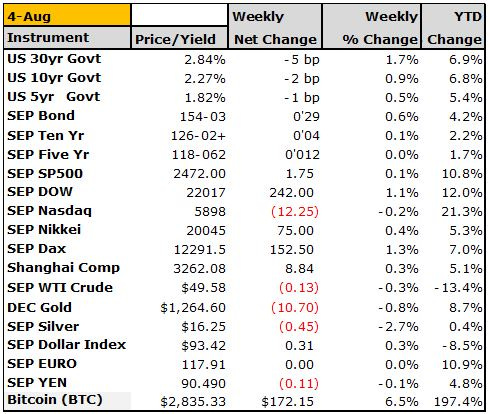
Ok that’s it, we will see how the week finishes up and report back any of our insight and findings. We leave you with last Friday’s settlement prices which show Bitcoin back in vogue as it now stands at $3400! The CBOE reported this week that its planning on opening a cash settled bitcoin futures product by the end of this year. These developments are adding to the legitimacy of this new innovation and we look forward to bringing you further developments in the space. Cheers!