


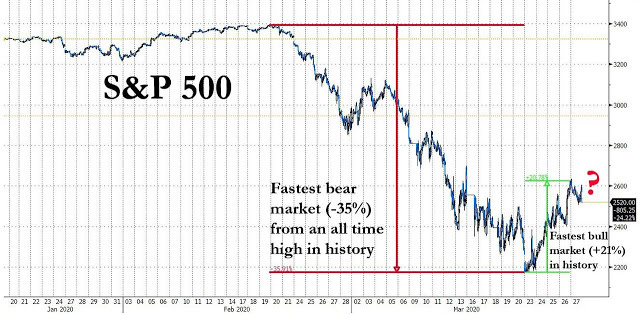
I think many investors are feeling the aftershocks from one of the largest and fastest down moves to then going to the fastest up 20% recovery off of the lows in history. Many are looking for answers and many don’t understand the true nature of our markets and what really drives them. Magnelibra often tries to convey one very simple message when it comes to dictating markets and that message is very simple. Call it Occam’s Razor or just call it two decades of experience navigating these treacherous waters, to put it plainly, the only thing that really matters is whether or not central banks are ADDING or TAKING liquidity.
Ok, Magnelibra what the hell do you mean adding or taking liquidity. Well it’s actually pretty simple if you just think about how our monetary plumbing system works. Just remove all the thousands of economic variables and start at the very top of the pyramid control structure. That is who adds digital 1s and 0s to primary dealer, money center banks? In the U.S. we call it the Federal Reserve a private company in charge of issuing fiat currency and monitoring stable pricing and maximizing employment.
If we start at the very top of this pyramid then all we need to do is follow what they are doing. Because in reality when you look at our system in this regard, you then disregard the transfer mechanisms and rather focus on what actually “is” rather than what “may” be. So, before we look at the central banks reaction to what will end up being one of the most systemic and devastating economic issues of our lifetimes, lets look at where equity value was before all this went down:
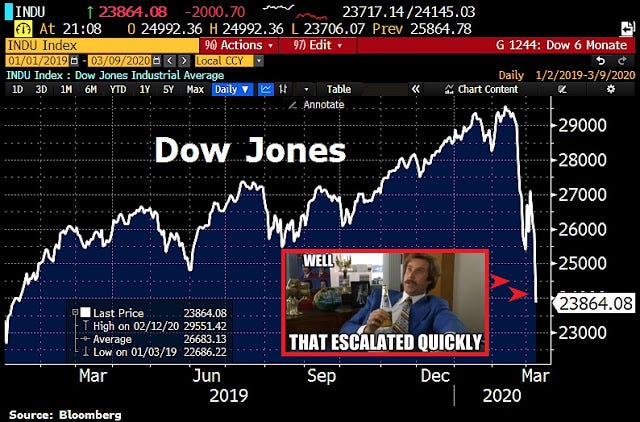
You can see in late February the Dow was once again putting in new all-time highs, and then the floor dropped out. Was this a surprise, technically? Fundamentally? Umm, noit was not as this next chart clearly shows, valuations were and still may be at historical extremes:
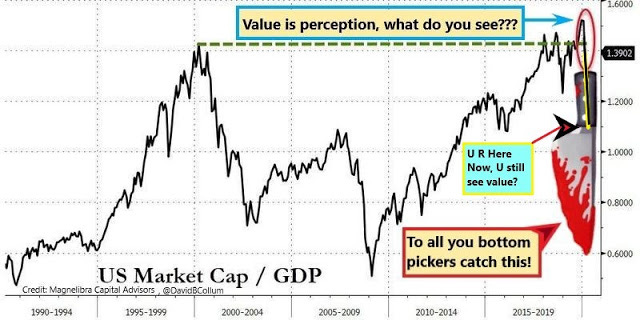
This chart displays the US Market Cap/GDP and you can clearly see that equities were well above the extremes set back in the late 90s during the internet bubble! So no, anyone saying they are shocked that we have seen the fastest sell off in history, one, doesn’t understand where we were and two, don’t understand what mechanisms actually drive our financial markets.
Furthermore, as the FED unleashes Trillions worth of stimulus let’s remind ourselves the absolute absurdity of those corporate treasurers that have sacrificed their balance sheets, undoubtedly following the Modigliani & Miller Prepositions which denoted that capital structure in a vacuum doesn’t matter. Well unfortunately for corporations, the global liquidity and economic structure exists in the real world and here is a chart displaying just how complacent these corporate treasurers have become over the last decade, so when you see all these corporations asking for bail outs now, know that they have been buying back stock with borrowed money, not profits. Now that the economy has taken a turn for the worst instead of saving for a rainy day, they have their hands out and hands up in the air saying we need help:
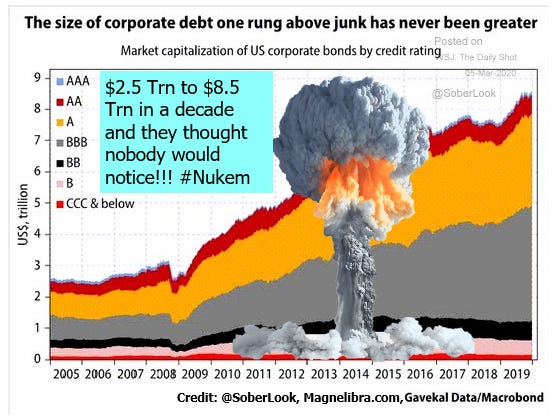
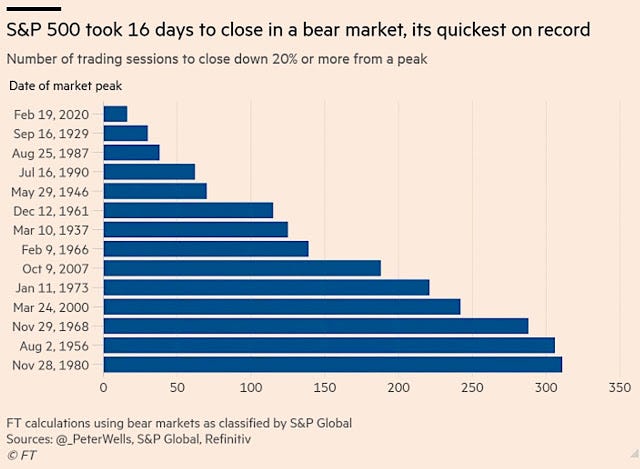
So, is it any wonder that the equity markets have collapsed so quickly given the fact that the Covid-19 virus has put the globally economies in a complete shutdown? We don’t think so and just to put the veracity of this move into further context, here is the comparison to the infamous 1929 market move:
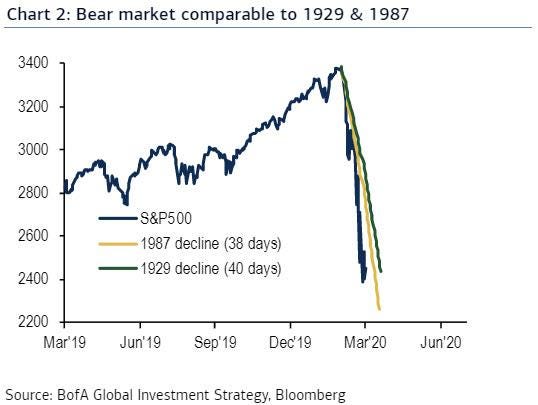
The Financial Times posted a great graphic on this as well:
Back to the moral of our story as we live through one of the strangest times in modern day history. Nobody a few weeks ago would have thought that the world, the global economies could be brought to their knees, to a complete standstill. Given this and given the fact that millions will be filing for unemployment as indicated by the last number which was 3.3 million and the continued shut down will force many businesses to close and close for good.
The rapid destruction of global GDP is something that will take time to alleviate and Magnelibra expects a massive reduction on this front which will probably be well into the negative double digits in regards to GDP decline. When we look at GDP we know the equation MV = PQ is often used, in this light we can see why the “M” is going to have to climb and climb massively because the PQ is set to decline and decline massively. The “M” is monetary base and for further review of this equation feel free to review our post from last year which highlighted the general facets of this equation. Anyway, the FED knows the power of QE and they wasted no time, unleashing a massive multi Trillion-dollar stimulus package with from a size and scope perspective is truly unprecedented.
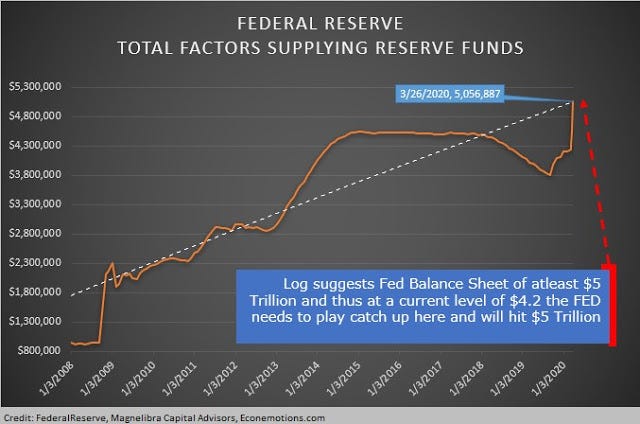
With all this in mind, we look at our log chart of the Federal Reserve’s assets which we felt were well under the amount required in order to keep growth on a steady trajectory. We put this chart out a few months ago when the FEDs balance sheet was just over $4 Trillion, stating the FED was going to have to hit $5 Trillion here per our log chart. Now here is this chart fully updated and as you can see the FEDs balance sheet is now back at the log level and over $5 trillion:
For those that don’t understand QE or Quantitative Easing, it’s really simple, adding digital zeroes to bank accounts so they can liquify balance sheets, extend credit, extend leverage and provide a back stop to any selling that may need to clear in order to stabilize the system. We often talk of our fiat system as being credit based and wealth being all credit based and not “monetized” wealth.
What do we mean by monetized wealth? We mean wealth that exists in liquid cash or precious metal like Gold or Silver. For us that is real wealth, everything else is just credit, whether its owed or its paid, its just credit. Another point we would like to make about this is that not everyone can sell and “monetize” why? Because the real tangible cash and gold is in very limited in supply and thus not everyone can sell and certainly, they can’t all do it at the same time. This is why and how the equity markets can lose 30% just like that. If you don’t understand this clearly enough, let me explain it like this.
I use my savings to buy Apple stock, let’s say I own $10 worth and then one day it goes up to $20. CNBC will tell you my net worth in regards to my stock has doubled. I am worth twice as much. When in reality, it doesn’t mean anything unless I monetize it, i.e. sell it and take in cash or two sell a derivative that pays me cash in return for liquidating the stock at some point in time in the future.
Using a derivative is a vastly different “monetization” than selling for cash, this implies inherent counterparty risk, for the derivative may be offered by someone that may default or not be able to honor my obligation in cash when the time comes. So, this brings us back to the main point, if you don’t sell for cash or gold, its not MONETIZED!
So, with that out of the way we hope you understand just a little bit better on exactly how our monetary system works. The problem we see going and moving forward is that the sheer size of our debt and our balance sheets are being constantly subjected to the powerful mathematical and scientific property known as the inverse square law. What is the inverse square law?
Simply it means that the further we get away from point A, or the initial point, the intensity of the force we are exerting changes by the inverse square of the distance between the points and the forces source. In this case, the further time moves forward, the larger the bailouts will have to be because the potency of the said bailout diminishes. If it takes $1 now, it will take $2, then $4 then $16, etc.
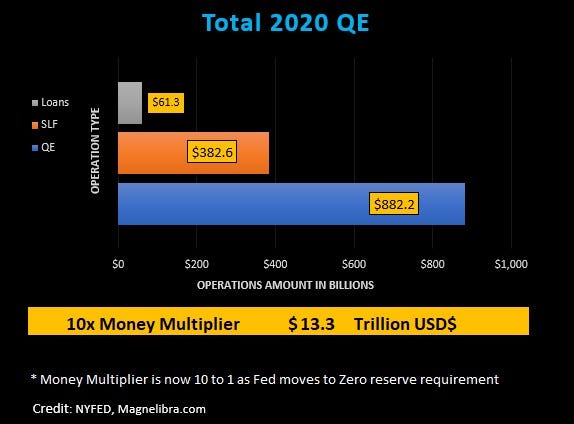
The FED has decided to go all in and as it stands today, the total money multiplier affected QE sits over $13 Trillion dollars of stimulus that can eventually make its way through the plumbing of the financial system. We have $61.3 Billion in direct loans, $382 Billion in SLF and $882 Billion in direct QE:
It hasn’t surprised us that the U.S. equity market has gone from a bear market to a renewed bull market in just a few days as this chart from Zhedge points out:
Will this last? The FED is all in and thus it better, or else the monetary system is at stake. One thing is certain, the FED as Jim Bianco has pointed out has effectively been nationalized and backstopped by the U.S. Treasury. This is indeed a very big deal and one we will continue to monitor. We aren’t sure if this will work out as it did in 2009, but we are cognizant of the sheer amount of real QE being thrown at this. The only caveat is how long will the U.S. and the global economies need to be shut down in order to stem the tide of this new “invisible enemy?”
Ok, the note was long, we didn’t get into bond liquidity, Gold and Silver liquidity, the fact that Oil trades at $20 but we can only do so much. Thank you for reading, thank you for listening and we hope you got something out of this. Feel free to reach out and discover our Global Futures Benchmark Program an alternative investment futures and options strategy designed as a cross sector allocation long/short utilizing both systematic as well as discretionary processes. We continue to look for like minded investors who want to navigate risk from a unique and identifiable perspective.
DISCLAIMER: For educational purposes only. This is not a solicitation to buy or sell commodity futures or options on neither commodity futures nor an endorsement for the purchase and sale of an ICO, Crypto currency or any digital asset and should not be construed as such. The risk of trading securities, futures and options can be substantial and is not for everyone. Such investments may not be appropriate for the recipient. The valuation of futures and options may fluctuate, and, as a result, clients may lose more than their original investment. Nothing contained in this message may be construed as an express or an implied promise, guarantee or implication by, of, or from the author Mike Agne owner of Magnelibra Capital Advisors LLC (MCA) and the website blog, which can be found at www.econemotions.com. All rights are reserved. We will never claim that you will profit or that losses can or will be limited in any manner whatsoever. Past performance is not necessarily indicative of future results. Although care has been taken to assure the accuracy, completeness and reliability of the information contained herein, (MCA) makes no warranty, express or implied, or assumes any legal liability or responsibility for the accuracy, completeness, reliability or usefulness of any information, product, service or process disclosed.