

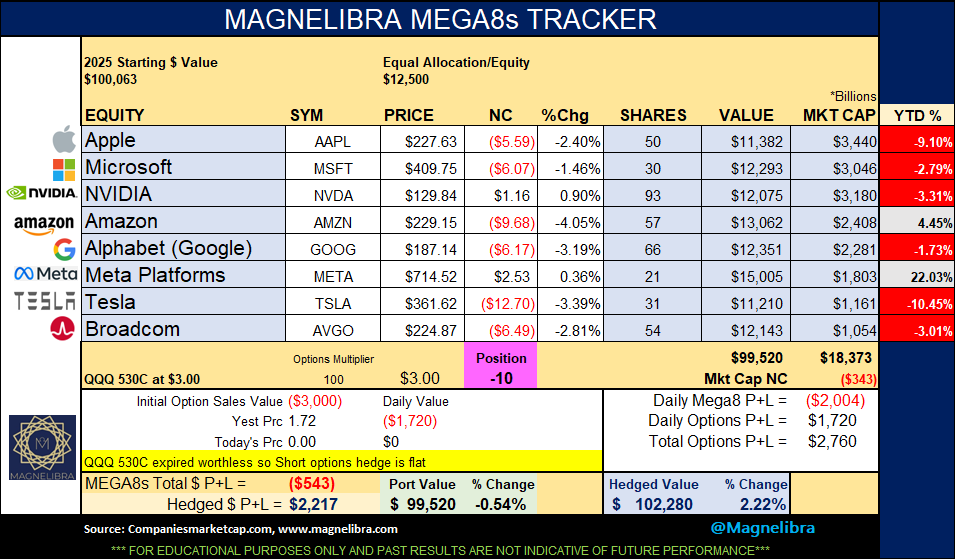
Alright subscribers and new readers, this is just a quick post here before Sunday is out. A couple of quick data points that we wanted to cover to make sure that our readers have all the knowledge they can when they attend any Super Bowl festivities with family and friends. Let’s just go right into the MEGA8s data where we now see 6 out of the 8 are negative on the year. META is the clear standout +22% and Amazon up 4.45%. The hedged basket is now outperforming as this group as a collective have underperformed so far this year:
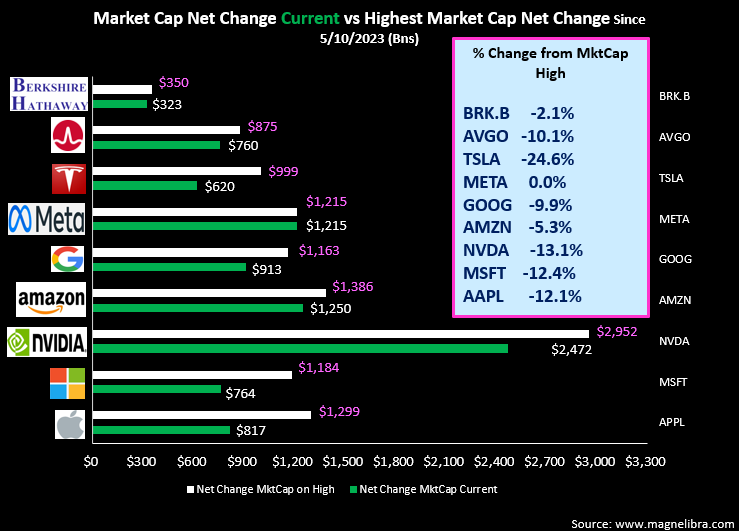
We started tracking this grouping in early May of 2023 and as far as the individual stocks vs their overall market cap highs we can see that 6 of them are essentially down double digits from their respective market cap highs, with Tesla leading the drop -24.6% thus far based off their highest daily close:
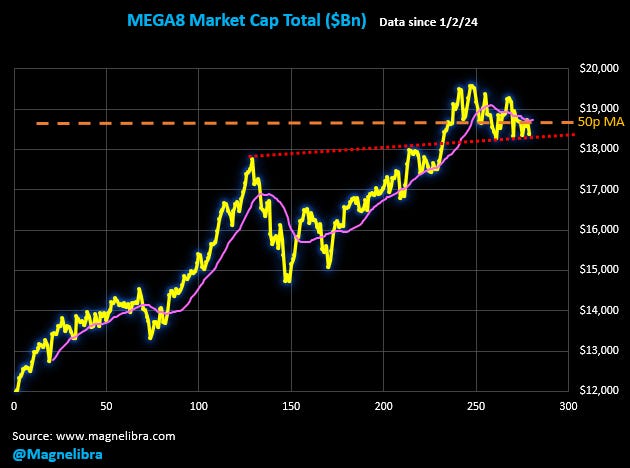
When we look at the overall market cap data of this group, let’s just say a break of this red dashed line would not be good!
Ok we wanted to look at a couple of other important data points that have to do with inflation and how to look at it correctly. The great Milton Friedman correctly stated back in the late 70s that “INFLATION IS EVERYWHERE AND ALWAYS A MONETARY PHENOMENON.” He went on further to explain it this way, “INFLATION ARISES FROM ONE PLACE AND ONE PLACE ONLY, WASHINGTON DC.” This is also a very true statement and we see it both in the form of fiscal congressional inflation via stimulus, subsidy or deficit funded spending and we see it more so consistently from the Federal Reserve itself.
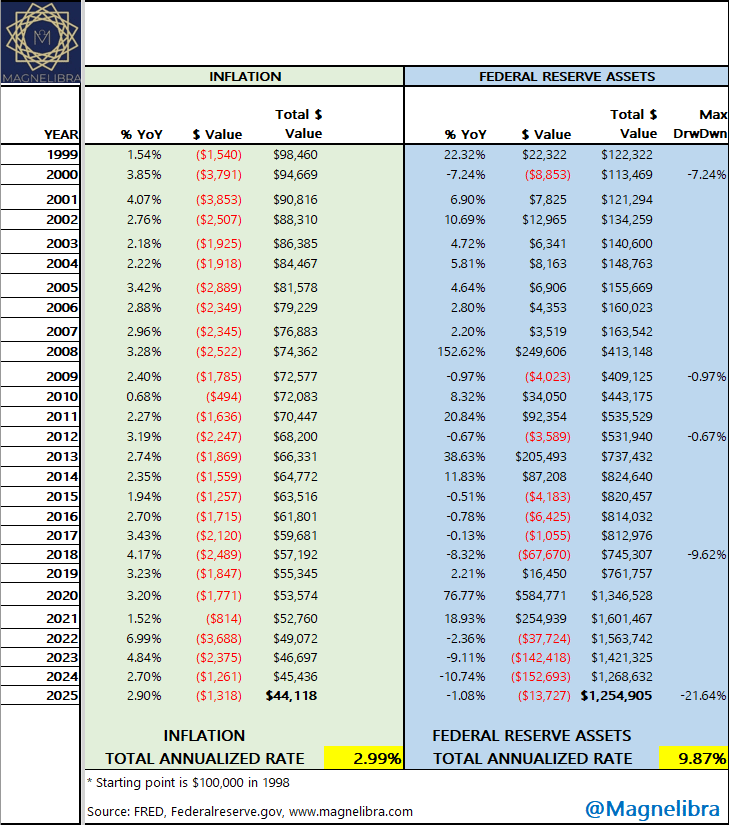
When we look at the Federal Reserve, the inflation is embedded within their “asset” base accumulation and expansion. For the last 27 years this asset inflation has run at a massive 9.9% inflation rate as demonstrated here:
To further Magnelibrite understanding of inflation and to put this nonsensical theory that higher rates leads to lower inflation, we present this next chart. Magnelibra for quite some time has considered the modern day QE economy nothing like past economic and monetary economies. This is completely different than traditional organic economic supply and demand driven economies. Today’s economy is a function of global central bank shadow bank liquidity by which derivatives are created and dominate the funding sources globally. This financialization is why most of our modern era has been spent in ZIRP or the Zero Interest Rate Program led by the central banks themselves.
This low artificial rate construct leads to massive misallocation of both resources and capital and will at times lead to very large and unannounced bouts of inflation, like we had post Covid!
Anyway the goal with this next chart is to show you just how INFLATIONARY higher rates are now, especially when we consider the massive increase in commercial total deposits. What you will and should take from this chart is that since 2019 we have seen a 23.5x increase in potential net interest pick up from the risk free rate crowd. The difference is during a ZIRP era with $13T in total deposits, the potential total annual risk free net interest was an estimated $32.5Bn. Now fast forward to today, where some $18T in deposits exist, yet with T-Bill rates averaging 4.25%, this comes with a hefty risk free net interest potential of $765 billion dollars. This figure is HIGHLY INFLATIONARY and is being used to soften the blow of the leverage purge that we see ongoing throughout speculative commercial real estate and other global property and investment markets. Here is the chart:
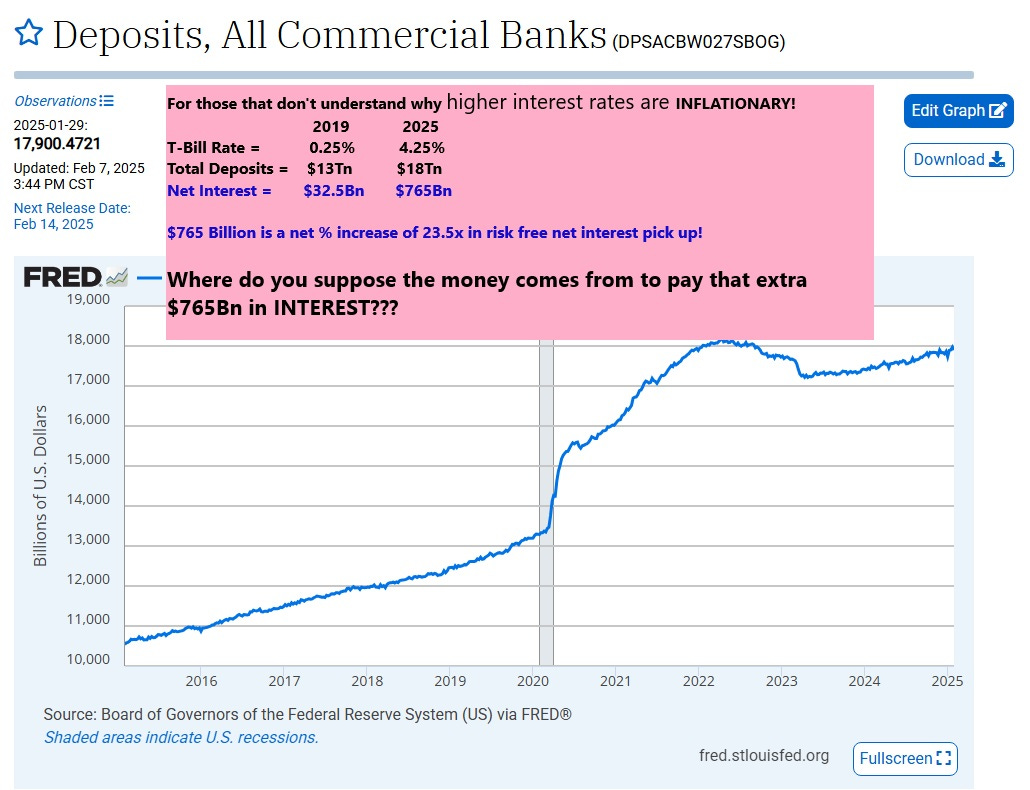
Alright so that was a quick lesson for today, so when your friends tell you higher rates will stop inflation, understand the data we just presented and ask them where all the money comes from to pay for all that net new interest that is being created!
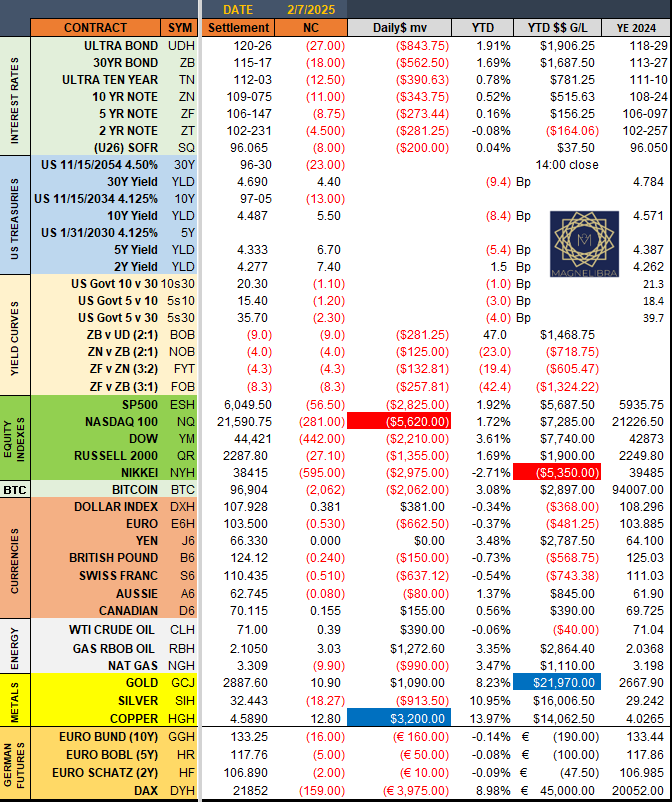
Ok onto the settles from last week its very interesting that the SP500 and Nasdaq futures settled withing a few ticks of our big pivot numbers as Friday saw a decent risk off day in bonds and equities:
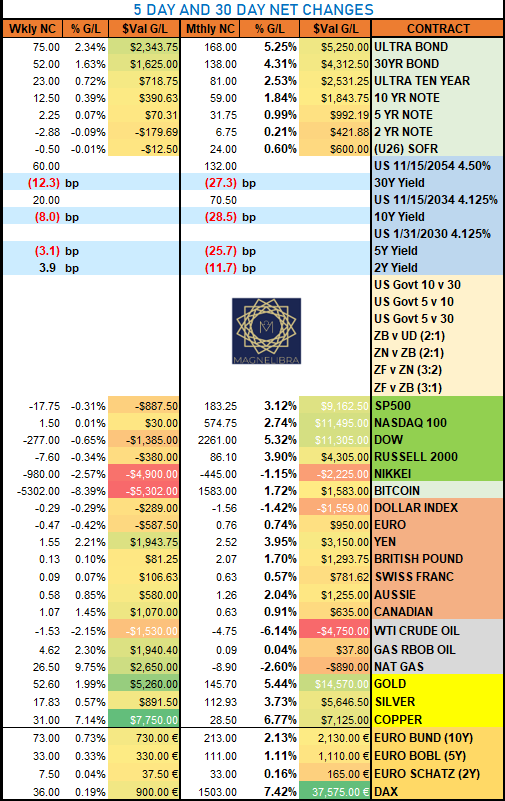
The Dax, Copper and Gold are leading the 30 day net change percentage wise:
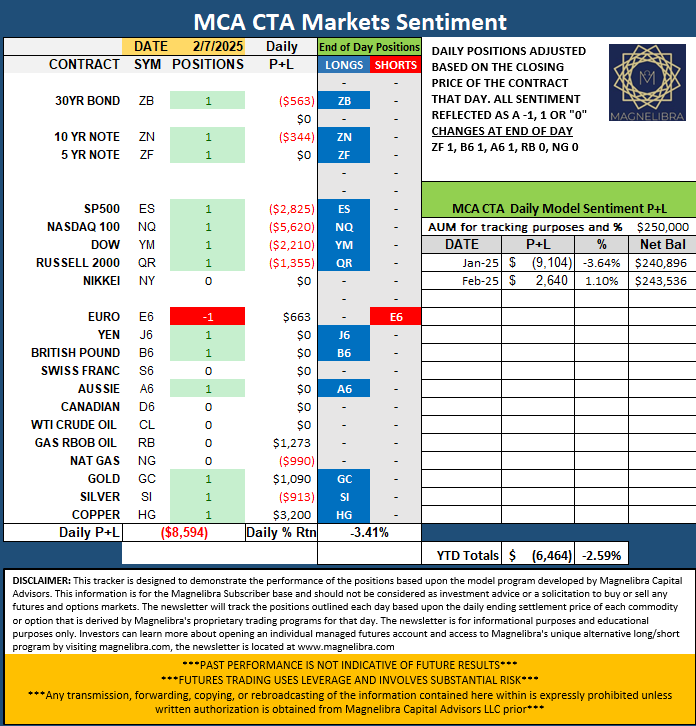
As far as the MCA CTA Markets Sentiment here is the data and changes as of end of day Friday:
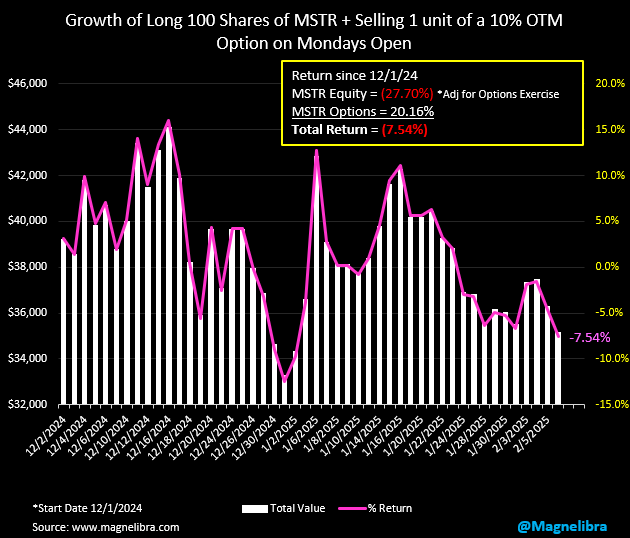
As far as the StrategyB data its down 7.54% since Dec.1 2024:
Ok that is it guys, we hope you learned something today, we hope you guys have a great week and we hope the Eagles beat the Chiefs and the Refs tonight! President Trump is expected to attend the Super Bowl which is a presidential first, who will get more screen time, Trump or Taylor Swift!!! Anyway we always look forward to the commercials to see who will have spent the best $7m this year! Ok guys please like, share and if you are financially able support us below via BTC or subscribe to our letter and receive the kind of knowledge that will set you apart from everyone else! Till next time…cheers.
Support directly to our BTC address: 3DvDvPnjwu5Fd6sagAYmiFXA2fPkjJf2cp