


Good Evening Traders and Investors and thank you for joining me for another edition of the Magnelibra Markets Podcast, I’m your host Mike Agne and today’s episode #35 is entitled “MEGA8s Reaching Significant Technical Levels and Time for Nvidia Puts?”
Quick Disclaimer: The following podcast is for educational purposes only. This is not a solicitation to buy or sell commodity futures or options. The risk of trading securities, futures and options can be substantial and may not be appropriate for all listeners.
Ok so we apologize again for the bad data that was put out yesterday for our MEGA8s, we did correct it in the post today and in the show notes of the podcast for yesterday. We know its a big deal if we put out bad data and we do try our best to be perfect with it, but sometimes, we are human, but we do apologize.
Yes we did rush it a bit as we wanted to get it in before the Super Bowl but now we know its best to be accurate than to rush! Honestly Super Bowls are over rated anyway, I find myself critiquing the commercials more than the game, as if the NFL was not going to let KC and Team Swift win! Just add more fuel to the fire of all the folks that believe the NFL is somehow rigged. We won’t formulate an opinion on that, but rather we know the NFL is big on marketing and having Taylor Swift in your corner, well that is an enviable position. So we put the Nickelodeon channel on for the young ones to watch the game with their friends and to be honest, we actually enjoyed the work they did, interactive and explaining things so well done on that front, but honestly it all really seems so overhyped, but that’s entertainment sports, people want a break from reality, want a reason to come together and its events like this that offer that opportunity so for that reason and that reason alone, should suffice and quiet all the haters of the hype. Alright now on to the markets.
So the markets get their first dose of real data this week with the CPI report tomorrow. The market is looking for a Core CPI YoY at 3.7% so it will be interesting to see how far below this number does come in. We are not looking for a higher print here as you know we believe that the FOMC is closer to cutting rates than many believe. Yes we know the equities are on their highs, but we also know its on the heels of just a few equities. We also know that FOMO has gripped everyone now and nobody believes the markets can ever come down and that has us a bit worried. We never liked the complacent crowd, the over confident crowd and that is what level we seem to be at. Yes our model tracker is even bullish across the board and ultimately in the long run this is the way, but there are times where it seems to easy to be a certain way and that’s usually when a correction occurs. We figure we will get some sort of pull back eventually, but as has been the case so many times before, its just a brief encounter, a quick discount to just jump right back in on the back of the next bull move.
Anyway CPI should provide some insight for the FOMC as to whether or not inflation is moving down fast enough to warrant a cut in rates. We know CRE is murdering small regional banks and that this is a thorn in the side of capital leverage. We believe this is a bigger deal than the FOMC wants to lead onto, but its a topic that continues to come up and when you have 60% and 70% fire sales, well lets just say, contagion spreads and it spreads quickly. Buyers start to offer only at steep discounts, lending is virtually non existent and cash only buyer types won’t even post a bid because they want to see just how far things can get discounted.
We will stick with our thesis that we will not expect a major equity down move until the FOMC begins cutting rates, we will not deviate from that call but the closer we come to that moment, we would suspect we will at times get some real down drafts in selling, its just that 2024 hasn’t seen one yet, but it will show up sooner or later.
Ok so as far as today, the settlement sheet is showing 3 days in a row here for your convenience and viewing:
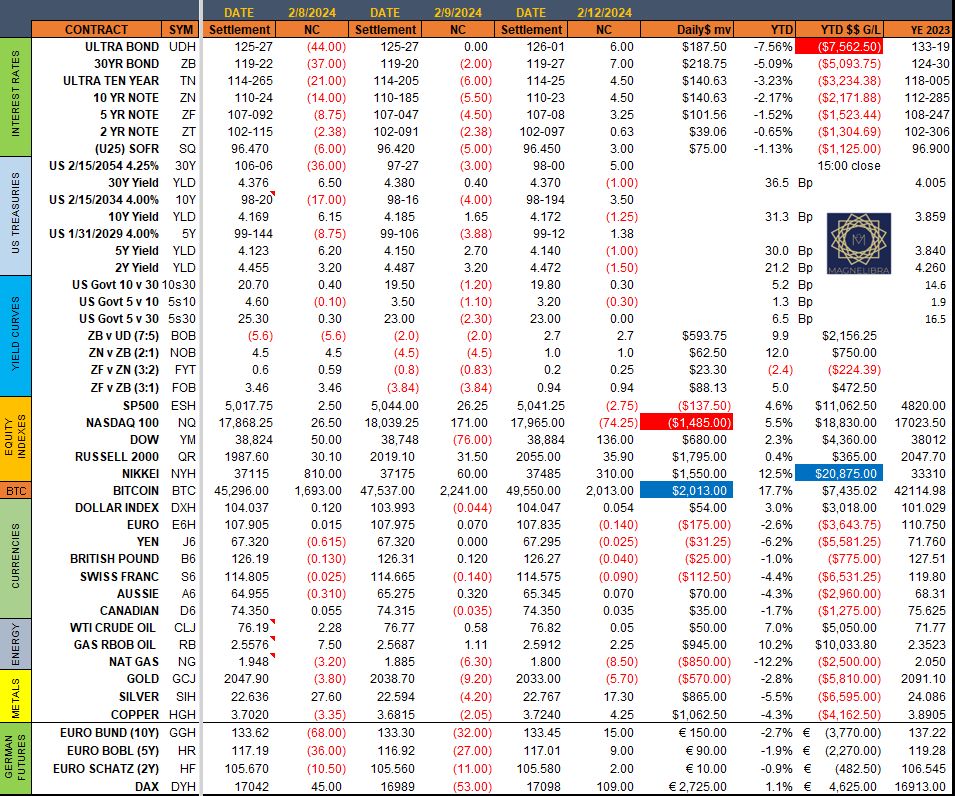
The bond markets the last 2 days have been pretty muted but overall not a good start to 2024. The equities today were led by the R2K and Dow with the Nasdaq a rare weak link. Bitcoin posted another run above $48K briefly trading above $50k and everyone is all bulled up on this here for now, we still believe $43k is a good average proxy here and don’t ever like to chase on these up moves. The next resistance there is $57k which is a major longer term target/reversal area. FX was down slightly and Crude continues to flirt with the $77 area while gold was the weak link in the metals land as Silver and Copper were both higher.
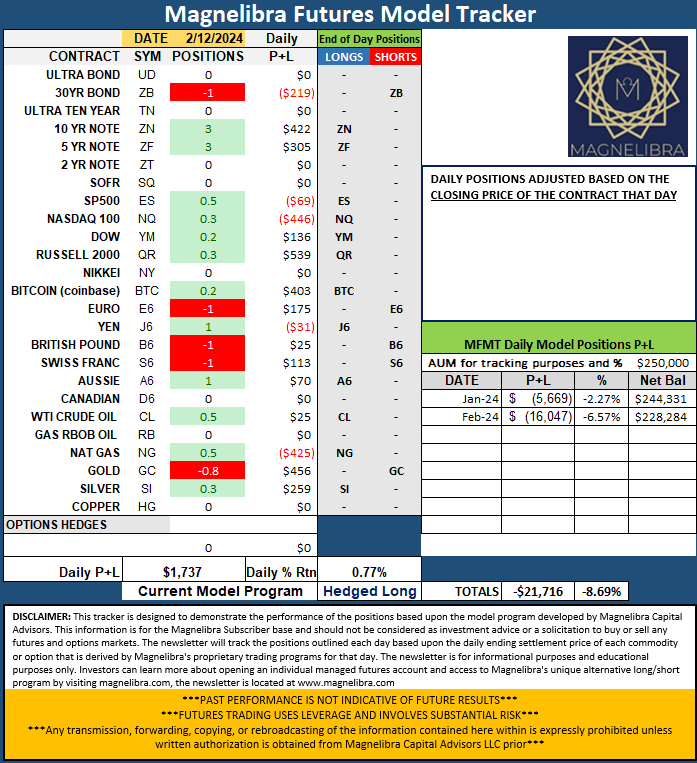
As far as the Futures Model Tracker it continues to claw its way out of the hole here and continues to favor the overall long in the front end of the US yield curve and minor all long in the equities, mixed on the FX and close to closing out NG position which will do so on another weak close tomorrow:
When we look at the MEGA8s Nvidia and META the only ones higher today:
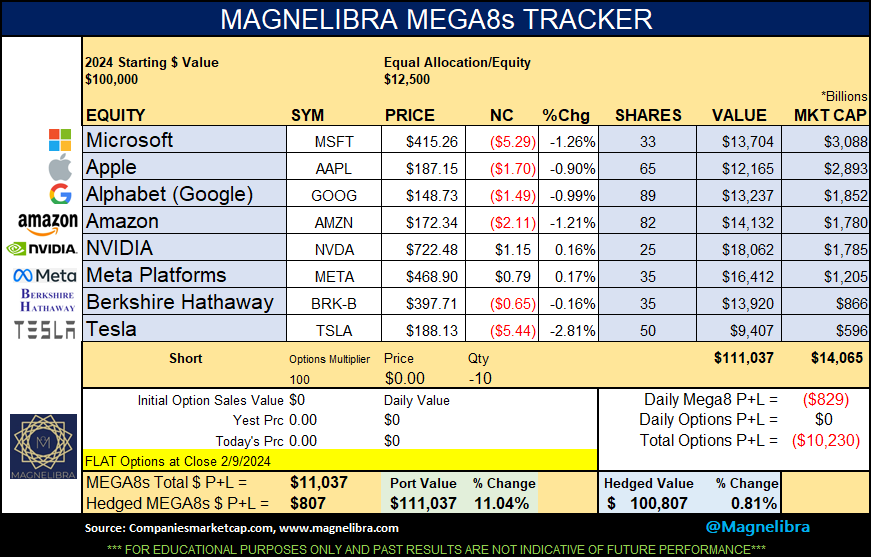
For now the package continues to hold near the $14T market cap and its interesting to note that Nvidia did pass Amazon today!
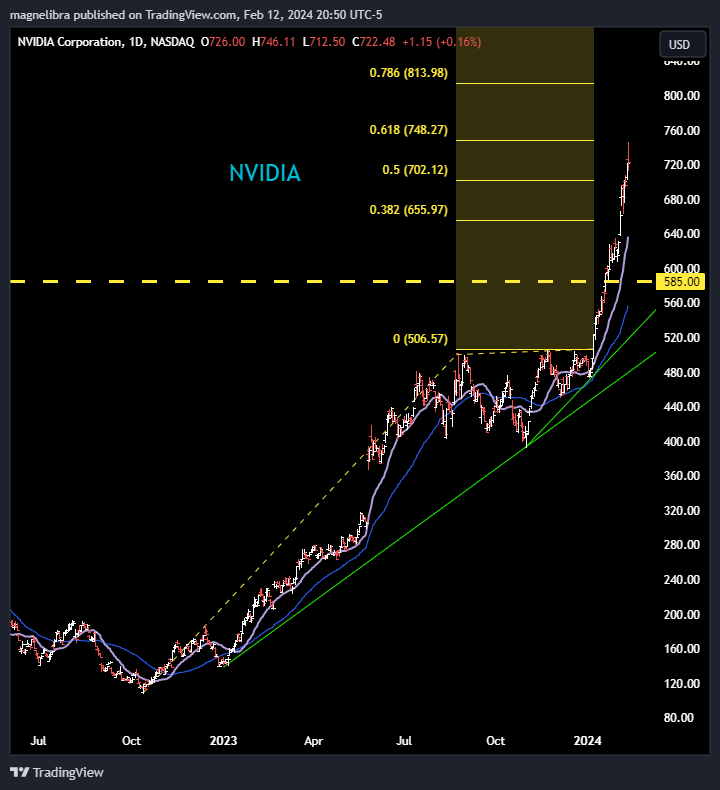
When we look at Nvidia, the rejection from the $748 area seems very formidable and maybe we will get some snapback selling here over the next few days. The 2/16 expiration $710-690 put spread is trading around $5.30 so a decent 3.8:1 payout structure. When we look at the chart we can see that the fib 0.618 extension was rejected here and does seem to be showing signs of buyer exhaustion:
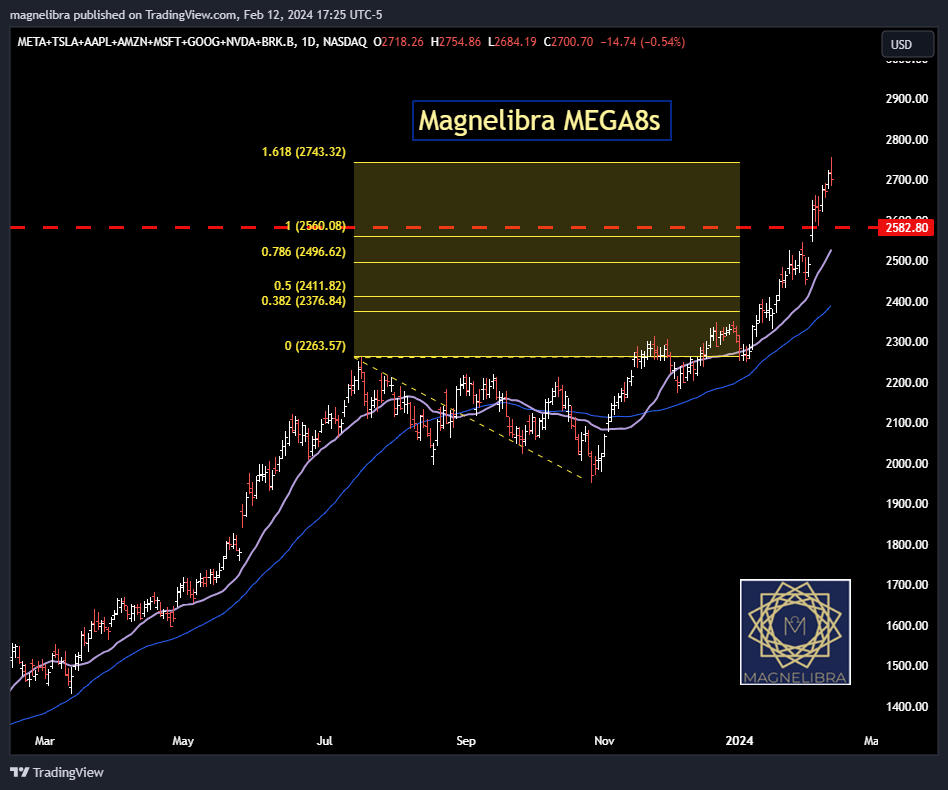
When we look at the entire MEGA8s, we see the same extension area reached and rejected. What does it mean if anything at all? Well we believe there are times when bull markets get a bit ahead of themselves and technical levels do have a way of giving sellers decent target prices and outs, so maybe we have reached a significant enough threshold to where a few players will now step in and let go of some supply here:
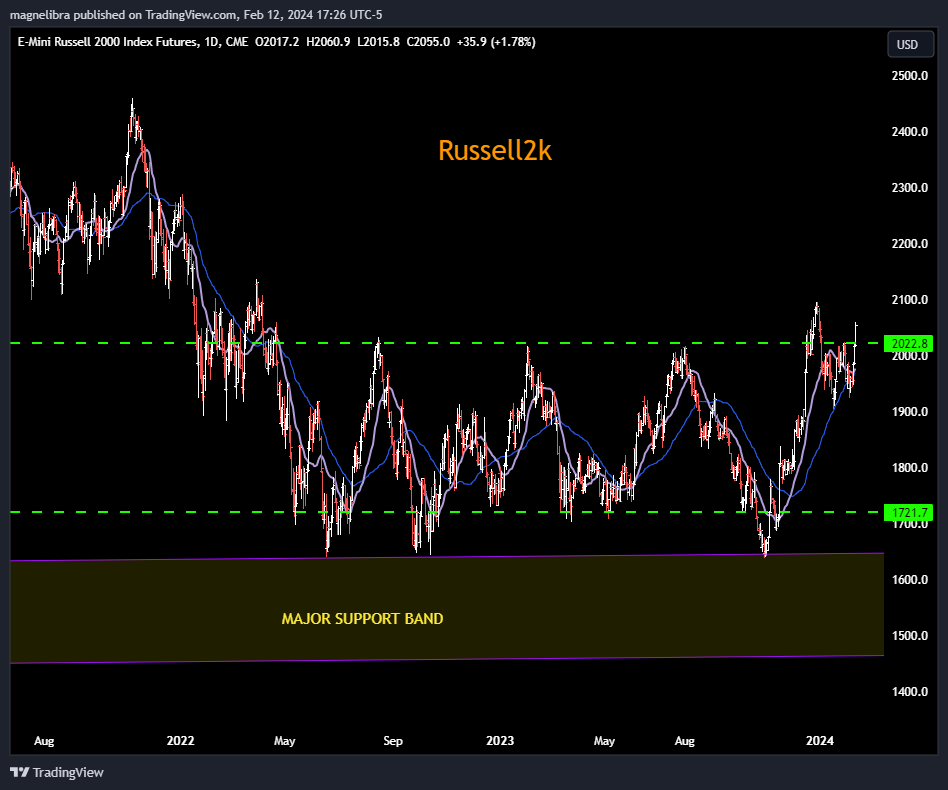
Two other technical charts we have are the R2K and the Nasdaq futures. First up the R2K you guys know we have that 2022 pricing level as our key upside area, well the R2K blew right through marching all day higher and higher. A close back below will recycle things back down but for now the daily is bullish:
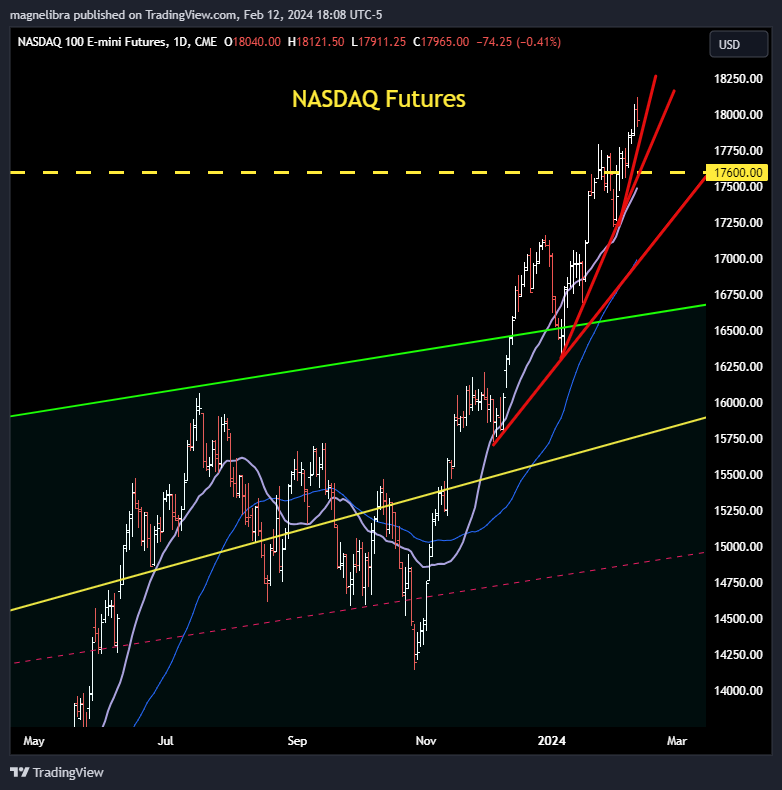
The Nasdaq futures depict an absolute FOMO technical picture. You can see the red base line support lines getting steeper and steeper. Our firs sign of breakdown will come on a daily close below 17850:
Ok that is where we stand, we are cautious bulls here in equity land, cautious front end longs in fixed income US treasury land and minor bearish on FX and Gold. Risk assets are well bid and well bulled up and that is a tough tide to swim against. We know the path of least resistance always seems higher, one of the toughest things to do is always buying new highs, because a typical traders mentality will be this time I will be wrong, but in actuality all you are doing is going WITH the TREND something that is very hard to do, especially when you are quite often always buying new highs. However as time and time again has proven, this strategy has been the right one, but not for the reasons many suspected. Buying new highs has been led by just a few names and we know the overall market has not participated in this up move and that is what makes staying long so difficult. Fundamentally the market breadth is always working against you!
Ok guys that is it, take a look at those Nvidia options see what you think if you are long and have been long, well continue to move your stops up to protect your gains. Yes we know the markets haven’t come down in quite some time but that doesn’t mean you shouldn’t be a prudent investor or trader and protect yourself. Ok be on the look out for that CPI number as it will move things.
Till next time, thank you for staying with us, thank you for supporting us and if you can please share our work with others. If there are topics you want to discuss or something you think we should do differently than please leave a comment!


