
MEGA9s 21pMA Looming, Weakness Showing Up
Subscriber Data Sept25

Well if you believe the Q2 data for GDP and if you believe the PCE data well then the FOMC is in for a tough go because its very difficult to explain and justify cutting rates if the economy is chugging along and inflation is to remain stick. However as you guys know, inflation now is being nurtured by higher rates by the risk free interest uptake and transfer from the govt. sector to the private sector. This buffer goes a long way in paying for levered losses across various industries and sectors. Ultimately we believe the data will start to prove the FOMC correct in their risk assessment and we are in that camp firmly. We do not however envy their position because we know it will be very difficult to normalize the massive wealth inequality that undoubtedly will increase the calls for Socialism in this country.
Anyhow we can see that risk assets are and have been under pressure this week and this may just be the start of something nobody expects or ever thinks can happen, investors taking profits and markets losing steam.
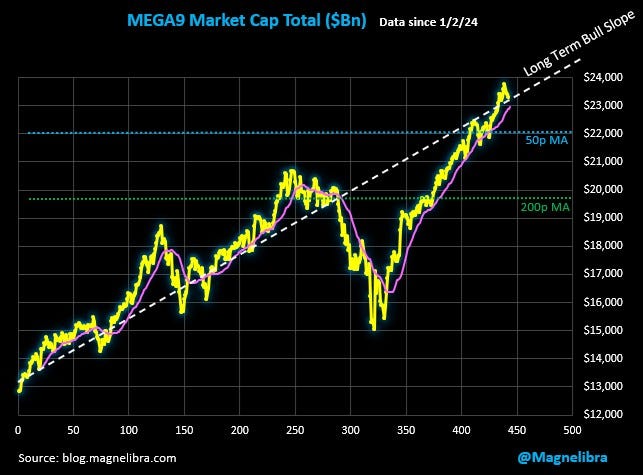
The first indication of trouble will be the total market cap chart of the MEGA9s dipping its toes below the 21pMA shown in pink in the chart below. We like the break above the long term trend bull slope line and now we are threatening to break back below it and test the 21pMA as well:
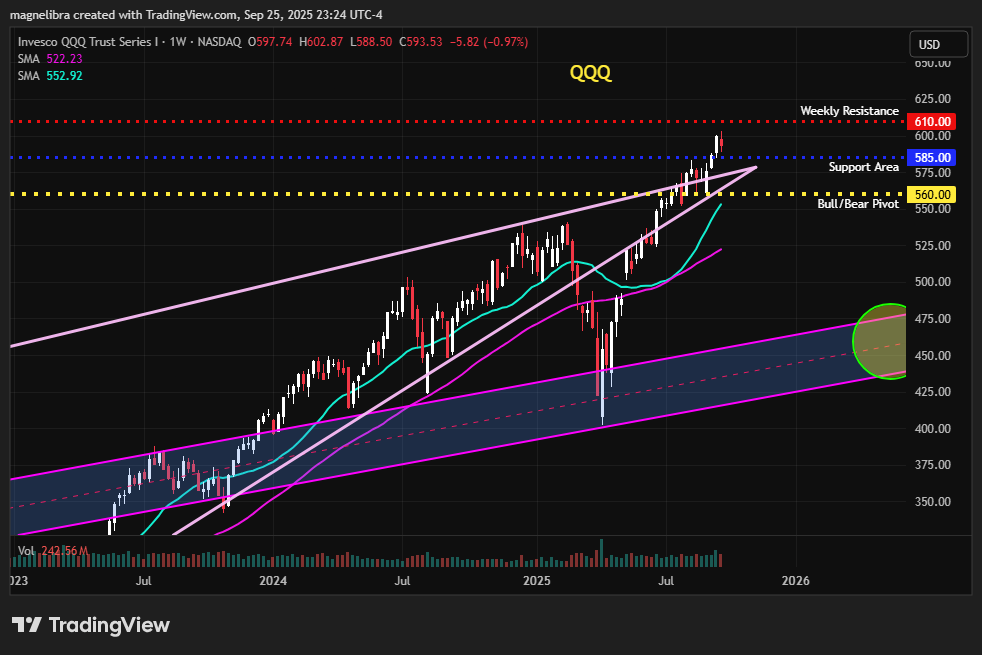
As far as the QQQ ETF, this week has seen profit taking in some of the big names and technically a close below 585 would be very damaging now:
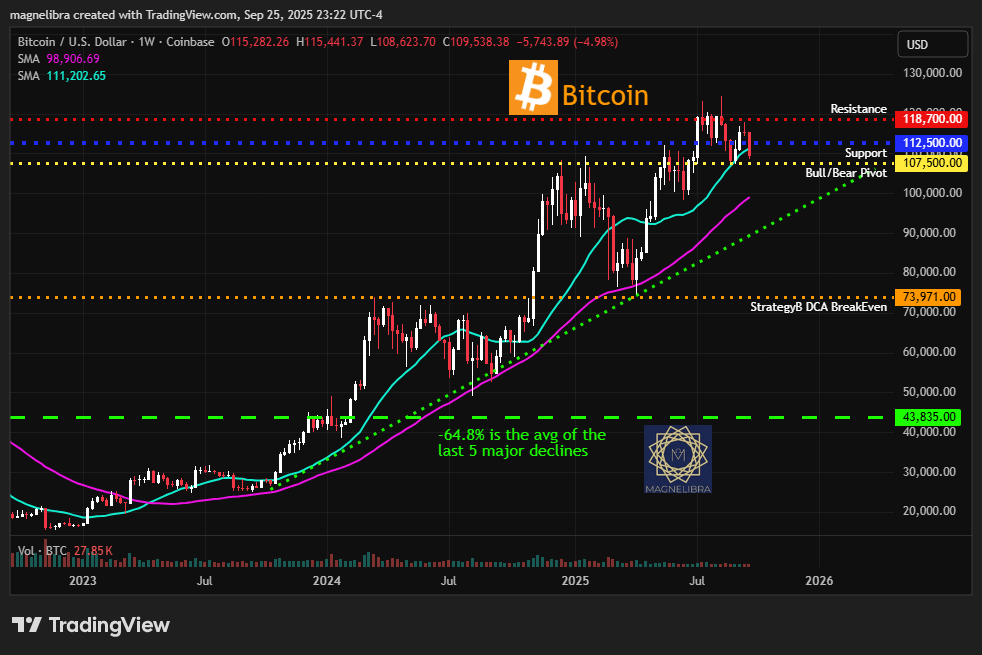
There are also cracks forming in the Bitcoin market as $112500 has once again given away and $107500 should start to put more pressure on the BTC Bulls should that level give way next:
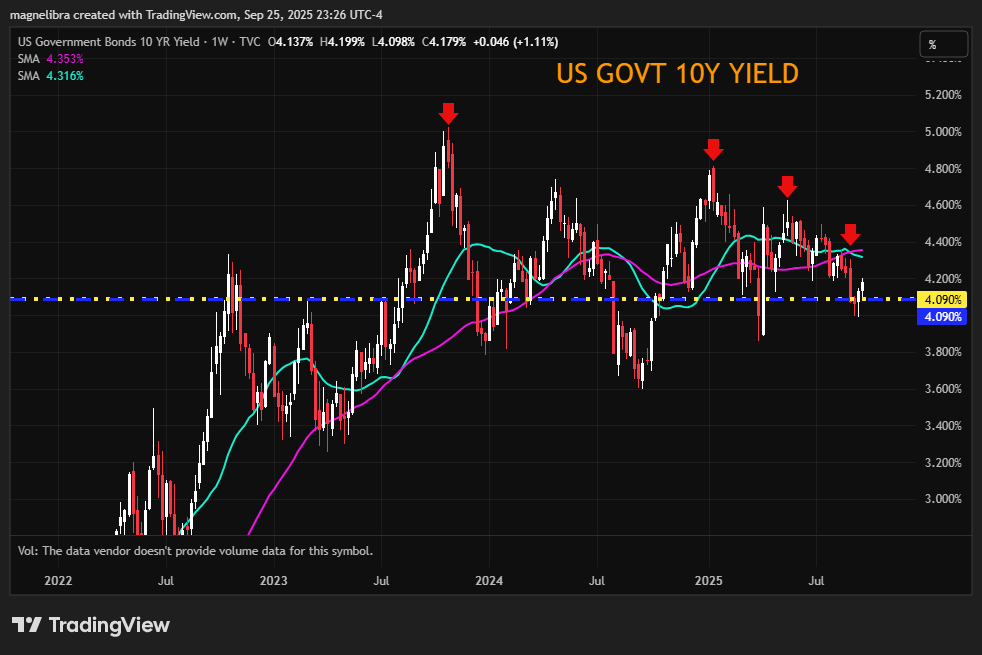
The US Govt 10Y has also risen back above the all important 4.09% level and the bond bulls will have to regain their momentum by trading back below, but for now, sellers seem to be hitting the bond markets as the data is proving to be problematic:
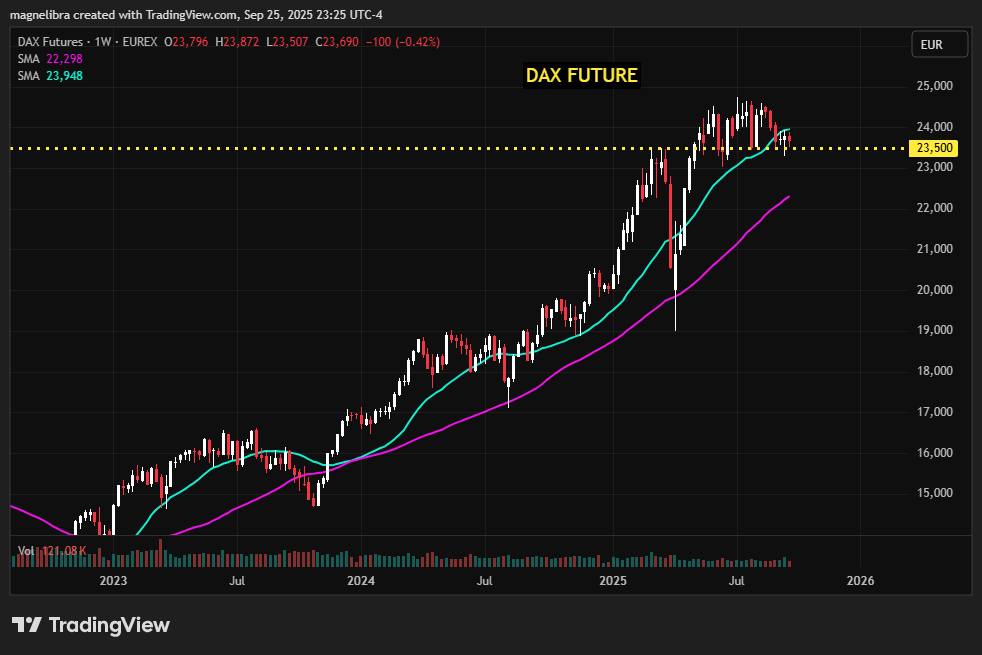
Another chart we are keeping an eye on is the Dax Futures, 23500 is huge a weekly close below there and we will expect to see systematic and program selling occur:
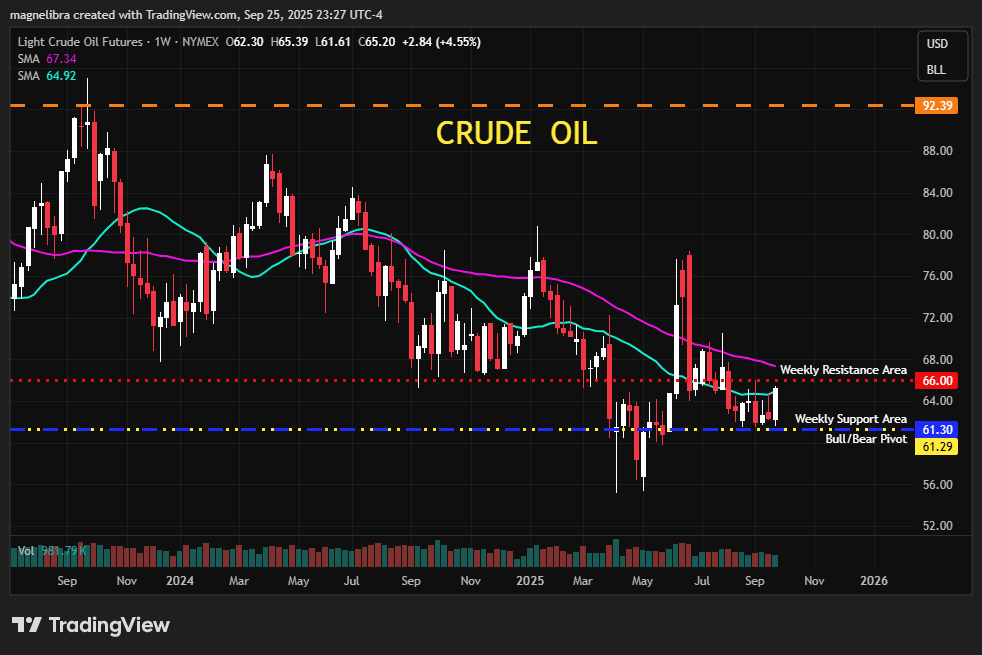
Crude Oil putting in a solid performance this week! Above $66 should make things interesting:
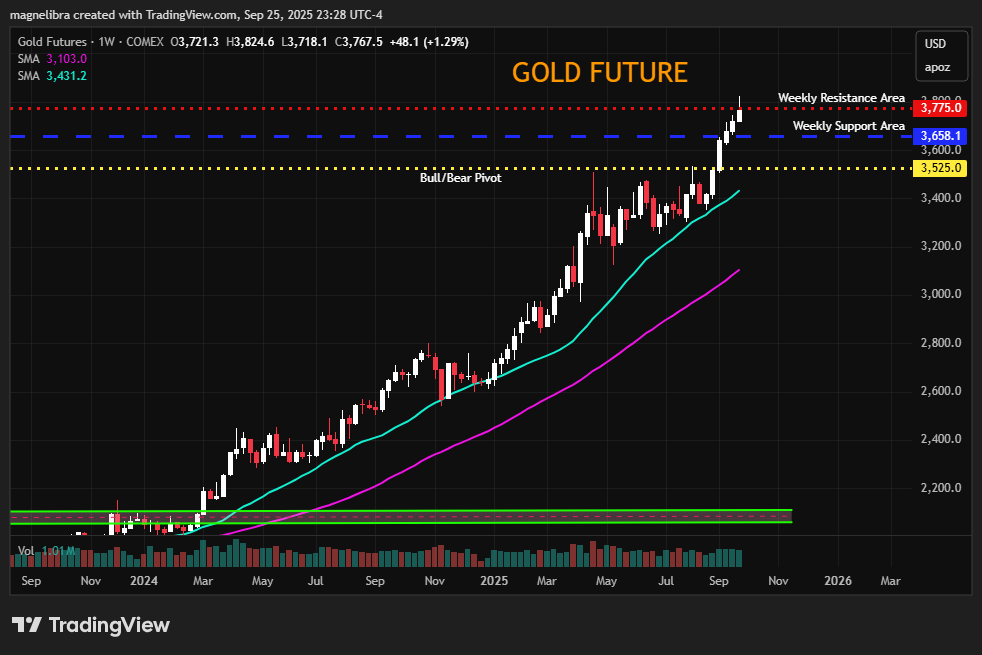
As far as the Gold futures, the $3775 area is key this week and let’s see if we close above or below to set the tone for next weeks move:
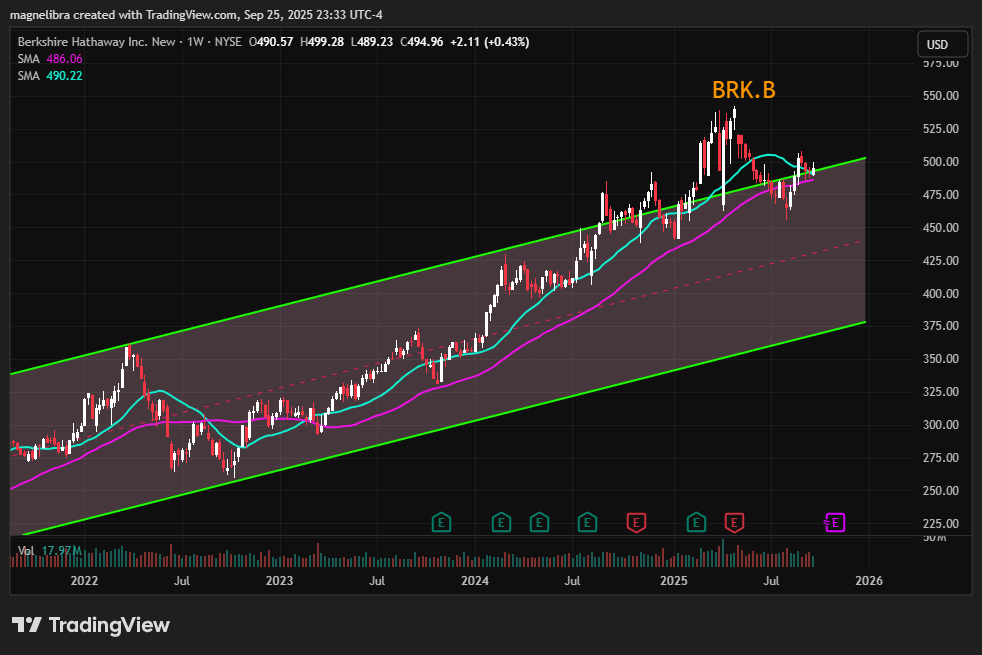
Berkshire is putting in a very clean technical set up here, we have the potential for the MAs to cross, and a deeper probe back into the long term trend channel:
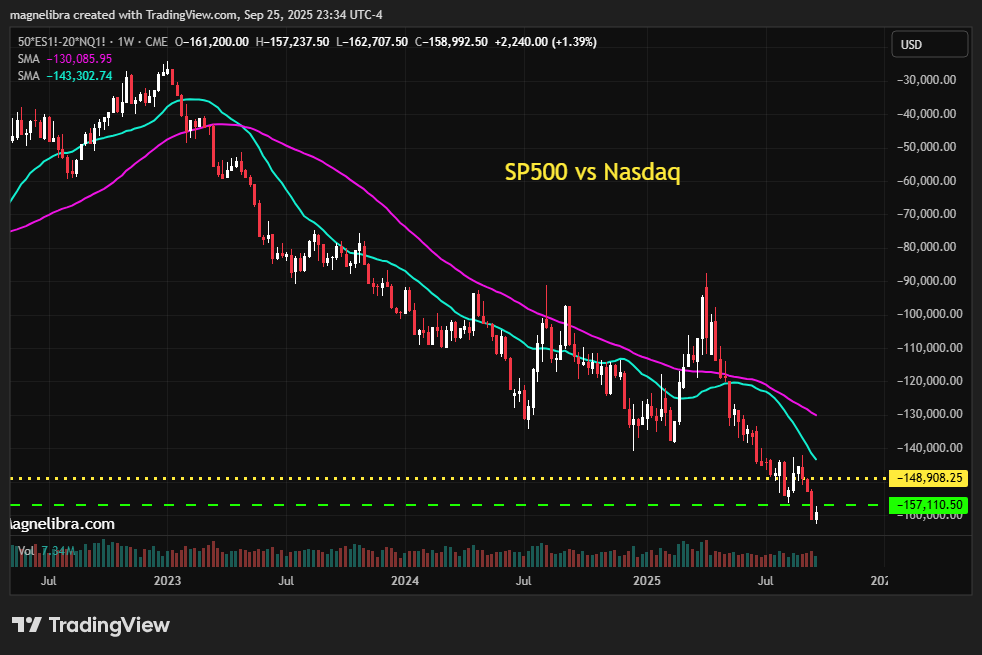
We are also seeing the SP500 outperforming the Nasdaq in the futures spread this week which is also a good risk off indication:
Alright let’s move onto the Magnelibra Subscriber section with all our data for the markets that we cover. We hope that those of you who do not support our work will decide to assist in our endeavors to educate the masses. We feel the data and analysis that we do goes a long way into furthering the overall understanding of the financial markets, what moves and drives them and how to actually analyze them properly. We aren’t hiding the subscriber data behind the paywall today, so you get a better glimpse of the overall data that we do provide.
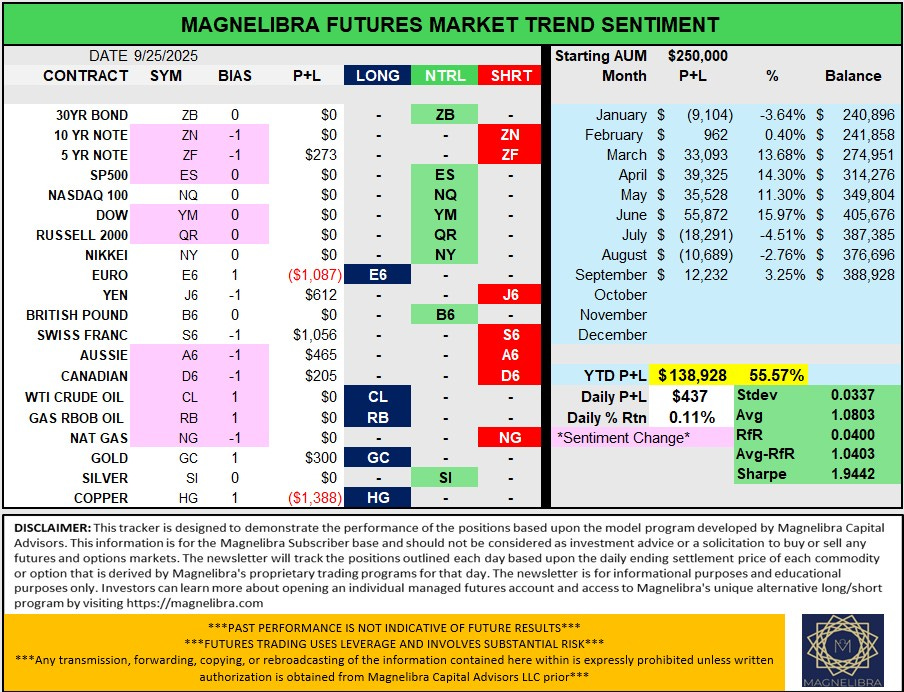
Magnelibra CTA Futures Market Trend Sentiment (Our proprietary commodity trading advisory futures market sentiment long/neutral/short market flows indicator) The portfolio is made up of the core futures markets we cover and the indicators are for single contracts of the futures market, whether long, short or zero neutral. The P+L is generated via the starting daily position and the ending daily settlement. This is considered a high risk alternative strategy. However most investors should leave a portion of their overall portfolio within a high risk basket. Some of the percentages of the overall portfolio dedicated to high risk should vary from 3% to 18% depending on ones overall time to invest and risk profiles. We added the Sharpe to our data now as well for those quantitative types!
NOTABLE CHANGES:
Move to “1” Long Bias: Crude Oil and RBOB (CL, RB)
Move to “0” Neutral Bias: SP500, Dow, Russell2k (ES, YM, QR)
Move to “-1” Short Bias: Ten Yr, Five Year Notes, Aussie Dollar, Canadian Dollar and Nat Gas ( ZN, ZF, A6, D6, NG)
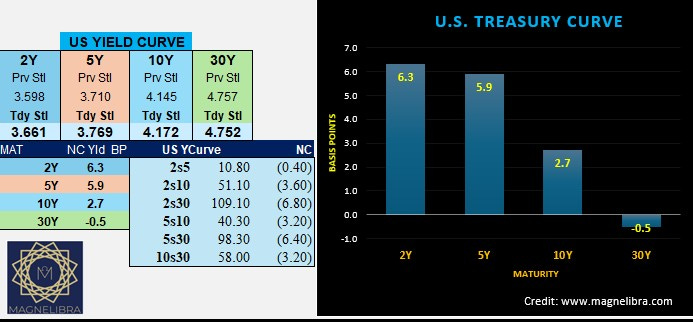
The U.S. Bond Yield Curve (This is our daily graphic displaying the U.S. bond market yield curve changes. We follow the 2 year thru 30 year durations. Please note that bond prices work inversely to yield changes so for instance if bond prices are rising and moving upward, then their yields are falling or moving downward. We also track the relationship between the durations known as US Yield Curve Spreads, when we list it as 2s5, we are comparing the yield differential between the 2 year vs the 5 year with the positive/negative viewed from the higher durations perspective.
Today’s bond curve continues to see the yield curve flatten post FOMC, guess a few players are calling the FOMCs bluff for more rate cuts!
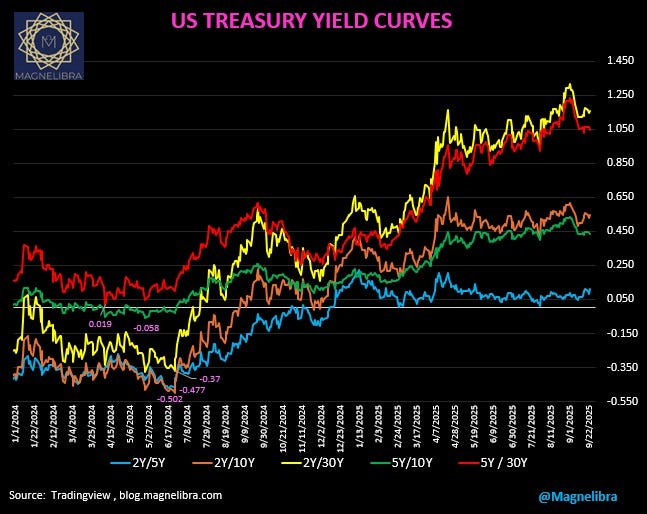
Here are the US Bond market overall yield curves of the various durations from 2 Years out to 30 Years:
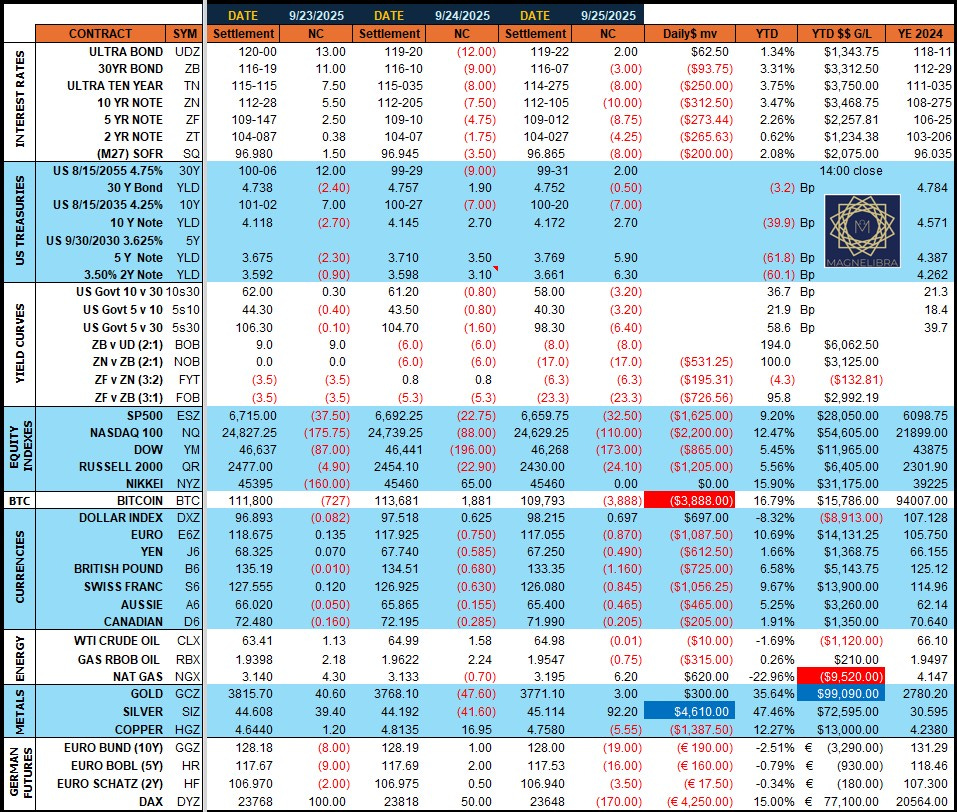
Daily Settlement Sheet (Magnelibra’s Futures and Cash bond market coverage of the daily settlement prices and dollar value of the contracts given move)
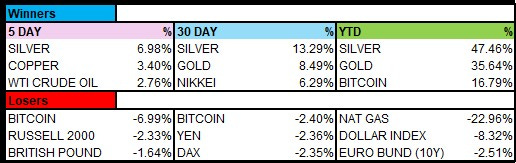
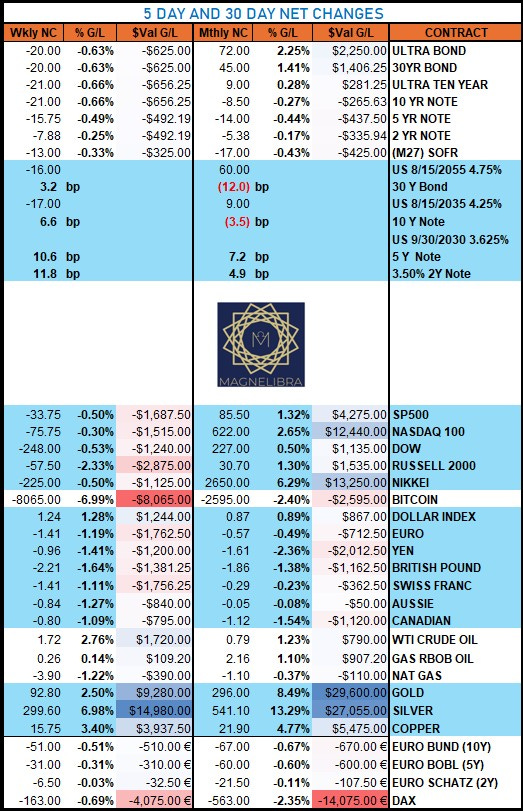
The 5 & 30 Day rolling changes with top 3 Winners and losers (The last 5 trading days and 22 trading days net changes)
Silver, Gold and Bitcoin the YTD winners but Bitcoin is -7% on the week thus far:
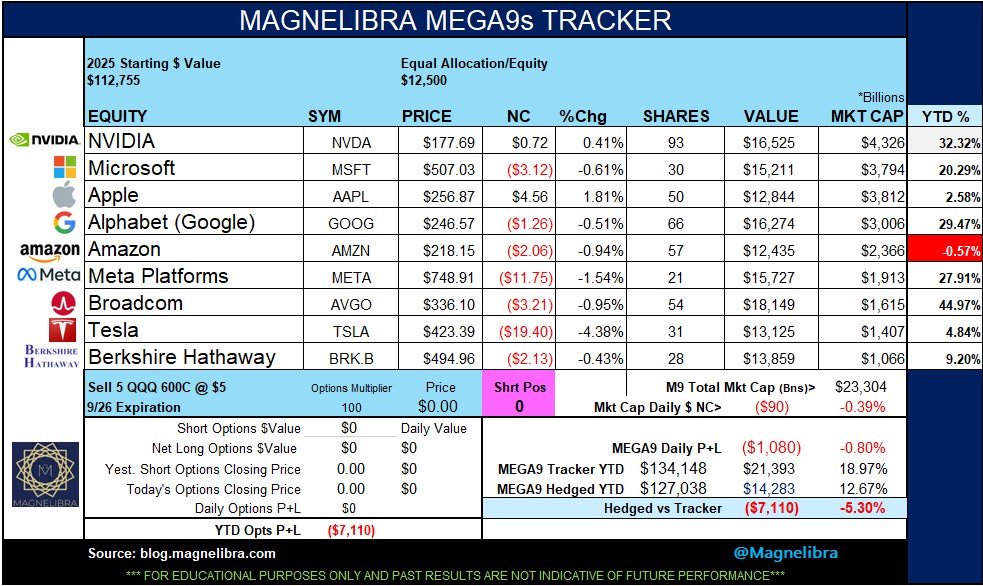
Magnelibra MEGA9s Portfolio Tracker (This is a synthetic long only portfolio of the Top 9 largest equities by market cap. We started this tracker because we understand Ai dominates the investment landscape and operates in a binary construct. What we mean is that it issues a buy or a sell and will do so in reinforcing mechanisms, meaning if alpha is rising it will add, if it is falling it well sell and remove. We also created a “hedge” for those that want a more active approach to tactically maximizing their long only static portfolio of equities)
The MEGA9s continues to struggle this week and we missed the 605 call hedge earlier this week but if there is a bounce, would short the 600 Call at $5 or greater for tomorrow. Apple and Microsoft vying for the 2nd spot, lets see how the week settles out:
MEGA9s total market cap chart (This chart represents the total market cap of the MEGA9s and lists the 21pMA in pink along with the 50p and 200p MA)

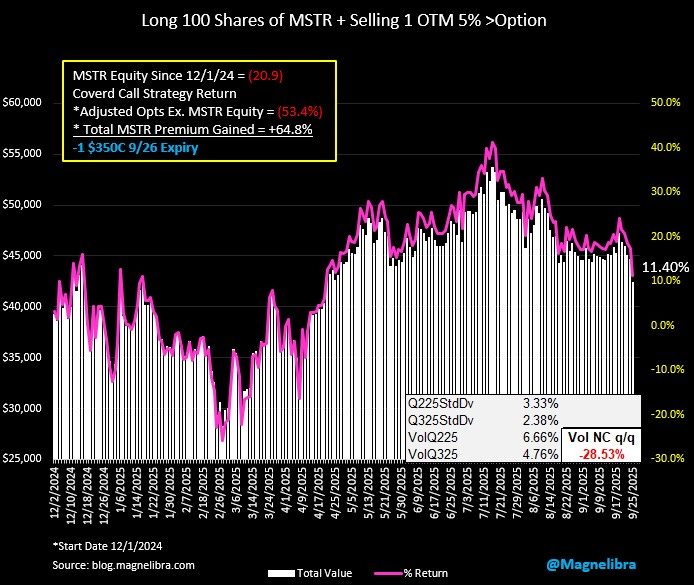
Strategy Inc / BTC Trading Tracker (Bitcoin vs MSTR equity, Our Strategy Inc. Covered Call Portfolio Tracker, Long 100 shares MSTR and short 1, 3% to 7% out of the money call on Monday’s open each week)
The MSTR call strategy short this week is the $350 Call and MSTR was hit hard today -7%. Since we started tracking this data MSTR is -21% outright but our call selling strategy is +11.40% overall. For those playing along at home, please note, this long MSTR strategy that incorporates a short covered call hedge is something you cannot pick and choose to do one week to the next! This is a mandatory weekly hedge vs your long holdings. Volatility continues to get stripped out and crushed, buying Bitcoin outright vs MSTR is always the preferred exposure, if you were wondering:
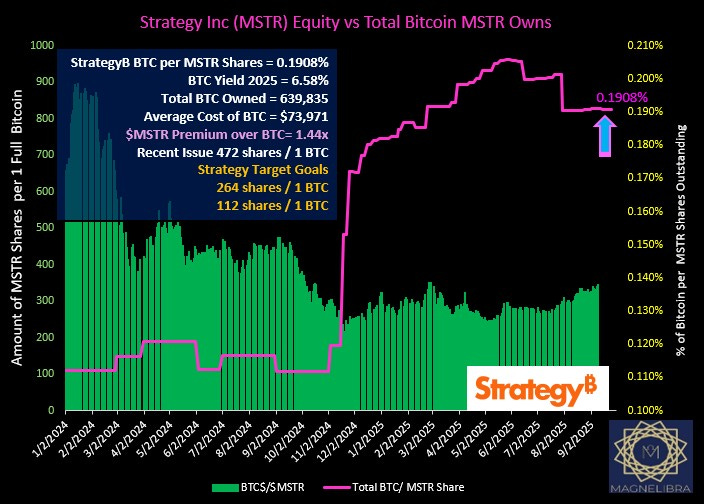
New BTC purchases this week for Strategy, the new stats are as follows:
BTC/MSTR shares = 0.1908 and Total BTC owned = 639,835 and the dollar cost average = $73,971 with the premium metric collapsing to 1.44x:
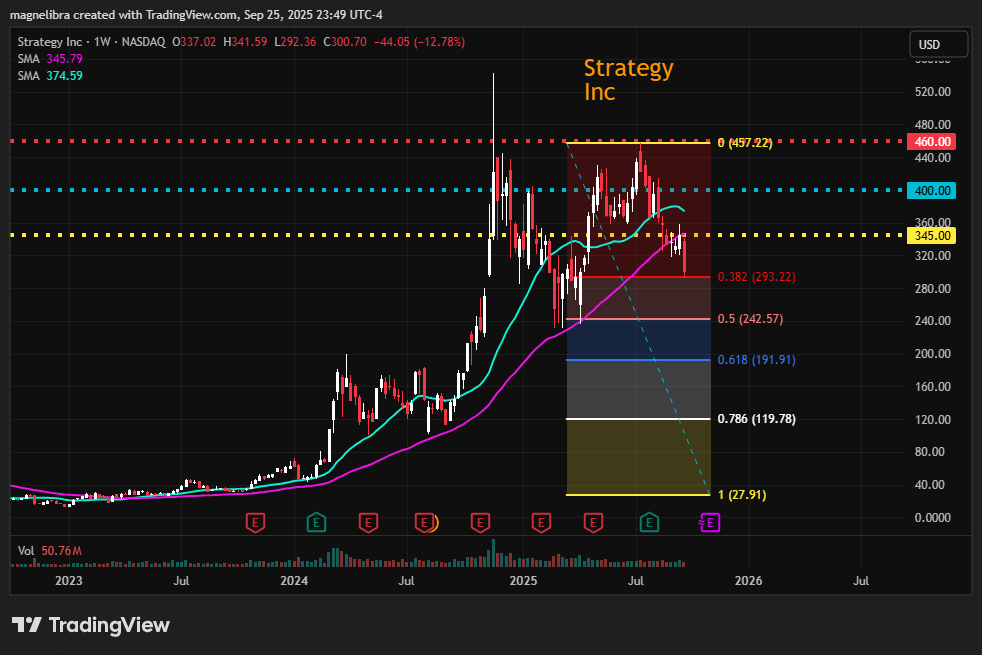
As far as the Strategy Inc. chart its hit the .382 Fib retrace, but ultimately we suspect this one has further downside in store:
Alright that is it, we hope our letter demonstrates the power of being an active investor vs your static long only holdings. In today’s world there are only excuses when it comes to losses, you should be active and do things that mitigate your overall risk, to not do so is purely just lazy. If you need to review your own risk, we would be glad to help, we can simplify pretty much everything and offer you a new way to look at investing. Too many of you often use mutual funds, often pay 1% or more for passive investing and chalk it up to the fact that this is how old grand dad did it that is how I will do it. Well don’t be foolish, today’s markets are nothing like even a decade ago, let alone a generation ago. We hope we are giving you a better and clearer proof of that then anyone else. Anyway reach out send a DM here, send an email and let’s discuss what you can do, its a matter of being proactive rather than being just pure laziness!
Thank you guys, appreciate all the support and thank you for reading our work and hopefully your gaining valuable insight and improving your own techniques and improving your non linear thought processes. We feel that support of our letter and the pricing of our tiers is more than fair market, so please think about supporting our work, till next time. Cheers!
Support directly to our BTC address if you can: 3DvDvPnjwu5Fd6sagAYmiFXA2fPkjJf2cp
Anyone interested in investing in Monero (XMR) please reach out, we have a link to Kraken below if you use my referral code or link to try it, we’ll both earn 75 USD when you trade $200 USD of crypto in the app!
Code: y4wsyws7
Link: https://proinvite.kraken.com/9f1e/11l9bp1z
Additionally we would be glad to consult anyone interested in getting involved here. As always we view these crypto currencies in the same realm as futures, high risk, high reward, and every portfolio should have a small percentage of their overall portfolio in investments like this.
So if interested please reach out to the email below directly and we can discuss this further. The future of financial payment systems will be digital decentralized and we are still in the infancy of this fascinating technology!
If anyone is interested in working on a digital currency project and joining in as a core investor to help lay the foundation for what is to come, please reach out!
Cheers,
Magnelibra