

As we talked about yesterday, we wanted to see how the March Nasdaq futures handled the systematic sellers waiting near 21600, well we got our answer as the market traded close to there hitting a high of 21567 and backing down closing below 21250:
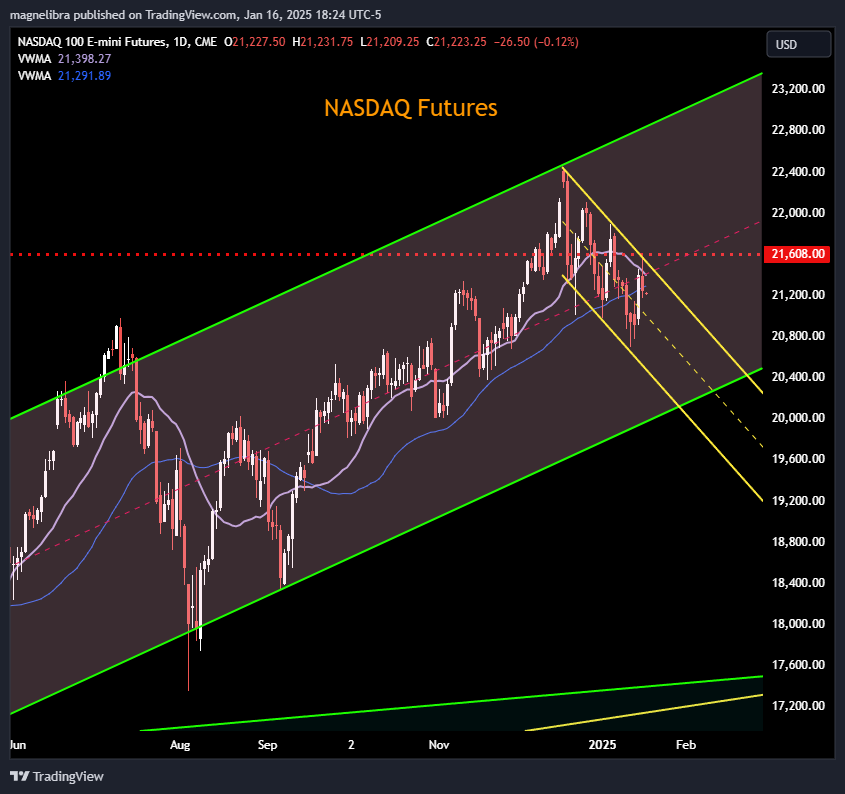
What is interesting is that from a technical standpoint the Nasdaq looks like its following a downward sloping channel now since Mid December. We like these parameters and they offer a very good trading range, that is until it is broken. So when we talk about a market being in a good technical trade, look at this Nasdaq chart and you will see what we are talking about, as the range has been coming with consistent lower and lower highs, highly indicative of a systematic sell program. You guys know our level is 21600 and if we stay down below there, our guess is that level will come down a bit and add even more pressure in the future, but let’s see how tomorrows trade filters out.
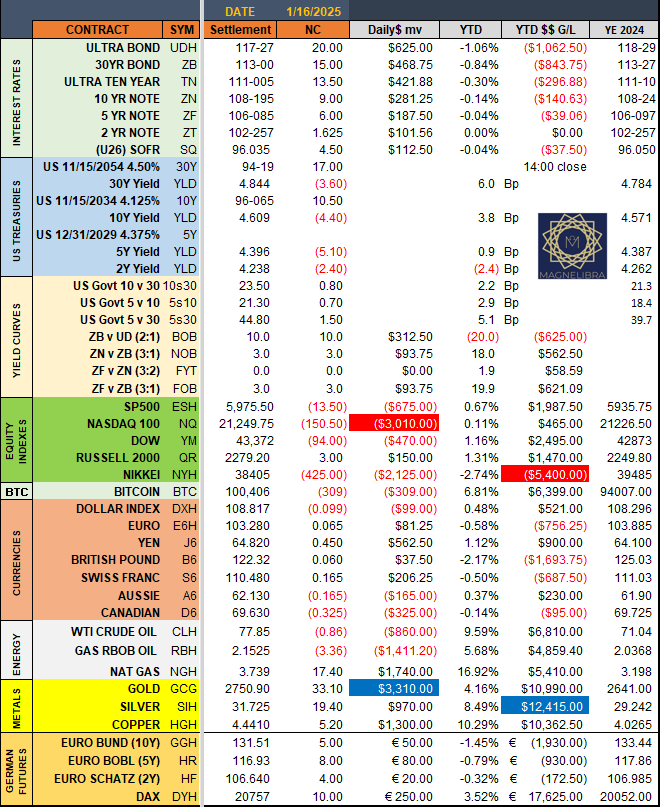
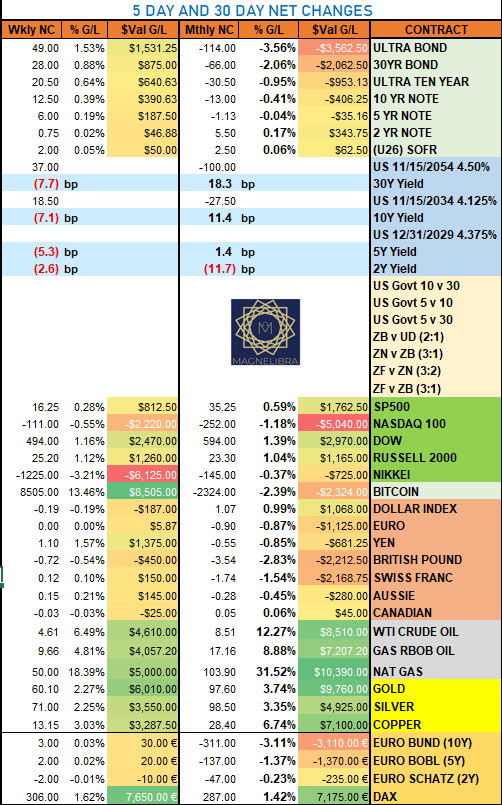
Let’s take a look at today’s settles as the US Bond market had another decent day as the 2Y is back to unchanged on the year, the Nasdaq was the contract value loser on the day with Gold the winner:
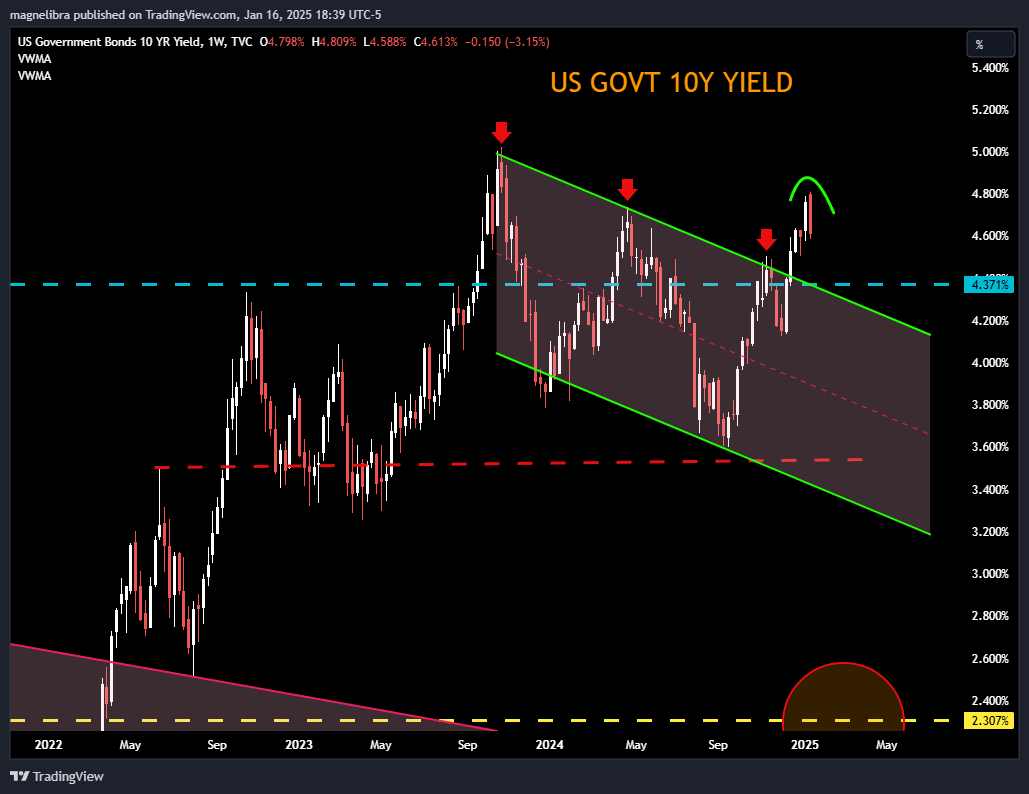
Looking at the US Govt 10Y has it rolled over? Maybe we do have some over sold buyers here now:
The one chart that stood out the most to us in the recent “Just Markets” from DoubleLine is this chart here showing the outlier of the US Govt 10Yr and its abysmal performance post FOMC initial rate cut:
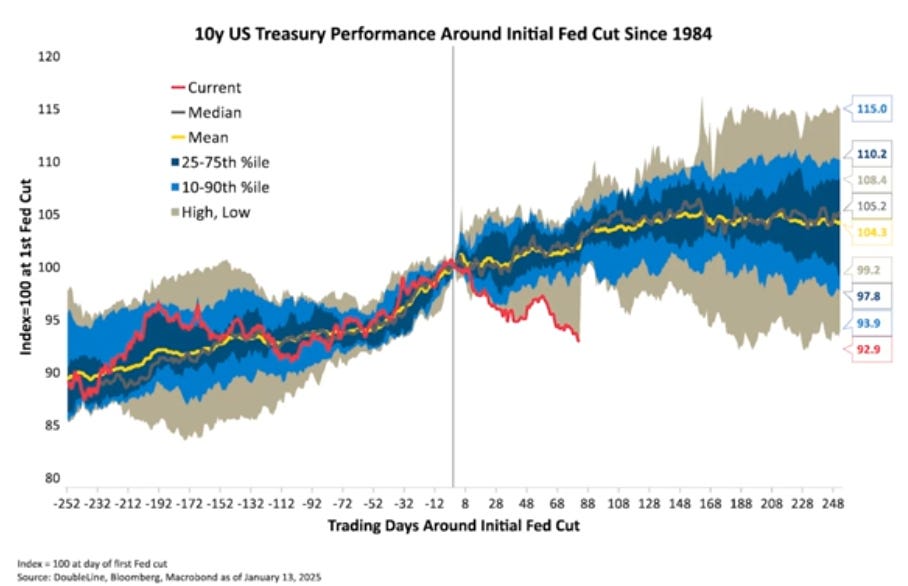
The other chart he talked about was the correlation between these higher rates post cut and a stronger US Dollar. So if this is the case and bonds actually start to move lower in yield, should we expect the US Dollar strength to wane a bit, most likely, but overall doesn’t change the stronger dollar theme in the long run. Anyway here is thel link to the DoubleLine recent “Just Markets” with CEO Jeffrey Gundlach, DoubleLine Just Markets
If you guys really want to learn about the markets in a more comprehensive comparison and in depth way, we suggest you watch that video from DoubleLine!
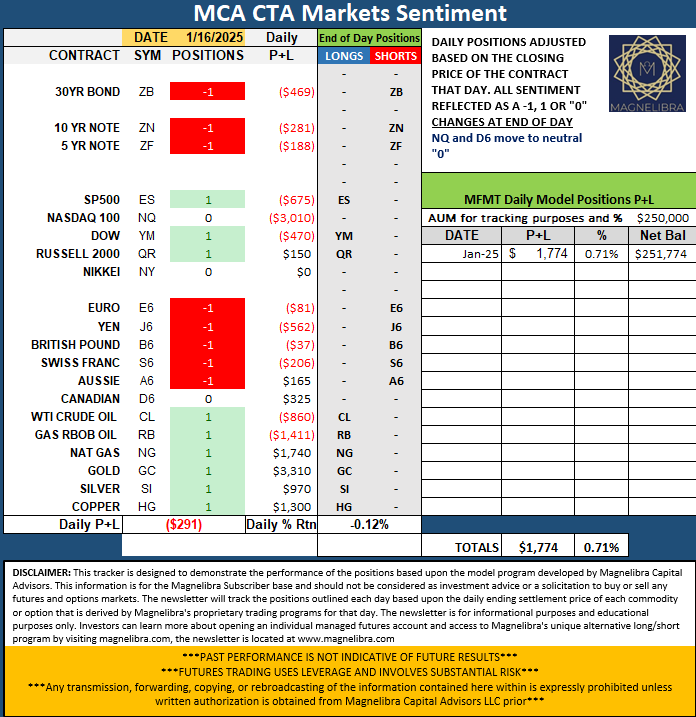
Ok lets move to the MCA CTA Markets Sentiment Tracker, this is derived from our proprietary MCA database used for our CTA managed accounts program. Two moves at the end of day as the NQ and D6 (Canadian$) moved to a “0” Neutral sentiment:
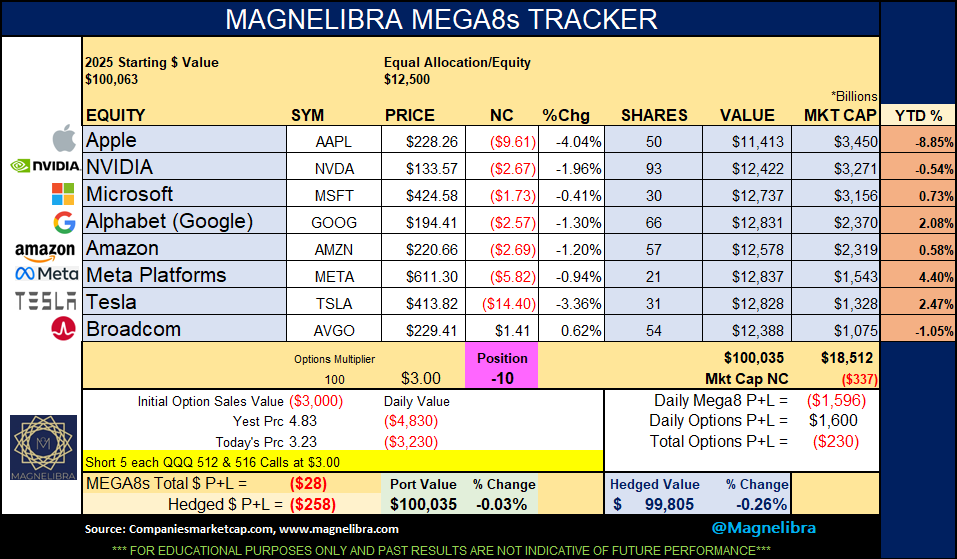
Moving to the MEGA8s it looks as if a mechanical sell program was in place today in Apple and most likely buying Berkshire…hint, anyway Apple and Tesla the big losers on the day as the complex fell $337Bn in total market cap for the group:
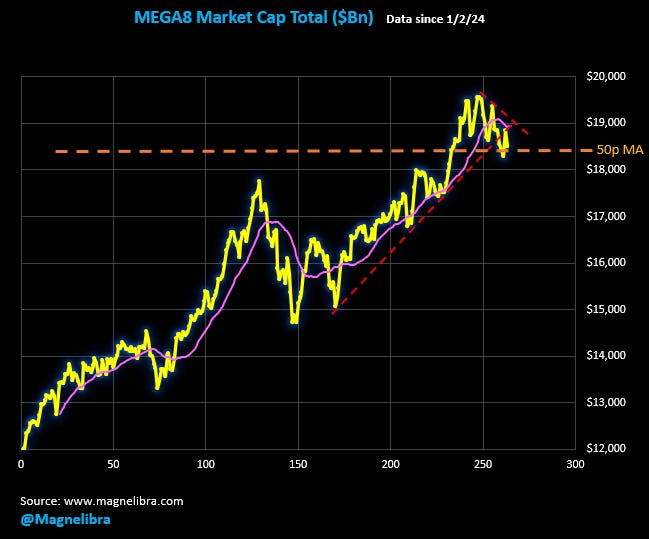
We tightened up the market cap chart and its obvious that the selling via large institutions vs retail has been obvious, now this may just be sector rotation and not full fledged reallocation of assets out of equities in general:
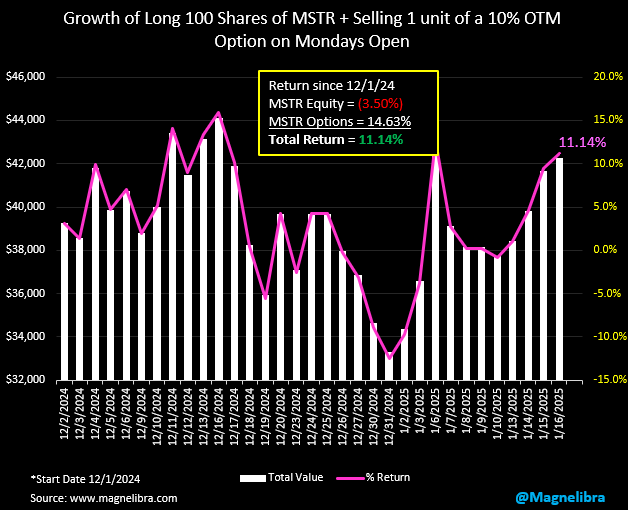
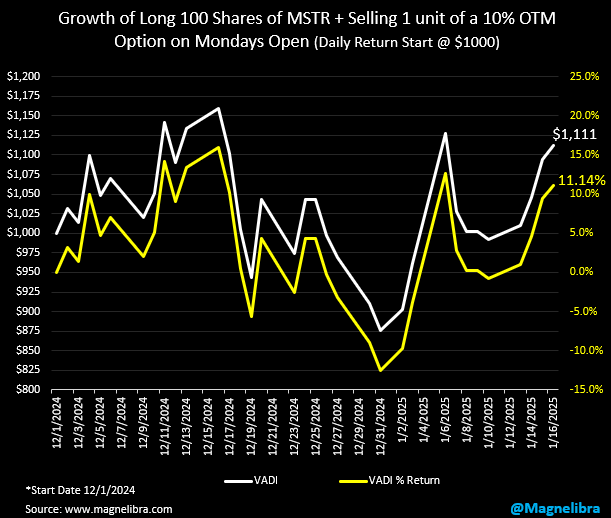
Ok let’s look at the MicroStrategy Tracker as the stock continues to rebound but is still below the Dec.1 start point:
Ok guys that’s it for tonight, thank you and have a great night, make the most of your days and be a positive force in the world and everything will work out just fine! Easier said than done we know, but we all have to try and do our part! Till next time, as always, leave a like or share if possible. Cheers.
Support directly to our BTC address:
3DvDvPnjwu5Fd6sagAYmiFXA2fPkjJf2cp