

As Magnelibra readers know all too well the Nasdaq and the MEGA8s have dragged the entire dumpster fire of an equities market higher. Yes the breadth has improved recently but as each of Magnelibra’s four pillars falls, we suspect eventually the equity markets will finally succumb to this higher rate environment. (see May 29th post)
The first pillar has already passed, that was the Debt Ceiling. We needed more debt to keep the fire burning and the next pillar we are looking for is a Negative Non Farm Payroll Print…ok we will repost our 4 pillars below:
Debt ceiling increase (Done)
Negative Non Farm Payroll print
Student Loan repayment restart (Sept 1 Check)
Actual FRB no hike, pause and softer economic rhetoric (We got the no hike, but still hawk rhetoric)
As we lead up to this we suspect that the US yield curves will continue to re-steepen in anticipation for the FRB (Federal Reserve Board) to finally capitulate to the weakening CPI, weakening jobs reports, deteriorating consumer positions and loss of discretionary spending. Yes costs of living will remain higher due to the nature of our money supply, but food wholesalers, retailers, rents will have to start discounting as cut backs start to weigh in on lack of volume…
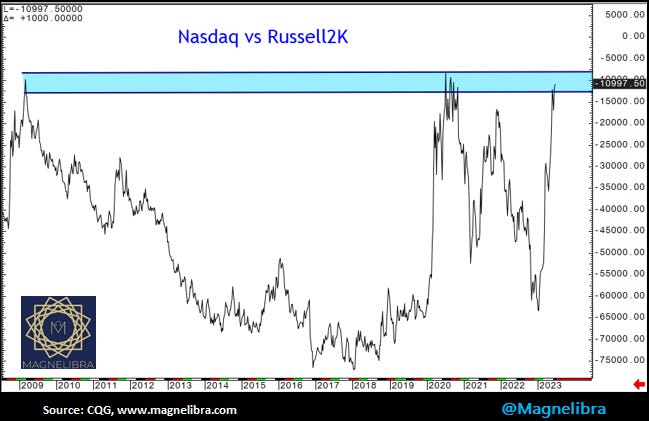
So with that said, we know the pillars are all falling and we wanted to share this chart of the spread between the Nasdaq and the Russell2k. Yes we know the MEGA8s are where everyone is hiding, it is a formidable force. BUT KNOW THIS, The same thing is said at all euphoric lopsided highs, as this chart shows, eventually a level gets hit and the big dogs take profits:
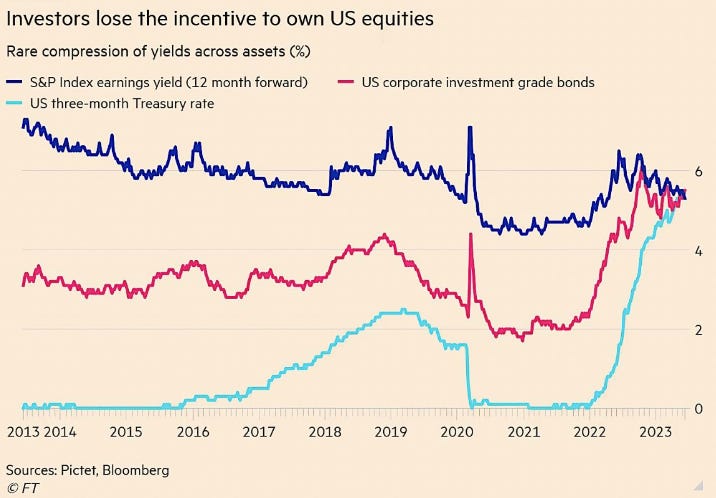
We also know that the big dogs have forced everyone to undervalue real risk as evident in this next chart. As a precursor let’s review what we feel about this chart which we first saw this amazing graphic on Twitter sourced from Pictet, Bloomberg and the FT. It shows how tight the compression is across assets.
Here are our thoughts:
So much of fundamental MPT is driven into our psyche and a world of investors believe and implement it and even with the Post Modern variety which uses STDDEV of negative returns (an improvement we agree with), However if any of this was truly employed then the chart we will show should not display the asset classes that are listed converging to the same yield level.
What this chart is telling us is that they are stating that all assets at present have EQUAL risk!
We are measuring risk by the accepted yield of the given asset classes.
So if all of these assets have the same yield then there isn't any variance in risk. If all the risk is equal then what is driving the valuation?
Its like if everyone is moving how can you tell you are moving?
What this tells me is that a very FEW players control a tremendous amount of MONEY and no matter what it is this concentration of wealth acting like a static attraction dragging all things with its movement. What this also tells us is that the divergence will only occur when they (the big money) start to diverge and transfer their risk.
In summary if Corps = Treasuries and Treasuries = SP Earnings Yield and then all are EQUAL to Cash then money is purely a function of unitary elasticities driven by the largest influencers overshadowing all other players moves...
QE has led us to this and its the reason I believe equity markets are no longer a function of risk, supply or normal market dynamics but are rather a monetizing conduit.
Please share our work so we can educate and inspire others to think outside the box as we are all learning together! Please think about supporting our work and become part of our subscriber base, thank you.
DISCLAIMER: For educational purposes only. This is not a solicitation to buy or sell commodity futures or options. The risk of trading securities, futures and options can be substantial and is not for everyone. Such investments may not be appropriate for the recipient. The valuation of futures and options may fluctuate, and, as a result, clients may lose more than their original investment. Nothing contained in this message may be construed as an express or an implied promise, guarantee or implication by, of, or from the author Michael Agne owner of Magnelibra Capital Advisors. Magnelibra the CTA and its Global Futures Benchmark Program may hold long and or short positions in the various futures and markets that Magnelibra covers. We will never claim that you will profit or that losses can or will be limited in any manner whatsoever. Past performance is not necessarily indicative of future results. Although care has been taken to assure the accuracy, completeness and reliability of the information contained herein, we make no warranty, express or implied, or assume any legal liability or responsibility for the accuracy, completeness, reliability or usefulness of any information, product, service or process disclosed.
ALL RIGHTS RESERVED 2023