

This is a quick post to an updated chart I did a few years ago. For those that don’t know, my career has been spent in interest rate arbitrage in particular 30 Year US treasuries. I have traded 100s of billions of US Treasuries across the Fed Funds to the 30 Year US treasury. As an Arb of securities I can tell you one very important lesson I learned very early, understand your cost of carry on any position.
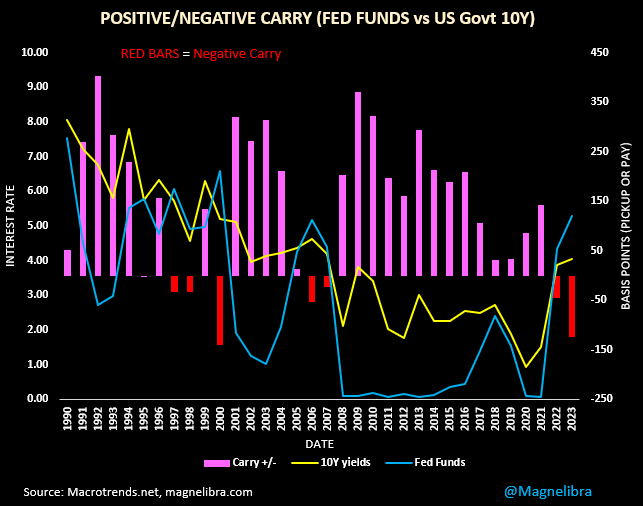
When you are dealing with millions or billions, you can rest assure that every single basis point matters, fail to delivers, matter, negative carry, matters. So with that said, I think you get the picture. I wanted to post this chart here because at the very heart of understanding our levered financial system one must always look at the cost of carry. So without further adieu, let me present this chart.
I will not give any commentary on the integrity of the picture it paints, but for me its obvious. What should also be noted is that throughout time, the Federal Reserve has increased its balance sheet by factors and over the last 25 years, at an annualized rate of 12%. You want the source of asset inflation, there it is, plain and simple.
What else is plain and simple, this chart I did, because what it shows is that we now have a massive “Negative Carry” situation and you can bet your ass off that this matters and the FOMC and every global central bank knows that ZIRP and QE are the only solutions. Without them, well, you will witness the fastest destruction of wealth since 1929.
The only other solution is all out war, which from the looks of what’s going on in the world…that is certainly a possibility, now more than ever. Anyway, read this chart, study it and let us know what you see. We see a massive dislocation, a massive distortion and one that historically has transpired each and every time we’ve seen this setup. NO, this time will not be different! Its much more worse than you can possibly imagine:
DISCLAIMER: For educational purposes only. This is not a solicitation to buy or sell commodity futures or options. The risk of trading securities, futures and options can be substantial and is not for everyone. Such investments may not be appropriate for the recipient. The valuation of futures and options may fluctuate, and, as a result, clients may lose more than their original investment. Nothing contained in this message may be construed as an express or an implied promise, guarantee or implication by, of, or from the author Michael Agne owner of Magnelibra Capital Advisors. Magnelibra the CTA and its Global Futures Benchmark Program may hold long and or short positions in the various futures and markets that Magnelibra covers. We will never claim that you will profit or that losses can or will be limited in any manner whatsoever. Past performance is not necessarily indicative of future results. Although care has been taken to assure the accuracy, completeness and reliability of the information contained herein, we make no warranty, express or implied, or assume any legal liability or responsibility for the accuracy, completeness, reliability or usefulness of any information, product, service or process disclosed.
Please share this chart with others so they too can research and learn.