
Netflix Beats and More Yield Curve Stuff


Netflix earnings beat which is certainly no surprise to us, people continue to look to Netflix to satiate their content thirst. From Yahoo Finance:
Revenue: $11.08 billion versus $11.06 billion expected and $9.56 billion last year
Earnings per share: $7.19 versus $7.09 expected and $4.88 last year
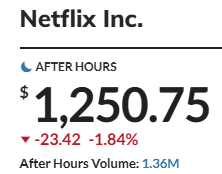
As far as the after hours, the stock is getting hit:
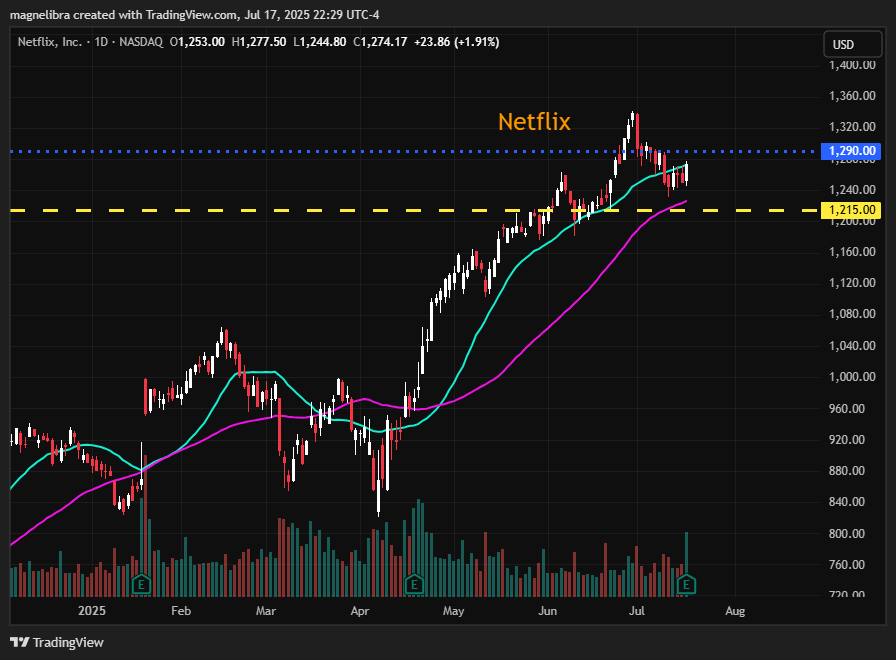
As far as the daily chart for Netflix, on the daily we have 1215 as the bull/bear short term flip with 1290 the key upside break to continue to push higher:
Alright so normally we include the Magnelibra MEGA9 total market cap data in our subscriber section but we want everyone to see this. We want everyone to see just how far 9 stocks can push and push and push and vacuum up a lot of the investment capital out there:
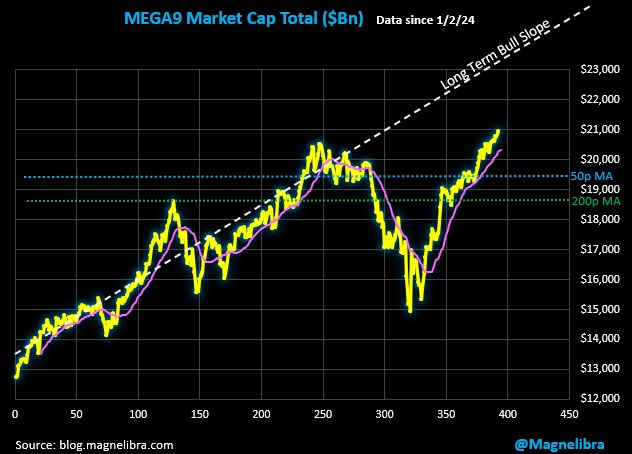
Since April, a mere 3 months this group has increased by $6 Trillion dollars off the lows or some 40%! You guys can see our long term bull slope and its been our target level off of the low for quite some time. We are not in the business of picking tops but rather rely upon momentum to dictate bias. For those following along, we watch closely the 21, 50 and 200 period moving averages. As long as we are trading above there, we do not care what the main stream media or any other doom and gloom type may say. Trying to pick tops is a death game, takes no prisoners and shows no mercy.
So next time people ask you how high these things can go, simply say, indefinitely until they don’t. Because realistically that is how this stuff works, take the stair case up and the elevator down.
Alright we also want to touch upon the steepness of the U.S. Yield Curve. Our earlier post today focused upon the 5s30 curve. Here we have the entire curve from 2s on out. We took some flak on X about not including the T-bills but look, that is controlled by the Fed directly and we don’t even bother. We look forward and the 2Y on out satisfies this intent:
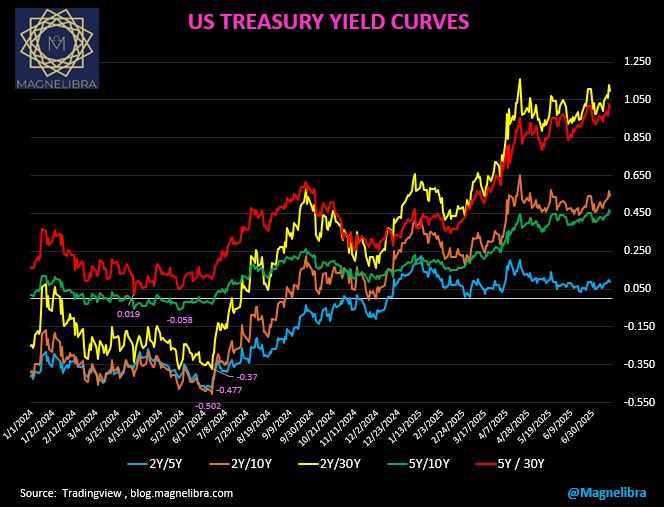
As you cans see the blue line is the front end spread of the 2s5, anchored by the FOMC short term rate policy. Whereas mustard and ketchup lines are the long duration spreads comparing the 2s and 5s vs the 30yr bond, those spreads are the widest trading at +100bp each.
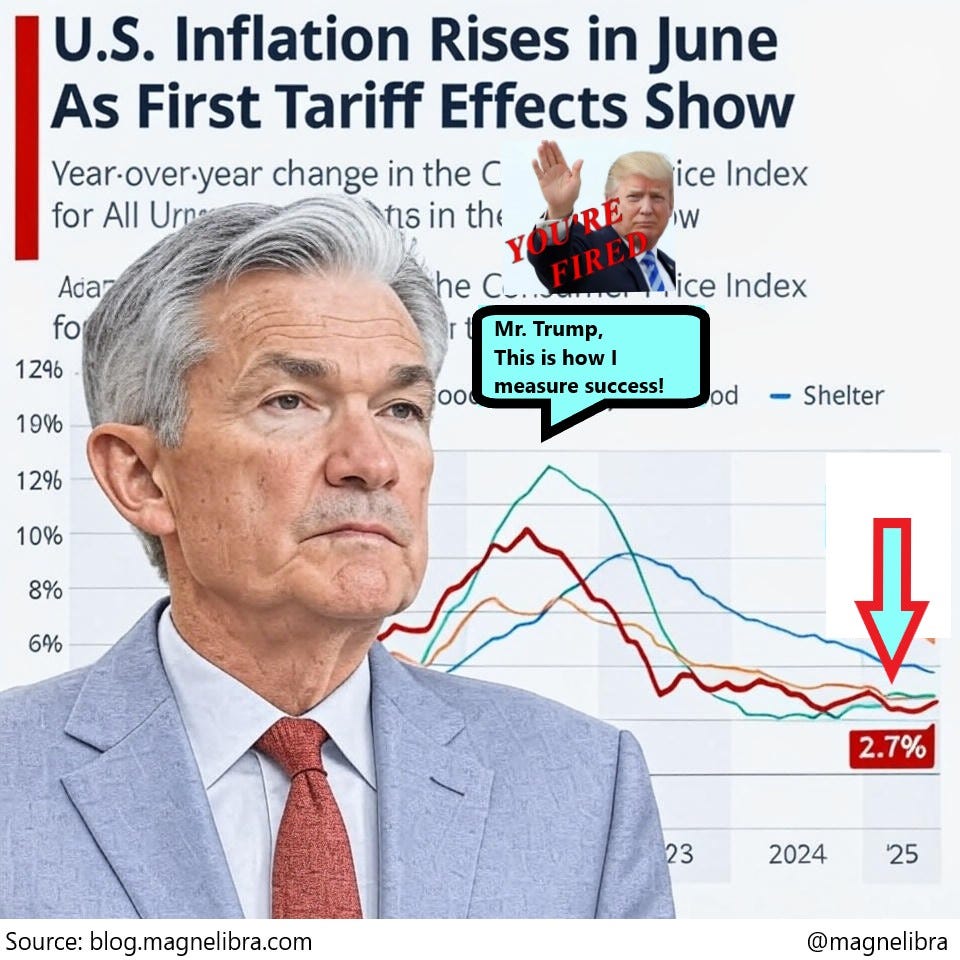
We keep seeing this call by many that Powell has failed, the FOMC has failed and that Trump is going to fire him for not cutting rates…well with equity markets at or near all time highs who is justifying a rate cut???
The goal was to squash inflation and push it toward a downward and then flattened out strategy, well by this metric, we believe Powell and the FOMC have succeeded!
Furthermore, we like the move by the FOMC to keep the Federal Funds rate above 4% we believe this jives well with the new equilibrium level of rates vs overall risk. For far too long, some 15 years, the world was a wash in this cheap money, lulling everyone to sleep and masking risk via interest rate arbitrage games. This bypassed the natural organic economic process of creative destruction by allowing finance to overcome lack of profitability. Well that no longer is possible and we are witnessing this in real time in the housing and commercial real estate markets.
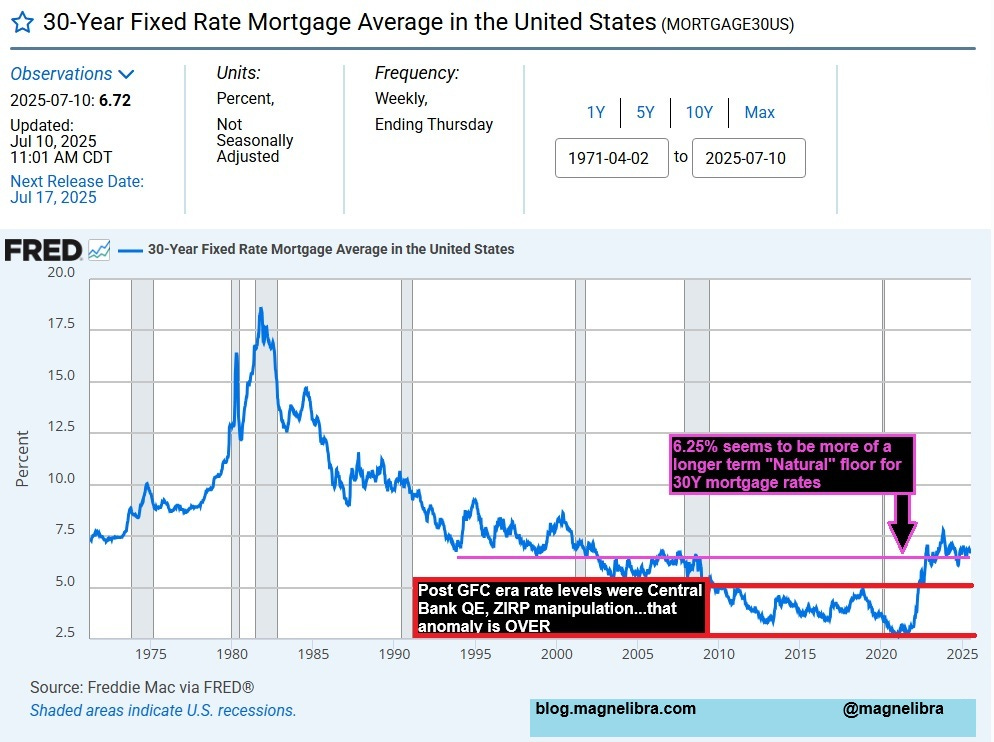
Nobody has seemed to notice, but maybe just maybe 6% plus mortgage rates are the new equilibrium level that everyone will need to retool their spread sheets with. We highly doubt many have calculated for this, but there is a strong possibility that this is indeed the case. Here look at this chart, doesn’t the last decade or so seem like an anomaly? It is merely our perception based upon where we were that we consider rates “high”. Talk to somebody in 1981 and ask them if paying a 6.5% 30Y fixed rate mortgage seems reasonable, you get the point:
Ok one last thing before the subscriber data, we saw these two homes in Tampa, which one holds more future value potential. What does this say about the state of real estate pricing wise, are we just in the beginning innings of a much more pronounced pricing downturn?
What happens if foreclosures start to accelerate, which seems to be the case?
I remember many saying nobody will sell their home if they have a 2.5% interest rate, well, the rate doesn’t matter if you lose your job, or have an unexpected expense now does it?
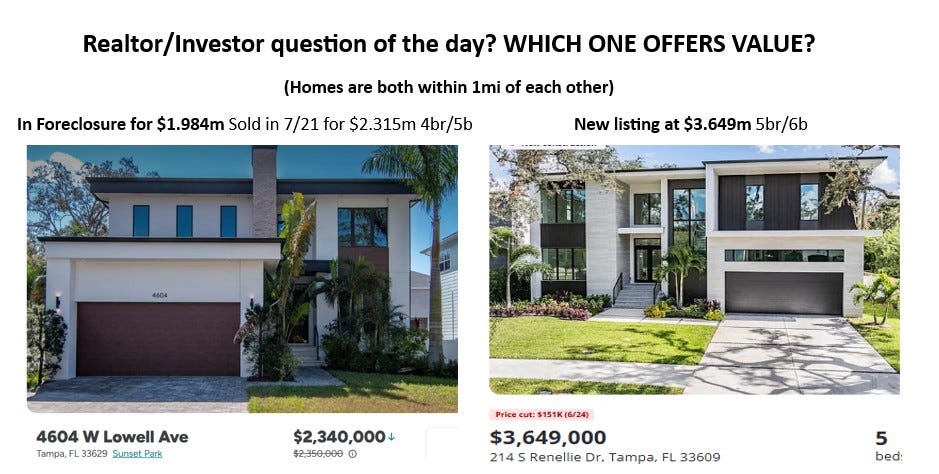
That Renellie Drive spec home? Its identical twin is listed right next door at the same price tag. Same builder, same owner - and now they're sitting on multiple millions in speculative inventory. Here's the gut check: if this isn't an all-cash player, that construction bridge loan is about to become a financial noose with today's higher rates. When the music stops on these spec plays, the leveraged builders will be left without chairs. This is how bubbles pop, folks.
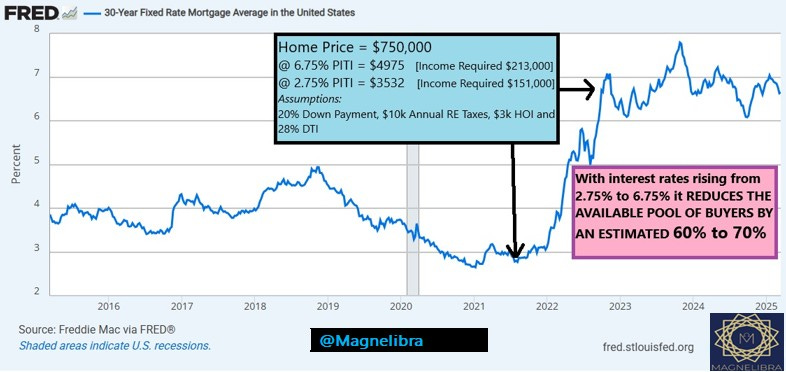
For my realtor types out there, please review this next chart. Please inform your clients, given today’s rates and adding today’s high cost of, well everything, the pool of buyers has shrunk by about 90%:
Alright, we have all the subscriber only data up next, we urge you to become a full subscriber and truly break through that barrier of understanding in regards to our global financial system and perhaps implement some of our trading trackers into your own investment profiles! If you are sick of stagnating, sick of losing then join the ranks of MTR Subscribers!
All for less than a Starbucks Grande coffee per day (regular coffee at that)! This is value, the level of what you learn here is expert, what are you waiting for?
