
Nikkei Explodes, House Supply Jumps, Producers Eat Higher Costs
Tesla and Alphabet updates

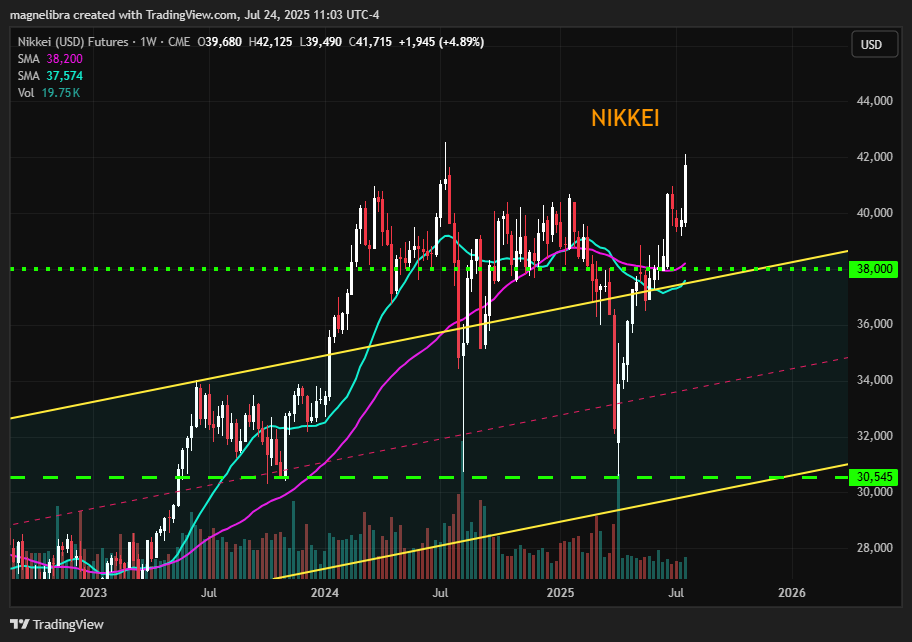
Ok first up let’s take a look at the Nikkei which jumped over 4% on news that Washington and Tokyo have finalized a $550Bn trade deal. Toyota certainly welcomed a 15% tariff agreement as its American competition is still paying high input costs due to ongoing tariff issues. However, despite being up nearly 5% on the week, the Nikkei is barely up YoY and this area is the same area it sold off from the previous time we were up here. That is the reflexive cautious theme, the other theme is that we are possibly breaking out of a year and a half long basing patter. So we can see the case for both caution and optimism:
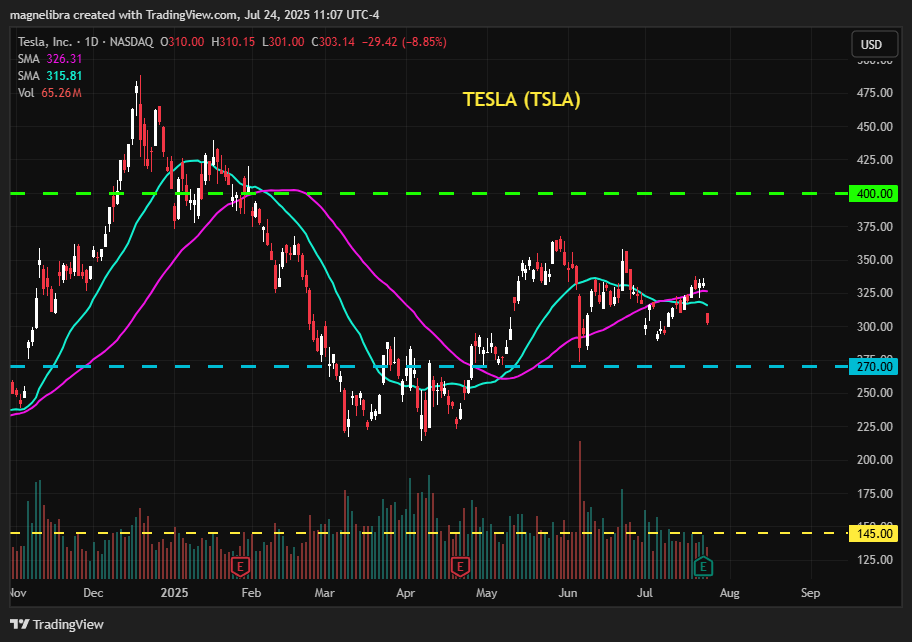
Ok we also had Tesla and Alphabet earnings so lets hop over there. Tesla missed both revenues and EPS posting a 12% decline YoY on $22.5bn revenue and EPS came in at $0.40 vs $0.42 exp. As far as the chart Tesla is down nearly 9% back down to $303:
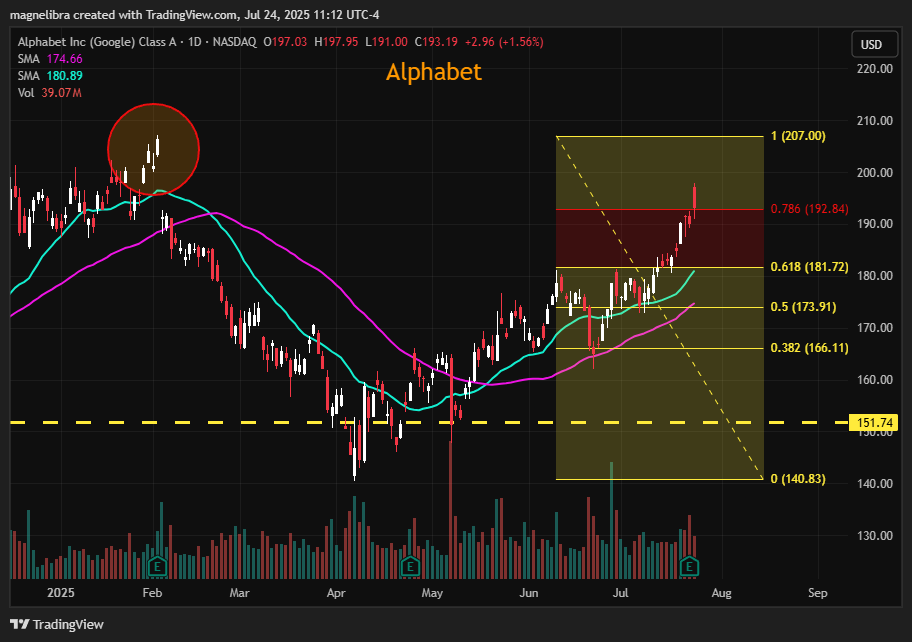
As far as Alphabet it was lower in after hours but jumped to a high near $199 as it beat both revenue and EPS expectations with revenue hitting $96.4bn and EPS at $2.31. This is 2.5 years of beating estimates. As far as the chart, we like the initial jump and now a move back under and a close on the weekly below $192 would put pressure on the bulls here we believe:
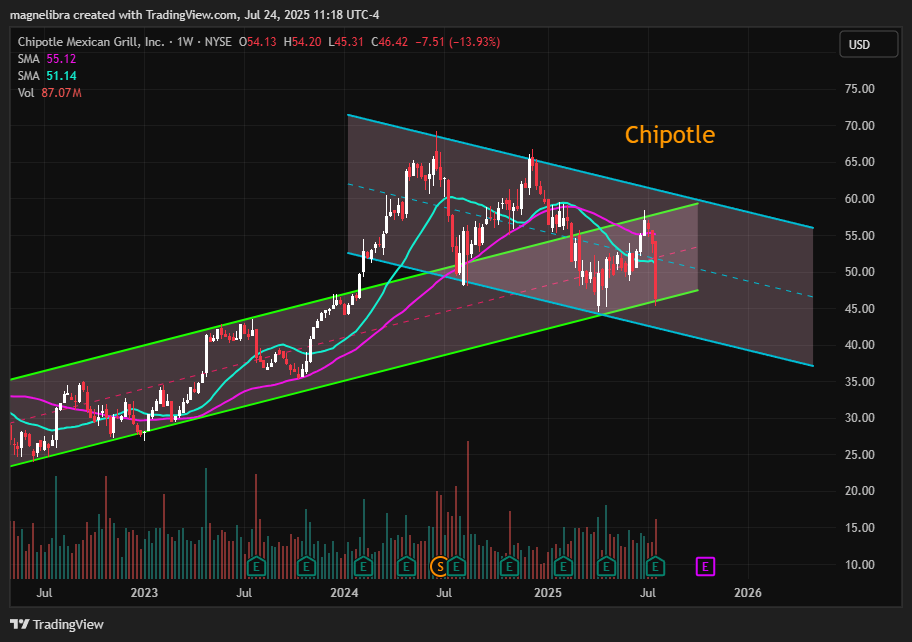
We also wanted to take a quick look at Chipotle (CMG) where declining margins and flat comparable sales are hitting the stock. We also noted awhile back that the departure of Brian Niccol was going to be a problem for CMG which basically marked the all time high in the stock in mid 2024. For now we suspect buyers will step up here at the $46 level but $40 to $55 seems to be the longer term range trade now for this:
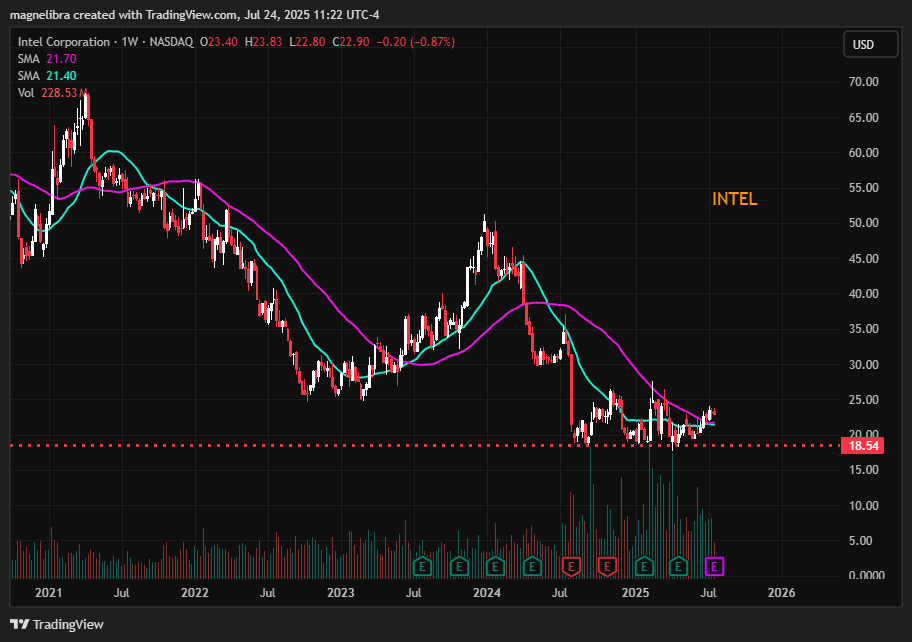
Intel (INTC) reports after the close today and long time readers know since hitting $18 we view this as a very long term accumulate at these levels:
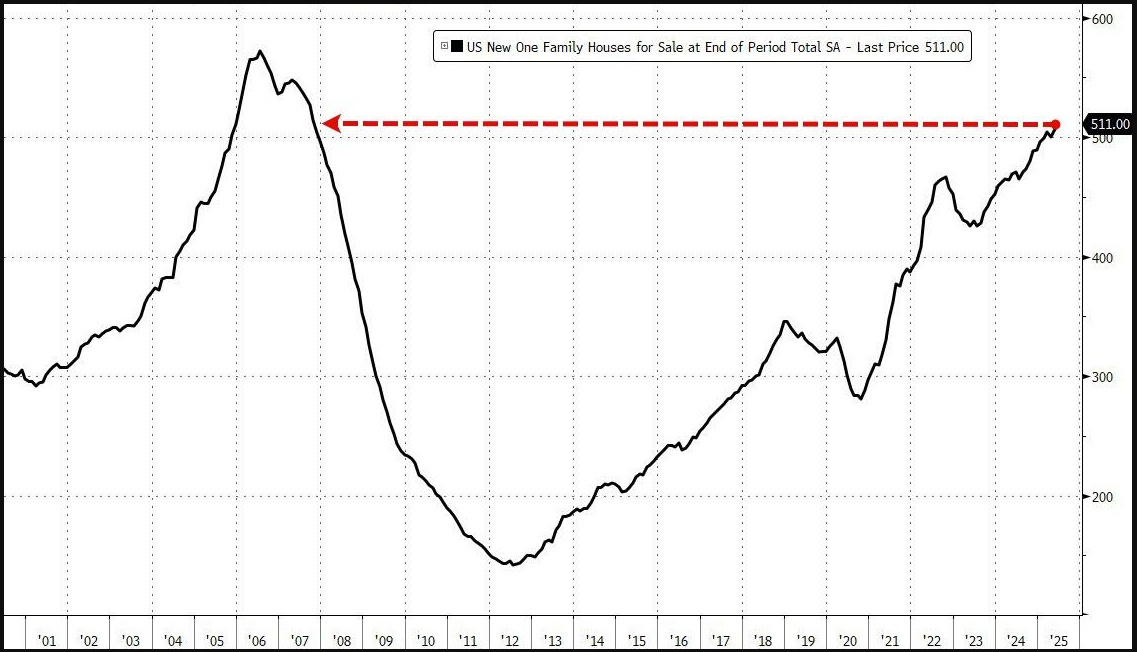
This morning we had a little housing data and this next chart showing the supply of new homes for sale is now up to 511k, highest since 2007. That really shouldn’t be a surprise to anyone given affordability at this point:
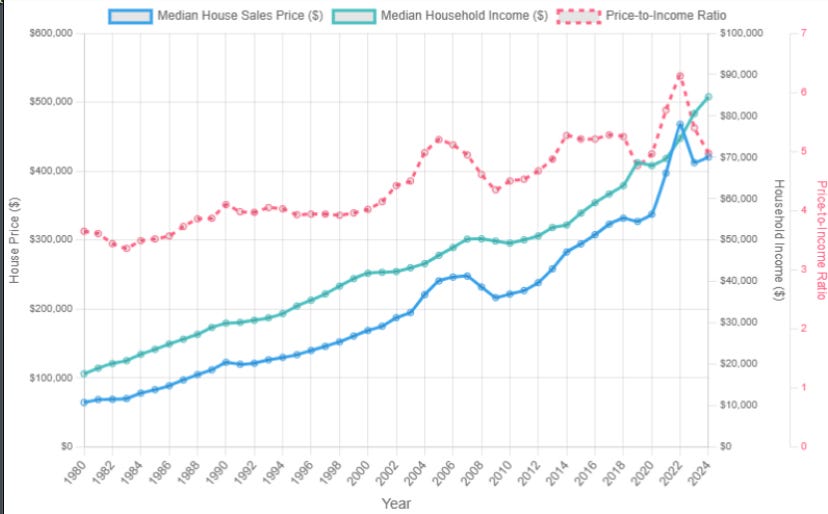
Speaking of affordability, we created this chart plotting median home sales price and median household income. The ratio currently sits near a 5x, historically its more near 4x so we are still some 20% away from a fair value. We like looking at things thru this lens because it takes into consideration rates, prices, incomes, etc. and focuses purely on a longer term ratio that we can target:
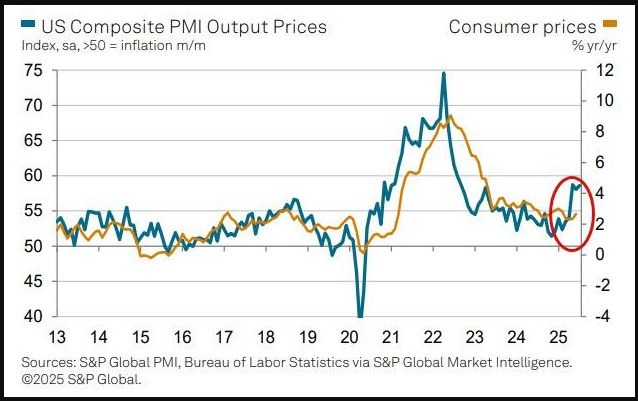
Ok our last data point considers the jump in PMI output prices, but we want to focus on the consumer prices (YoY inflation) which are situated well below the producers output prices. We believe consumer prices will not follow, purely because the producers do not have the ability to both keep market share and raise prices. We believe the current climate warrants consumers to seek alternatives rather than pay a privilege. In micro econ we learned the concept of price elasticity of demand, lets call it the “substitution effect.” We have talked at length about the consumer climate, even back in 2023 when everyone was expecting prices to continue to climb…well 2 yrs later, we were correct, producers are “price takers” will have to accept what a customer will pay and be forced to watch their margins decrease:
Alright, we have all the subscriber only data up next, we urge you to become a full subscriber and truly break through that barrier of understanding in regards to our global financial system and perhaps implement some of our trading trackers into your own investment profiles! If you are sick of stagnating, sick of losing then join the ranks of MTR Subscribers!
All for less than a Starbucks Grande coffee per day (regular coffee at that)! This is value, the level of what you learn here is expert, what are you waiting for?
