
Non Farm Payroll Should Green Light the FOMC 50bp Cut at September Meeting
Subscriber Data for Aug29 2025

Good day MTR readers, this is a very important week and we suspect a lot of two way flows across risk markets. We know that the metals market are starting off breaking to new highs, but even our CTA Model isn’t looking at this breakout as a new paradigm. In fact this weeks metals sentiment is starting out as a long hedged model so there are components embedded based upon our attributes that aren’t fully sold on this breakout. We know that the model does take a lot of the other correlations verse various other market segments and something isn’t adding up. Its almost as if this is the forced type buying that puts in a more longer term top as opposed to a new breakout. Here let’s look at Gold and Silver before we move on with the letter:
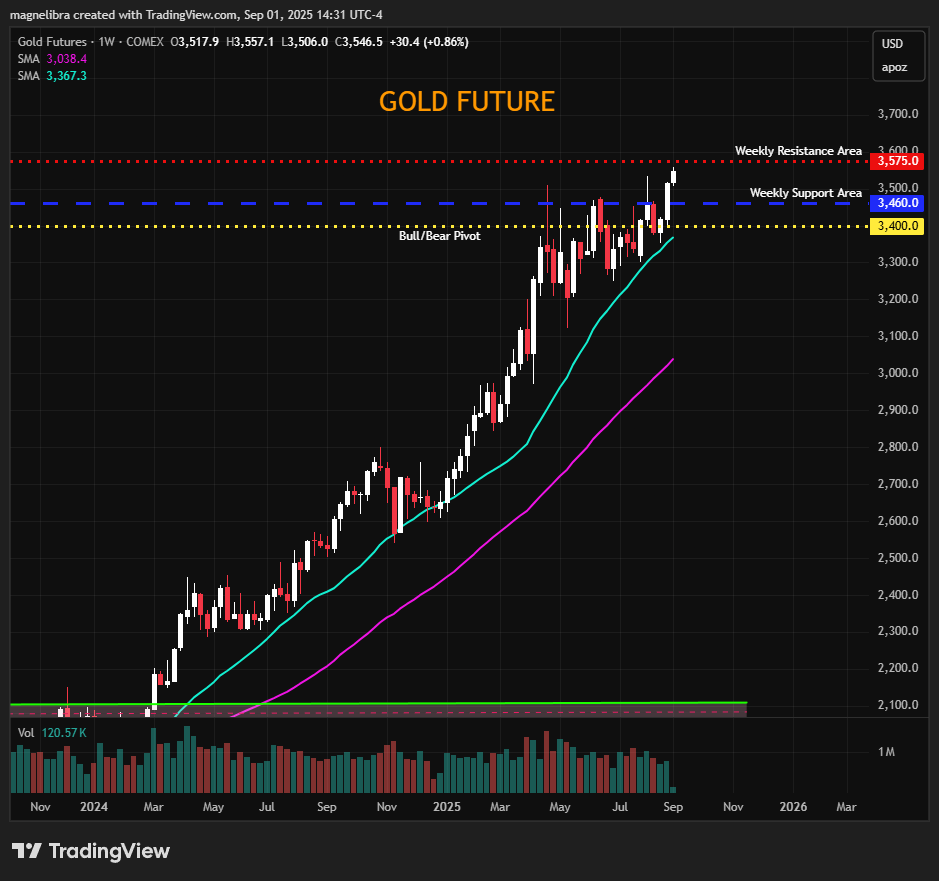
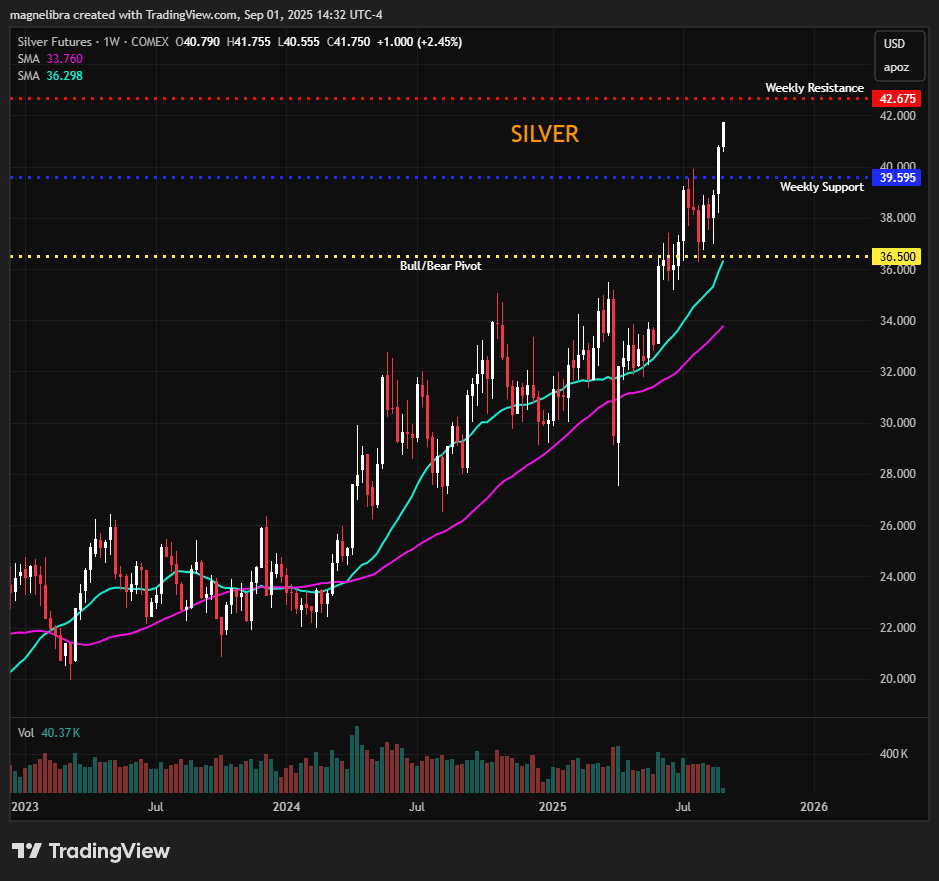
We like this move in the metals to clear some weak short sellers and honestly the result of this weeks NFPayroll report should be the go with move in risk markets. We know the thought process for a lower or even negative NFP may come with a reactionary “bad news is good news” because the FOMC will be all go for a 50bp cut and the risk markets will view this as positive.
However once the Ai tea leave readers decipher and further scrutinize what it means we believe the risk markets will start to paint a much different picture. A picture that paints a more ominous sign for what is to come and with government and retail record debt levels, the last thing the global economy needs is for the United States employment picture to actually start posting negative headline employment numbers.
Don’t get us wrong, history has not been kind to risk assets after prolonged periods of what we refer to as “Negative Carry.” In the bond arbitrage world its better known as a levered player killer because all the financial alchemy in the world, cannot supplant the real cost of short term financing for longer duration holdings when that short term financing rate is higher than the return of your longer term holdings.
In a more simpler fashion, let’s say you borrow money at 7% but your asset has a fixed return payment of 4%. Well you can see that this is a -3% or 300 basis point negative carry. Not exactly an ideal financing situation, but it encapsulates the term negative carry very simply, you cannot be profitable for very long given that carrying cost! Think of all the players in this situation now and then it shouldn’t be such a surprise when we see commercial real estate changing hands at 10 cents on the dollar from prior ZIRP era valuations!
Here is our chart of negative carry times over the years and this present time is akin to the 1997-2000 period:
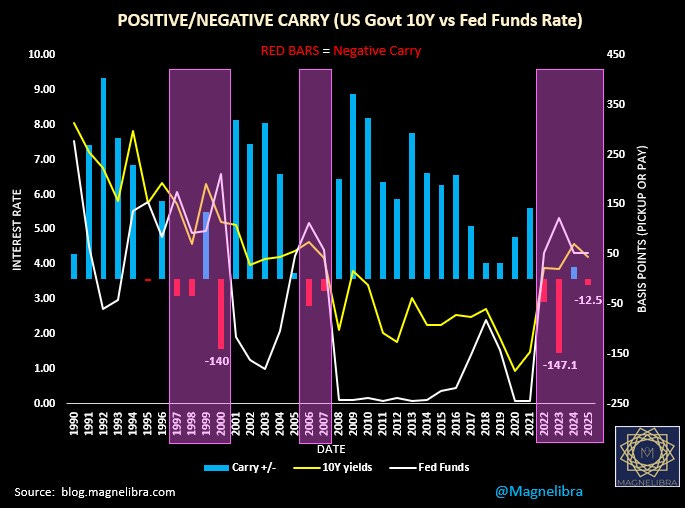
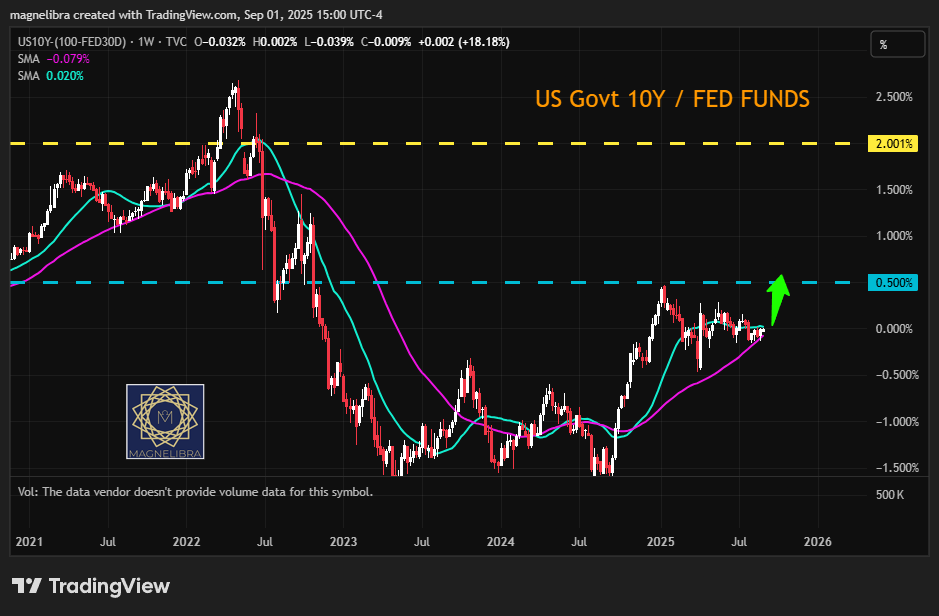
As of today the US Govt 10Y/Fed Funds spread is actually -8 bp so a bit tighter than the -12.5 shown, but once the FOMC cuts 50bp in a few weeks this spread should jump to a positive +32bp as Fed Funds will start to trade at 3.83% and using an estimated 4.15% for the 10yr that is 4.15-3.83 = 0.32 or 32bp positive, so we will be back once again to the blue bars for 2025 in the chart above.
We know these concepts aren’t easy to contemplate, but we can only tell you that in the modern day monetary world, they are the LIFEBLOOD of economic progress and decision making.
As much as the world believes that modern day finance moves on due to technological advances, it often forgets how those advances are made economically viable and financial engineering is what makes it all possible.
The flip side of all this financing is you have continued increases in global debt piles, for money and debt are one and the same and as the law of large numbers does its magic, every little basis point becomes that much more significant. Eventually kicking the can down the road comes to a split in the road, but no matter which direction you take, the cliff is still the only destination ahead.
Call it fate, call it destiny, no matter what you call it the result will come with zero good choice selections and only rather opting for which choice produces the least amount of suspected damage!
Given what we know about negative carry eras, well its no surprise that the Magnelibra MEGA9s have continued to push their market cap to new all time highs. However last weeks close put it right smack on top of the 21pMA once again and with that, it seems the bears will have a huge edge on any daily move that produces a close under this level. A break of the 50pMA well, then that will come with some serious systematic and mechanical follow through! Our subscribers get this chart updated daily, but we are sharing it here for visual amusement, but you should think about hitting that subscribe button:

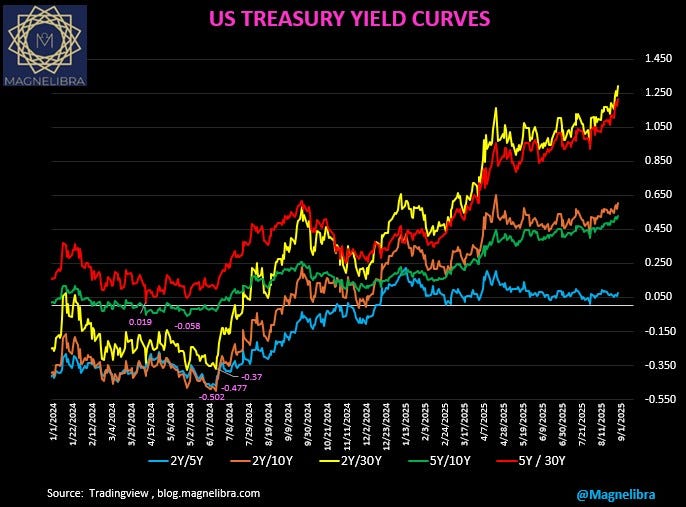
When you consider where the U.S. bond market yield curves are at and where they have come from, you will begin to see what the bond market sees and its reflective in the price of the front end bond curve being super steep compared to where it was. For us, this means the Federal Reserve has fallen behind the curve and honestly, no matter what happens this Friday, we believe they will cut the Federal Funds rate by 50bp. The yellow and red lines below are the 2Y and 5Y yields vs the 30Y bond yield respectively, just a massive slope higher:
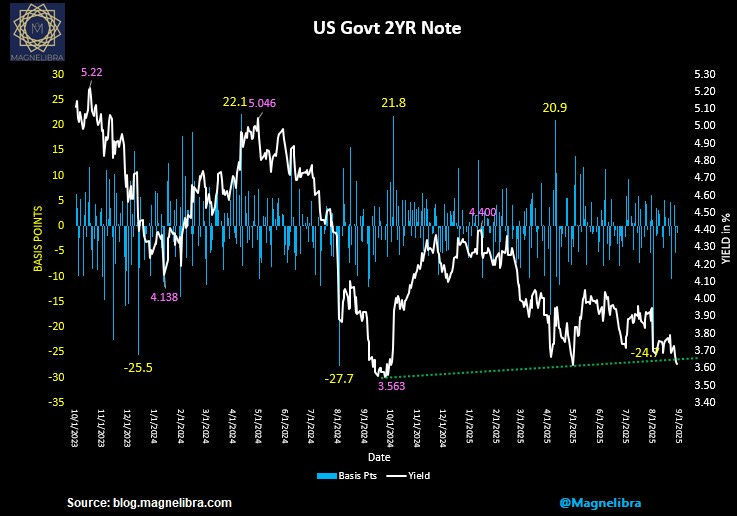
When we look at the U.S. Govt 2Y, well we have waited for yields to breach the 3.68% level and last week confirmed this new lower move:
When we look at the US Govt 10Y vs the Fed Funds on a weekly chart, you can see the path forward and where it has come from:
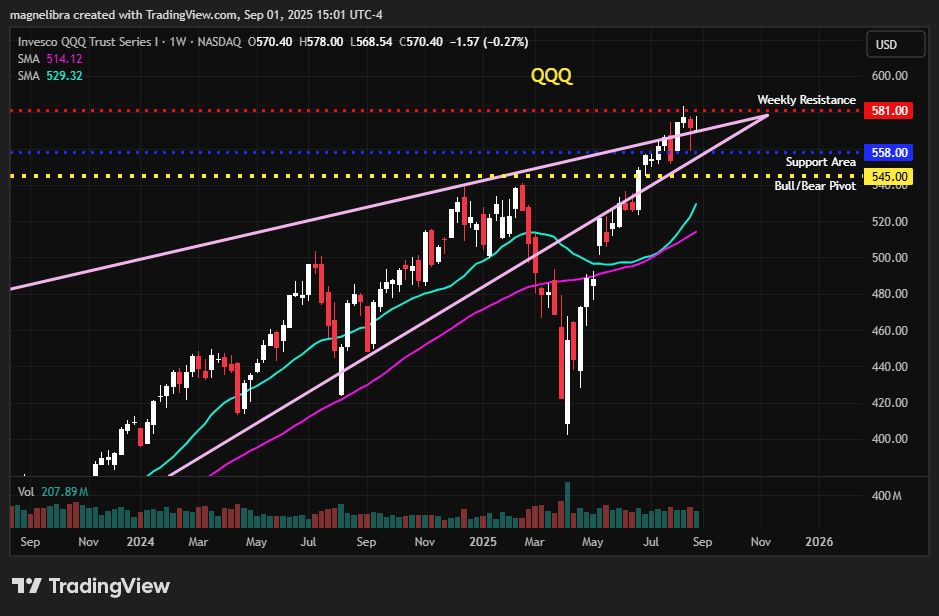
Finally before we get into the subscriber only section let’s take a look at a few more charts, first the QQQ ETF, its pretty safe to say we are coiling for a much larger move:
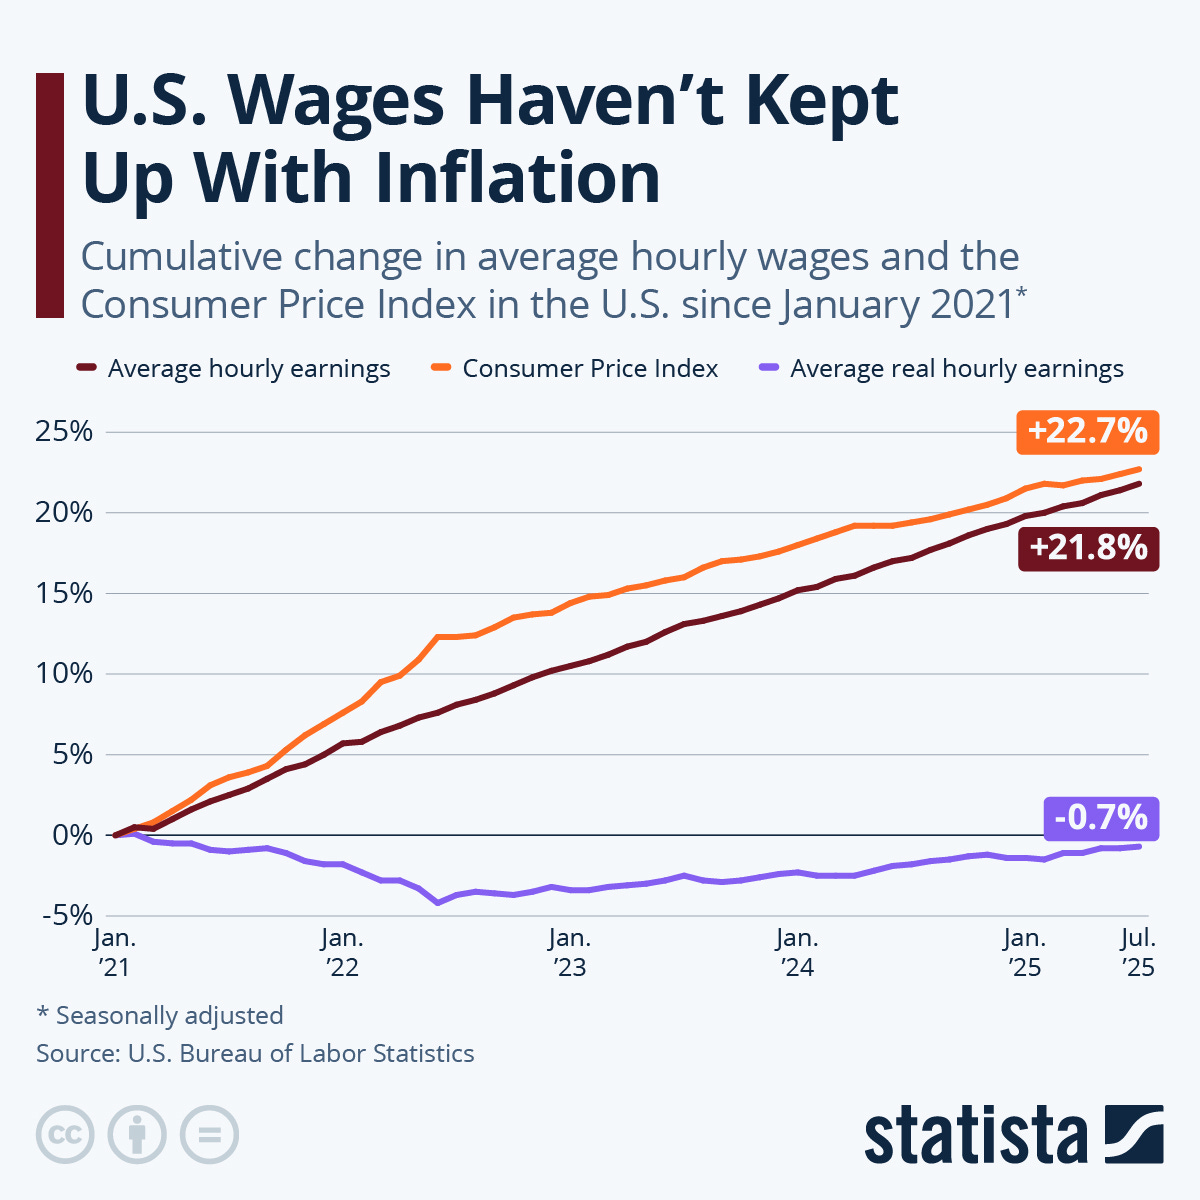
The last chart is from Statista and it highlights a serious problem that will only become even more discouraging once the unemployment rate starts to tick up. The big question I have when it comes to charts like this, is how is it even possible to close this gap between wages and price inflation without incurring perpetual debt? This is the insidious nature of inflation, it murders the bottom 90% and moves all the wealth to a very small subset of the population:
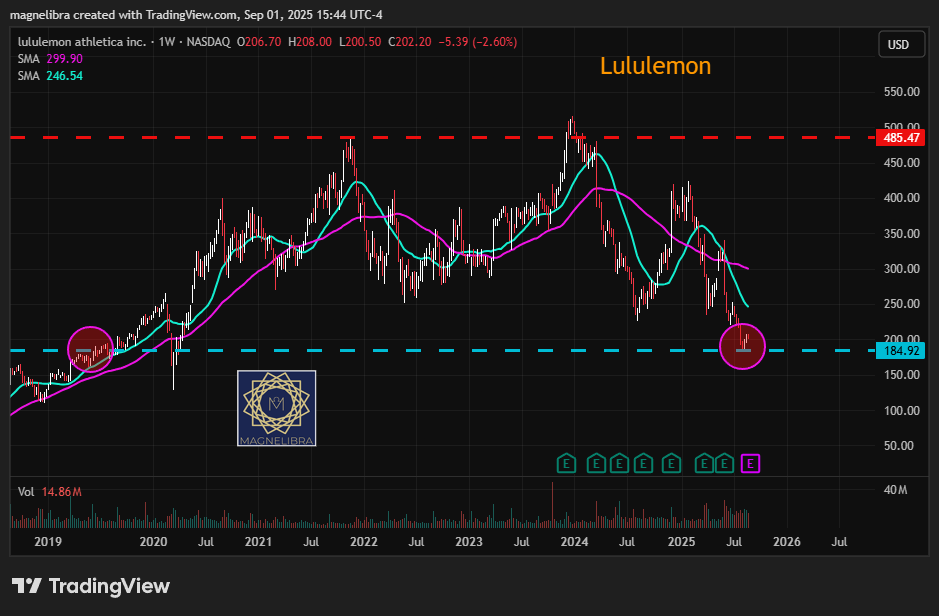
Wait, bonus chart, who says you can’t go back in time? You want to buy Lululemon (LULU) shares at 2019 prices? Well if you believe they can resurrect themselves, well then here is your opportunity? We hate this company with a passion, but that’s just us, we have our reasons, lets just say we are more of a linen type crowd and abhor all things polyester and synthetic. Oh and not to mention we prefer woman in traditional clothing when traversing out socially and not pseudo underwear, to then pretend they can’t stand when the opposite sex cat calls, go figure!
Alright that is it guys, we believe that if you follow our work, start implementing some of the things that we present, you will not only improve your odds of winning but also gain an invaluable mindset to take through all facets of your life. So think about subscribing and becoming a supporting member, at the least share our work if you can!
Cheers,
Magnelibra
********************SUBSCRIBER ONLY SECTION**********************
