

Ok guys Magnelibra is back here this weekend, our goal this week will be to post daily and just so our base knows, last week we started a new contract assignment which will take up a lot of our time and resources. However we believe we have made necessary adjustments now to accommodate our deliverables for the newsletter on a daily basis. We did highlight the fact that Nvidia was going to the key for the markets, and well it led to a massive 500 point Nasdaq Index rally on Thursday.
Well lets just jump right into it and take a look at the Nvidia earnings and then the price chart.
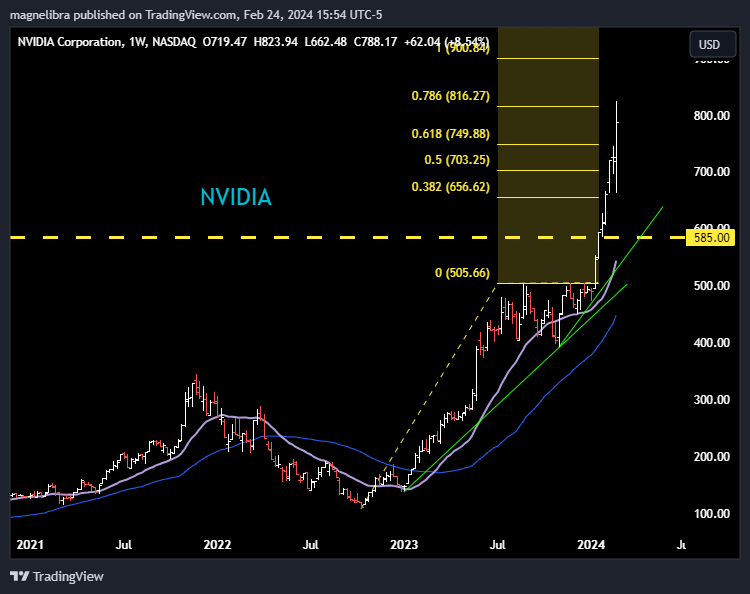
Nvidia Adjusted EPS 5.16, Exp. 4.64, Revenue $22.1Bn Exp. $20.6Bn. As far as the Q1 2025 revenue guidance was $24Bn +/- with the Exp. $21.9Bn. The CEO made it very clear that they cannot keep up with the demand. Nvidia ended up 8.54% for the week hitting a high near $824 and settling at $788.17. We do expect this to pull back some here as the technical level hit on the highs is formidable. Let’s see if next week sees some shorter term players taking some profits here in this top performer:
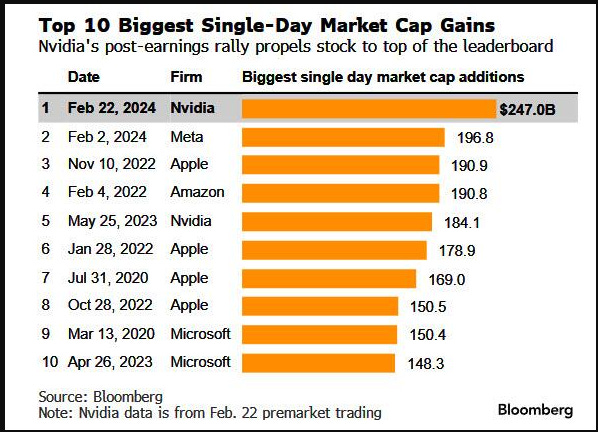
As far as Nvidia it achieved the single largest ramp in market cap ever rising $247Bn which was $50Bn higher than the META ramp earlier this month!
What becomes apparent to us when looking at some of these recent massive moves is that valuations have nothing to do with fundamentals or economic cyclicality. Rather money is being continually concentrated and funneled toward the very large highly profitable tech sector mega market caps. Now we know Berkshire is not exactly a tech stock, but considering their holdings, well they are more of a Trust company owning a massive amount of shares in Apple which makes up 45% of its holdings. Berkshire is a cash cow and its most likely making $8.5Bn a year risk free on its cash per year, imagine generating $8.5Bn in risk free interest per year as an investment company.
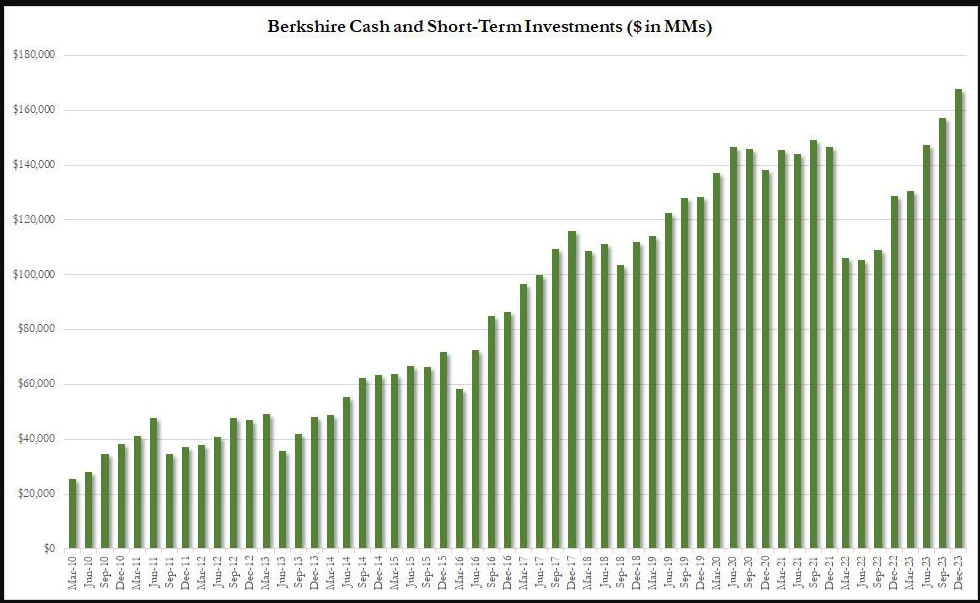
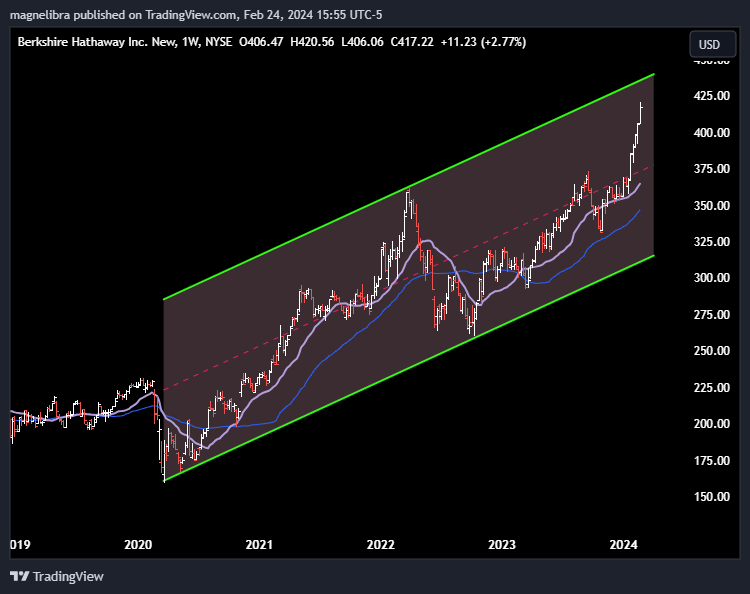
So when people say that we can solve inflation with higher interest rates, think about the difference between what Berkshire earns risk free with Fed Funds at 5% vs 0.5%. $8.5Bn a year vs $850 million. When we look at the price chart of Berkshire, it is nearing the top end of the weekly channel:
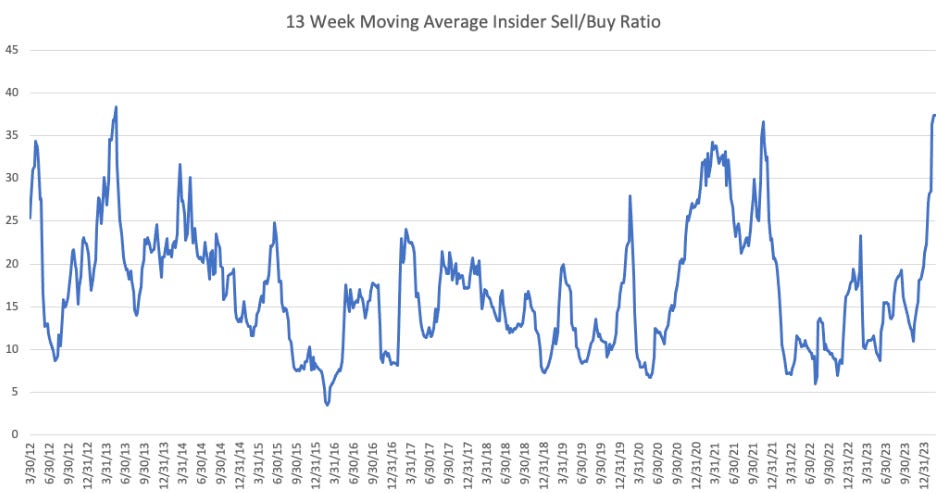
Now tell me again how higher interest rates solve inflation? We believe that higher rates will do nothing to solve inflation, but rather will contribute to the insane nominal price inflation that we continue to witness today. Maybe this is why we are seeing record insider selling! Maybe they realize its time to monetize because liquidity may be drying up here the closer we get to the BTFP program ending, the closer we get to the RRP program completely drained. Insider selling is now in rare air territory:
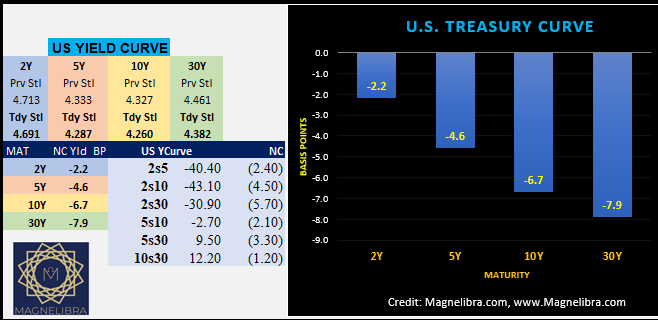
Ok let’s move to the US bond market real quick, we know the data last week continues to allow for more patience on changing the rate trajectory and thus US yield curve flattening continued as the 30Y was higher in price and the leader on the day dropping nearly 8bp:
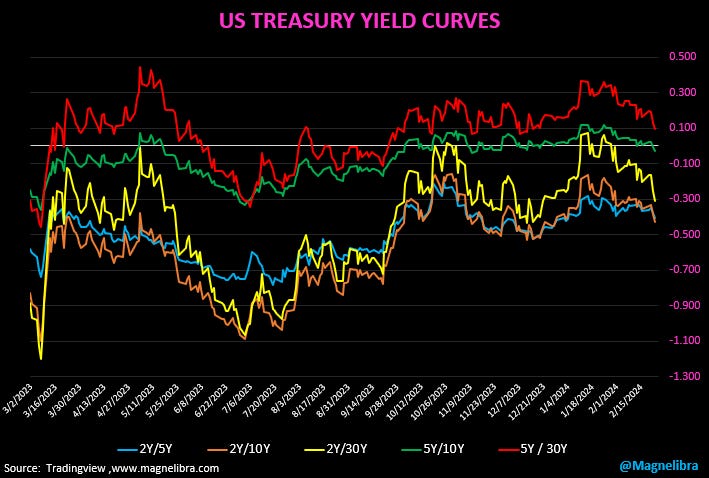
Looking at the US curves over time, we can see the flatter trend is now firmly in place and the 5s30 spread is now back to early December lows:
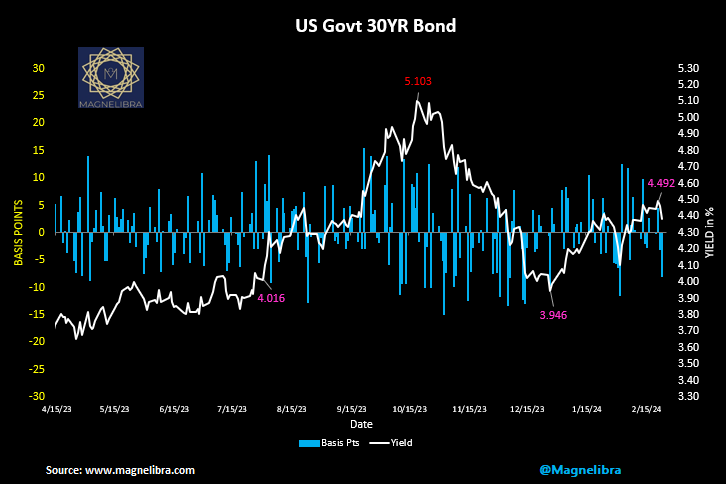
Overall the 30Y continues to see interest at the 4.40/4.45% area as we suspected. We would like to see a continuation move lower from here throughout March as we have backed up about 55bp since the lows in late December:
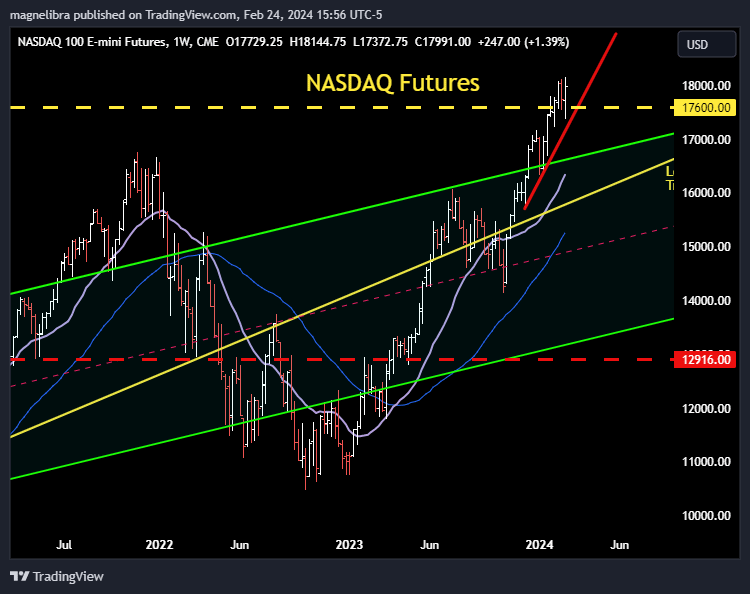
Ok lets move to the Nasdaq and SP500 futures chart. You guys know our line to watch is still 17600 and you can see that the bulls continue to defend it as the Nasdaq futures ended +1.39% on the week closing out at 17991. We will continue to believe that the markets might battle it out around this area for a bit as we adjust to the major pop higher post Nvidia earnings. 17600 will continue to be our key and a weekly close below there will flip sentiment to the downside, for now, bulls still in control:
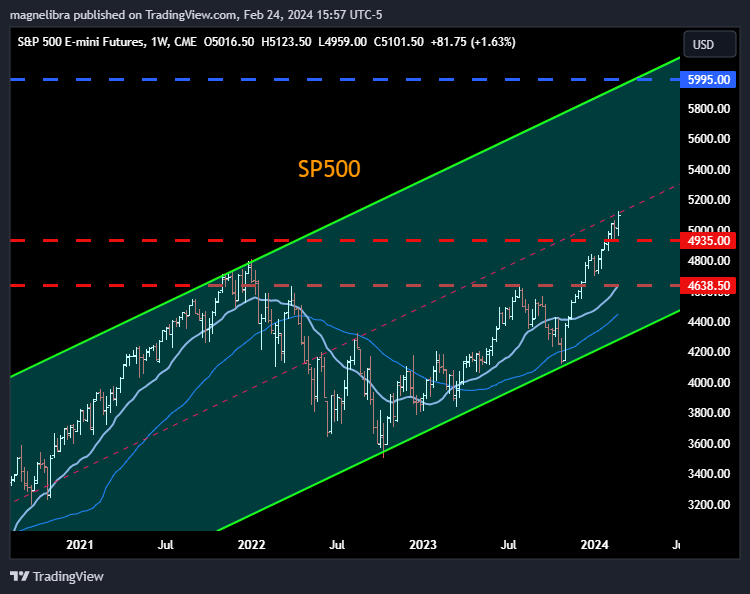
As far as the SP500 futures it has hit the midline of our parallel trend channel, posting a +1.63% weekly move closing above 5101. 4935 is our key downside area and we would suspect support to arrive there on any pull back. Let’s see how the 5100 area performs, we should see early sellers against this level forcing the market to back off some initially this week, but by weeks end we will see if we are above 4935 or not, if above, well then bulls are still well in control, if below, sellers would seem to be more dominant, so let’s keep an eye on these areas:
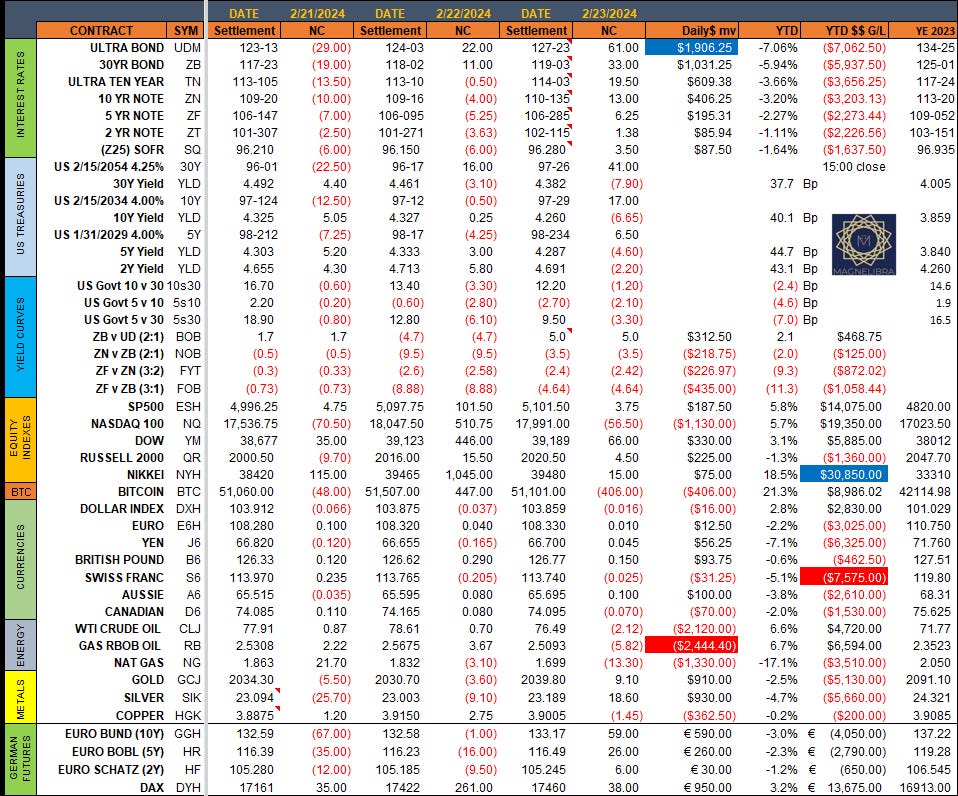
Ok lets move on to our subscriber settlement sheet where we have included all data from Wednesday thru Friday. Friday’s data includes the roll in interest rates from March to June, we also rolled to the Z25SOFR contract and changed the ratio in the BOB spread from 7 to 5 to 2 to 1 for those keeping track. We also rolled Silver and Copper contracts from March to May:
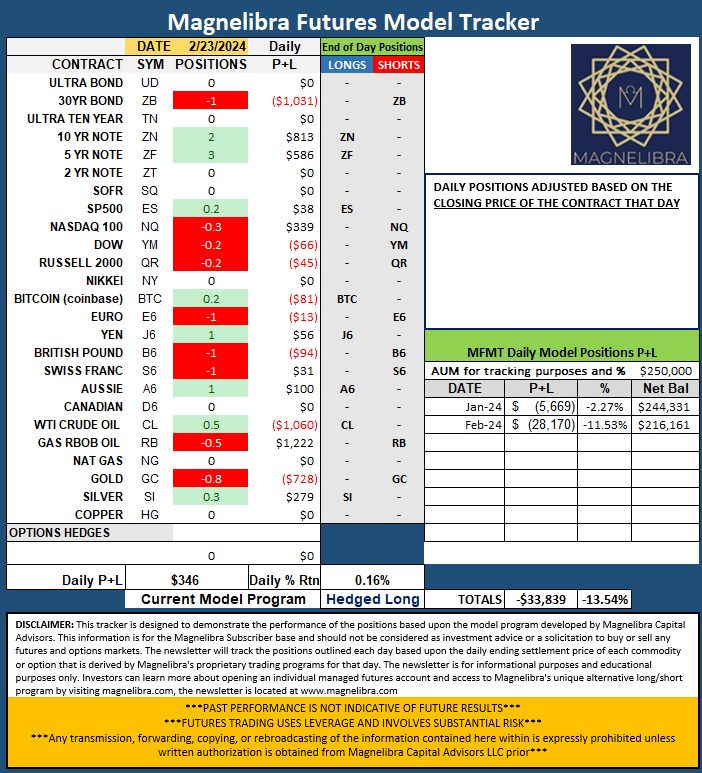
As far as the Futures Market Tracker no changes to the sentiment:
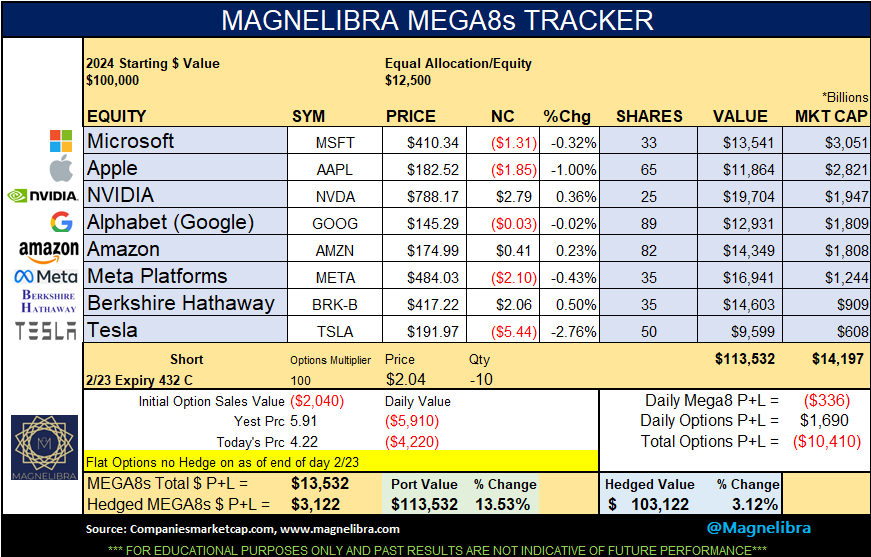
When we look at the MEGA8s Nvidia moved up the ranks last week by 2 spots jumping over Google and Amazon. Tesla is once again the weakest link, it had a good run back testing the $200 area, but has failed multiple times there now. The MEGA8s Tracker does not have any hedge on for next week yet:
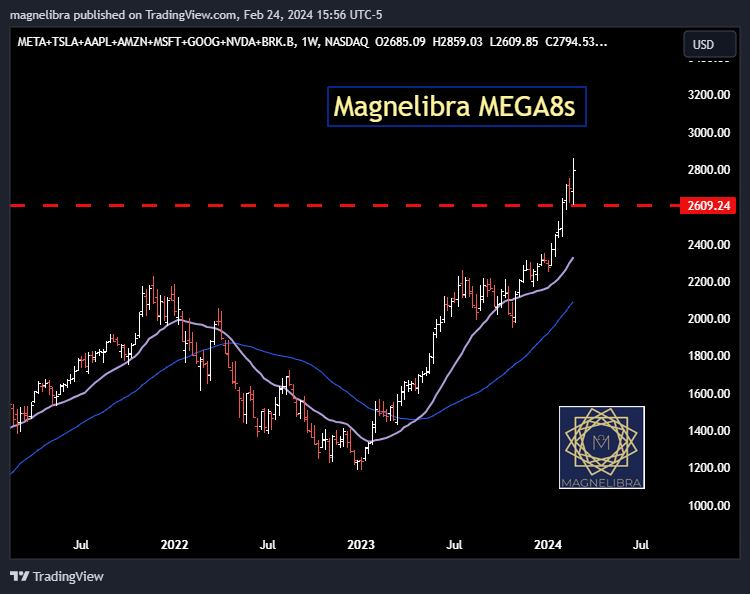
Here is the group in a price chart, what a weekly bar! We would suspect some back and forth here now with Nvidia earnings out of the way:
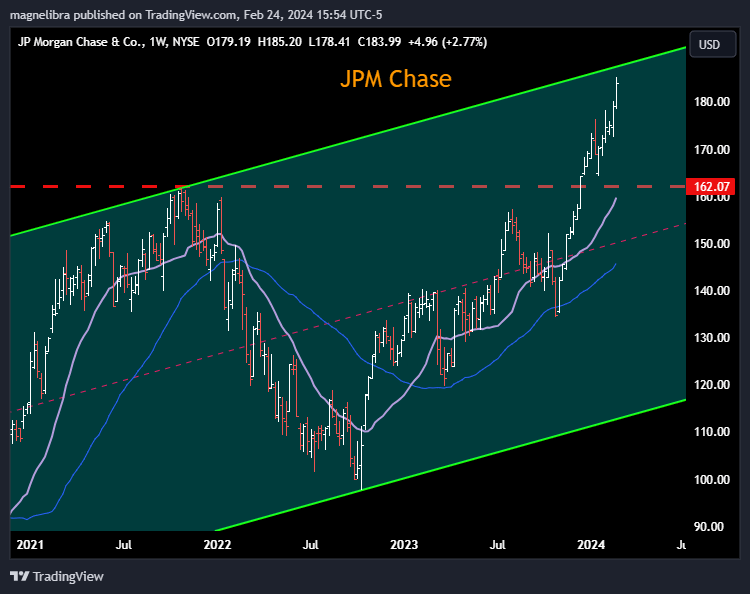
One last chart we have is JPM what a run and one we suspected awhile back as the $162 area was breached. It too like Berkshire is nearing the top end of our weekly parallel channels and this could be the area that larger players begin to nibble on the short side.
Ok let’s end this with two items, one the US treasury is on tap for nearly $400Bn this week in debt auctions which include new 2s,5s and 7s! $400Bn and the US govt sets a minimum wage at what $14? Can you imagine the dislocation of reality at the state level from the private sector. Sorry the problem is not being addressed and its why Marx always says Capitalism leads to Socialism, because pure capitalism gets hijacked and coopted at all levels and leads to a massive dislocation in relative incomes. Anyway, let’s see how the supply is swallowed here, with yields up over the last few weeks, we suspect the auctions will go well.
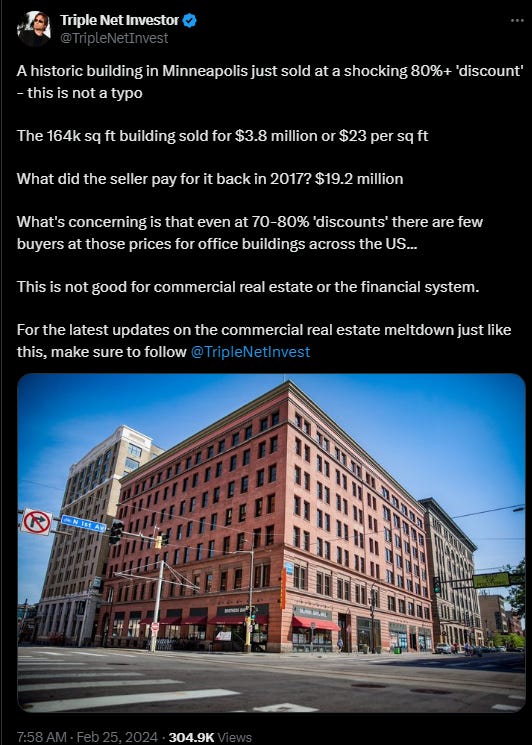
As for our second item, take a look at what we continue to see out in CRE land, this is a post from at TripleNetInvest on X and the question we have is how many 50% plus discount sales do we need to see before capital ratios are readjusted across the board! In modern day finance is risk so spread out so diverse that money can be destroyed by the billions and nobody actually takes a loss? Are pensions, insurers, PEs, REITs, Conglomerates so liquid and flush with cash that their assets can be dumped for pennies on the dollar? Is there so much excess liquidity that write downs and losses of this magnitude have little to no effect on balance sheets? Honestly is it just one wealthy corporate conglomerate selling off to an even bigger more wealthy conglomerate? What gives?
Alright that is it, this is too long, we apologize and we hope to be fully back on track here this week. We aren’t going to make too much of an opinion on this euphoria, but one thing is certain, money is being devalued far quicker than many can fathom and its why single issue stocks can rise $250Bn dollars in one day. Till next time, please share, give a like and or subscribe. Cheers.