
Nvidia Options Analysis
US Yield Curves and Tracker Updates

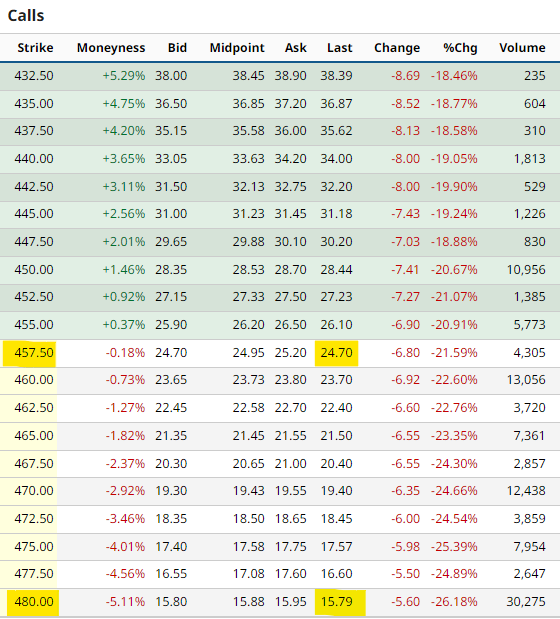
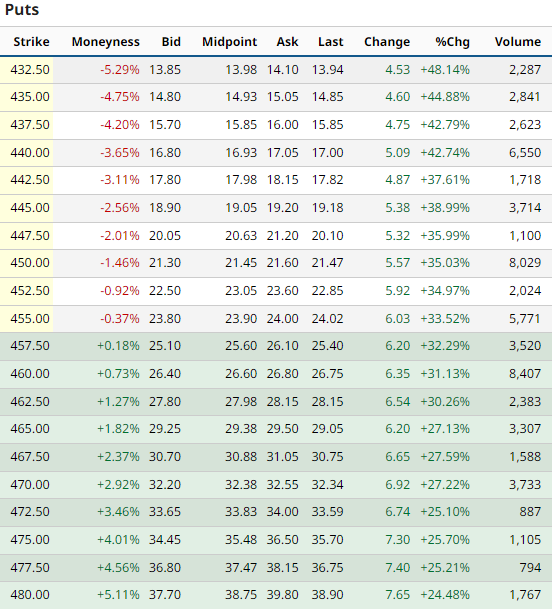
Nvidia earnings are on Wednesday, let’s take a look at the options skew by looking at the cost of the ATMs of the 3 day expiration options. Let’s use a strike of $457.50, the Calls are priced at $24.70, so this implies a 5.3% move higher for breakeven. When we look at the same strike Put we have a price of $25.40 or a down move of 5.6% for breakeven. As far as the straddle owning both, will cost you $50.10 or a breakeven of $507.60 on the calls and $407.40 on the puts. Then when we look at the open interest across the Calls and Puts. Here are the open interest numbers at the specific strikes:
460 Calls = 132056, 480 Calls = 30,275, 500 Calls = 19,122
460 Puts = 5,048, 450 Puts = 3,824, 440 Puts = 4,752, 420 Puts = 10,412
Obviously the skew is heavy on the calls and we would suspect that the market if it does move higher off the numbers that sellers will be there to offset a lot of this. (Barchart data)
As far as Nvidia’s chart, we do not like the look of it, could it push higher sure, but it would be a moment euphoria blow off top. The fundamentals moving forward do not warrant or justify the multiples here from our purview:
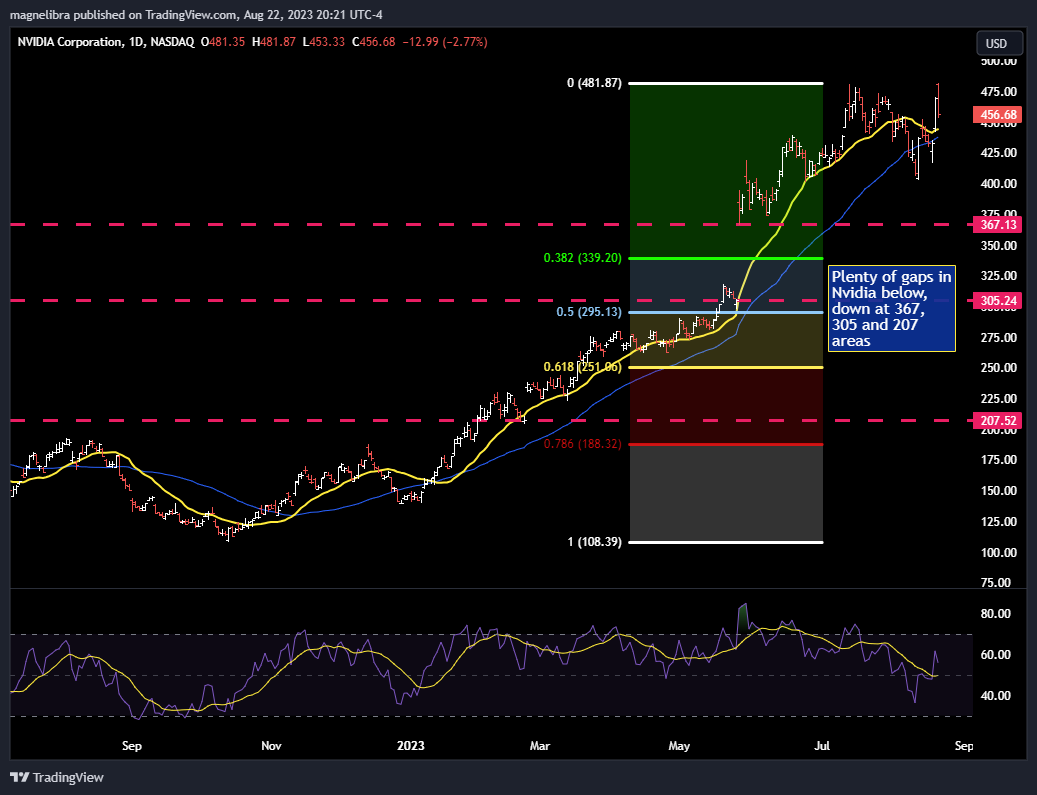
The October $350/300 put spread is $4.14, if bearish this looks like a decent risk reward play with 2 months to expiration if this is indeed a top. Risk $4.14 to make $50 or a 12:1 payoff.
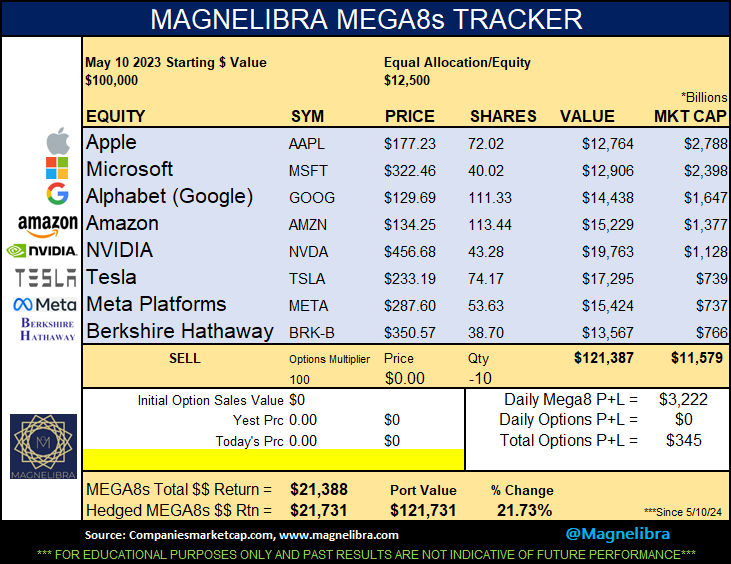
Nvidia has held up the best over the last few weeks during this recent selloff and its evident in our next chart here:
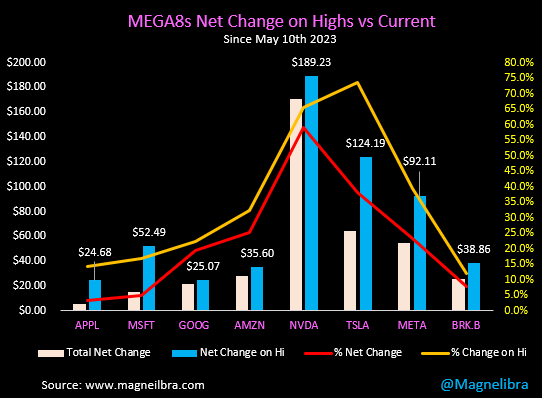
When we look at the MEGA8s as a whole they were basically as a group today unchanged, still down some $700 Billion as a group from their recent market cap high:
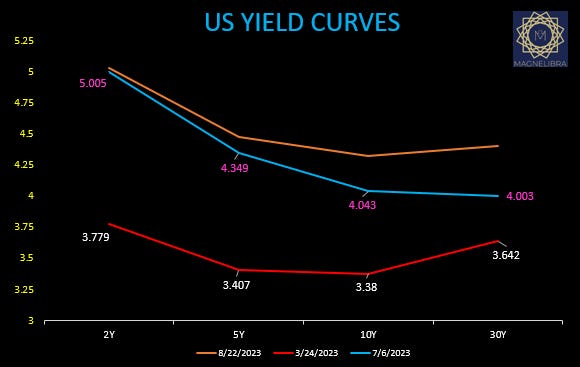
When we look at the US bond market, it continues to trace out new yield highs as the 2s thru 30s are now above the July 6 yield highs:
We do not believe most investors understand how the carnage in the US bond markets is devastating many financial balance sheets, especially those beholden to mark their positions to market. This negative carry and outright position loss is massive and is continuing to destroy smaller banks abilities to withstand any credit losses or write downs on other assets. We know the rating agencies are starting to send out the warning signals and we suspect even the major insurers are taking heavy losses. We did highlight Metlife Inc. a few weeks ago and its moved steadily lower since:
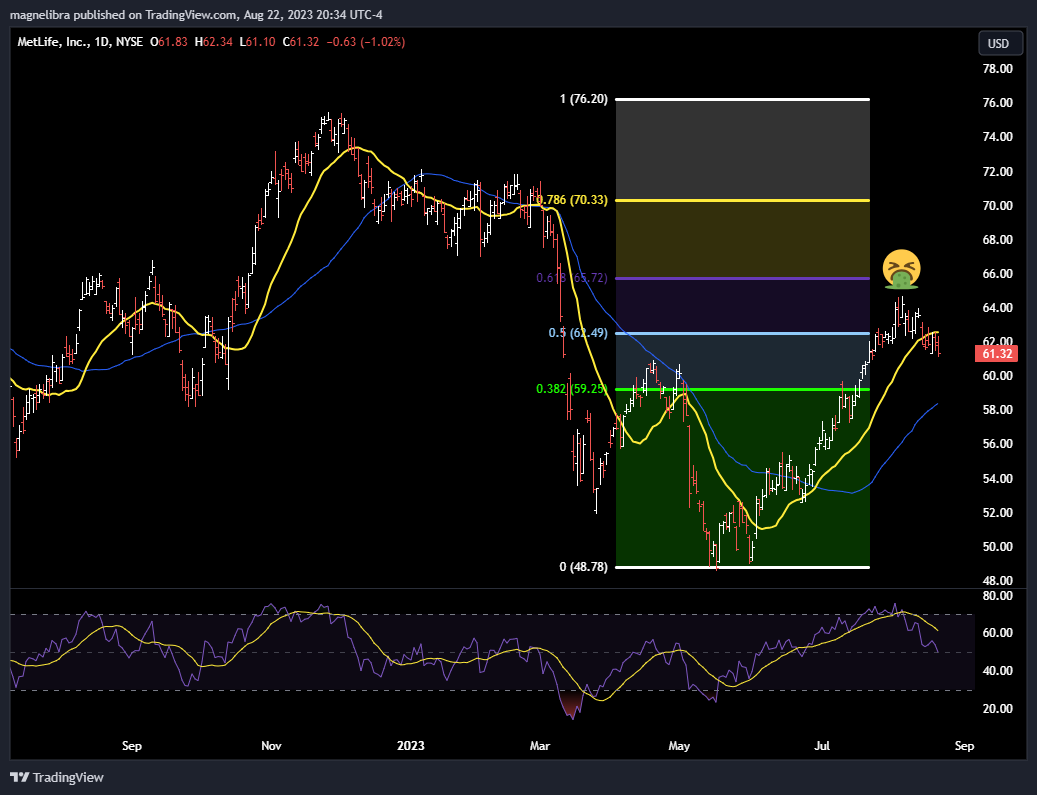
So we suspect the bond market carnage to continue to wreak havoc and the equities will be discounted to meet all of this new relative value.
Let’s look at today’s settles:
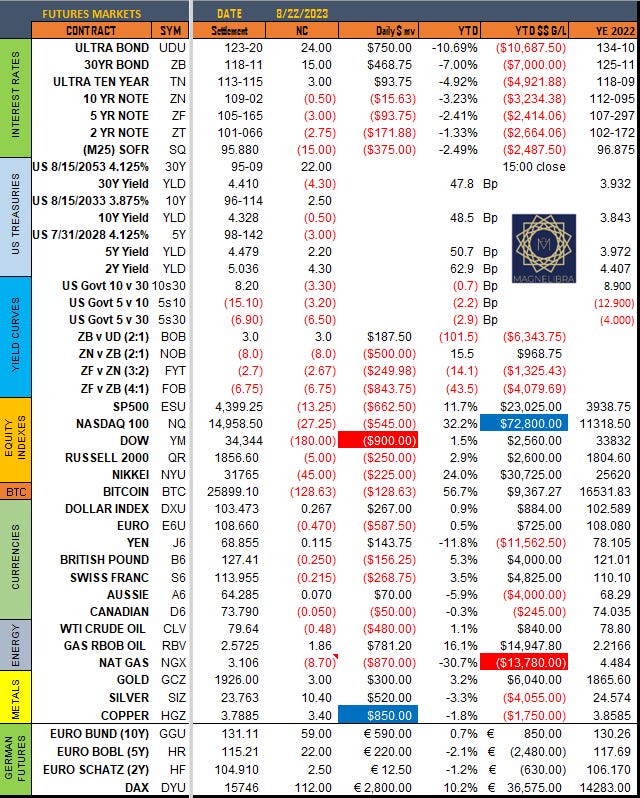
Risk off across the board except the metals!
As far as our GFBP tracker:
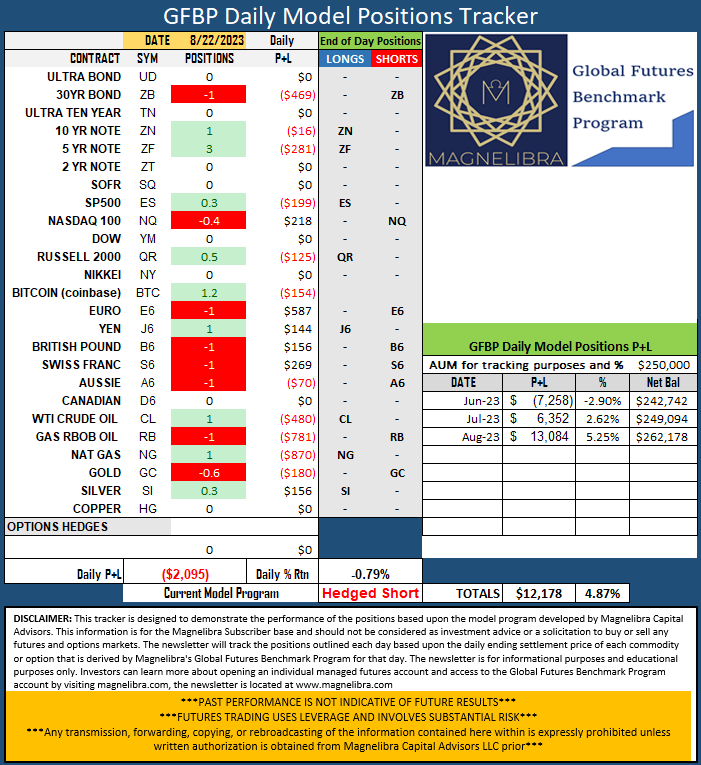
The program in general will hit an all out flat liquidation should overall positioning fall a bit further, its a defense mechanism to lock in P+L, we aren’t there yet but its getting close.
Finally we wanted to leave you with this home affordability chart:
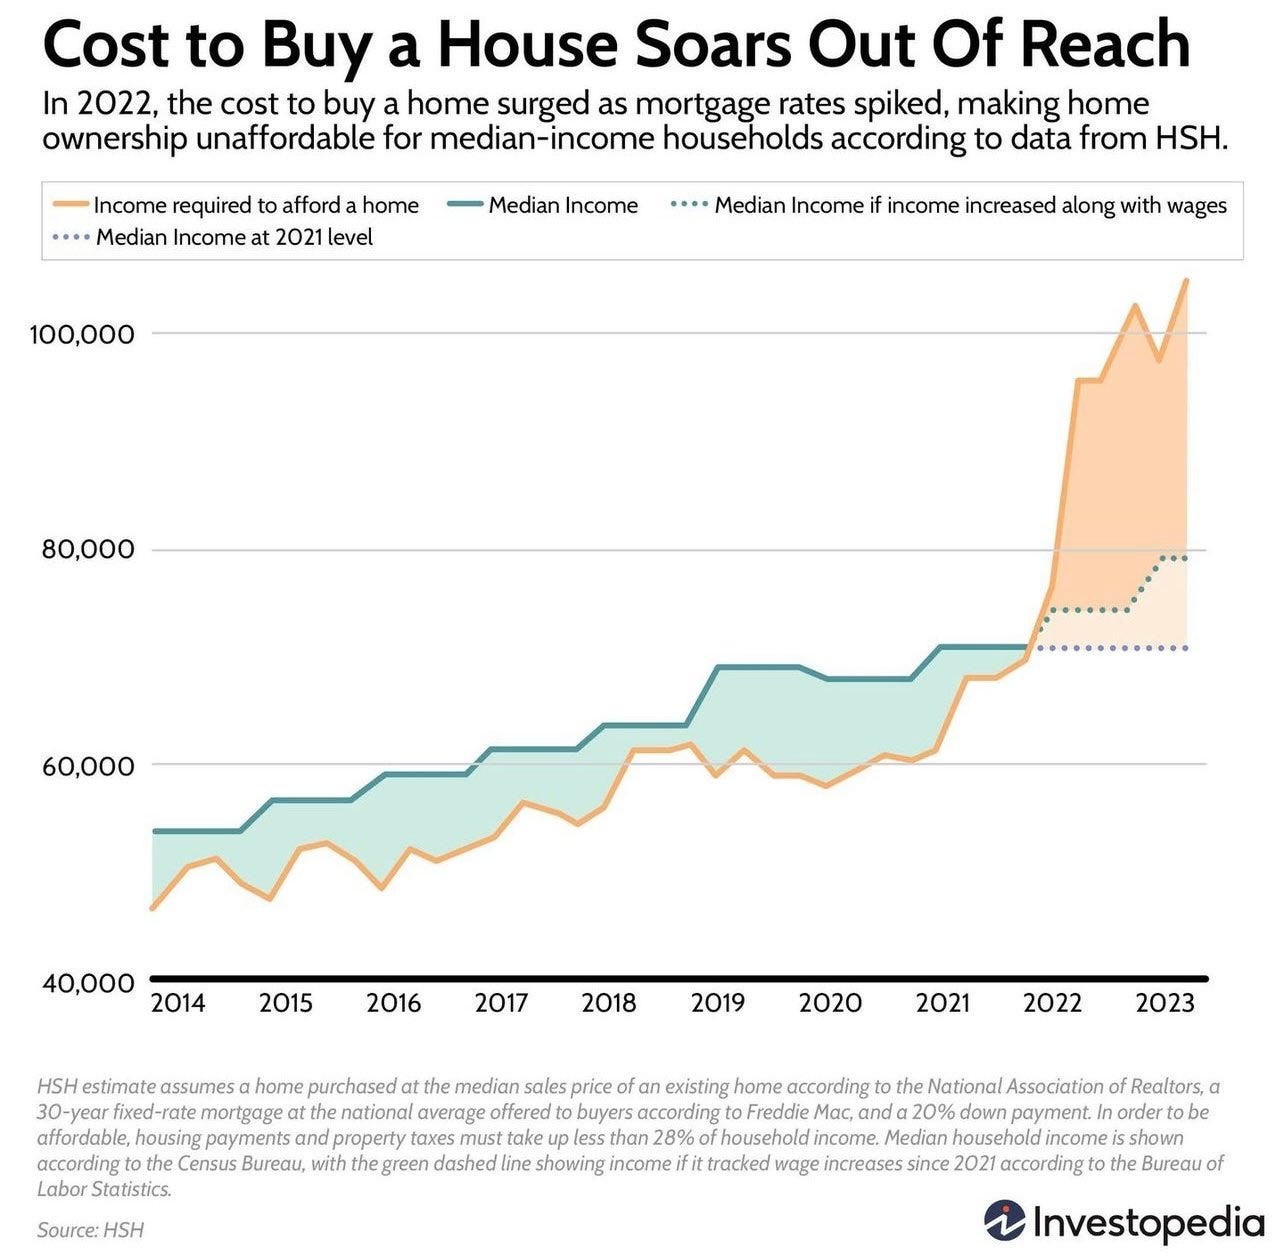
This is not sustainable, and what is not sustainable, will revert, this chart will be no different!
DISCLAIMER: For educational purposes only. This is not a solicitation to buy or sell commodity futures or options. The risk of trading securities, futures and options can be substantial and is not for everyone. Such investments may not be appropriate for the recipient. The valuation of futures and options may fluctuate, and, as a result, clients may lose more than their original investment. Nothing contained in this message may be construed as an express or an implied promise, guarantee or implication by, of, or from the author Michael Agne owner of Magnelibra Capital Advisors. Magnelibra the CTA and its Global Futures Benchmark Program may hold long and or short positions in the various futures and markets that Magnelibra covers. We will never claim that you will profit or that losses can or will be limited in any manner whatsoever. Past performance is not necessarily indicative of future results. Although care has been taken to assure the accuracy, completeness and reliability of the information contained herein, we make no warranty, express or implied, or assume any legal liability or responsibility for the accuracy, completeness, reliability or usefulness of any information, product, service or process disclosed.