Payroll Miss, Bull Steepener, And Equity Breakout Confirmed
July NFP -23K vs +83K estimate. May and June revised down 103K combined. 30Y at June 2007 levels. FMTP flipped from 3 shorts to 8 longs. The systematic tape confirmed what the print set in motion.

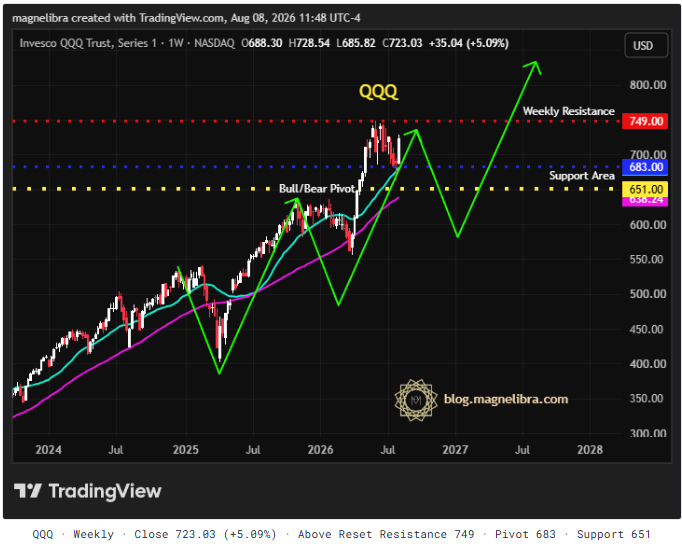
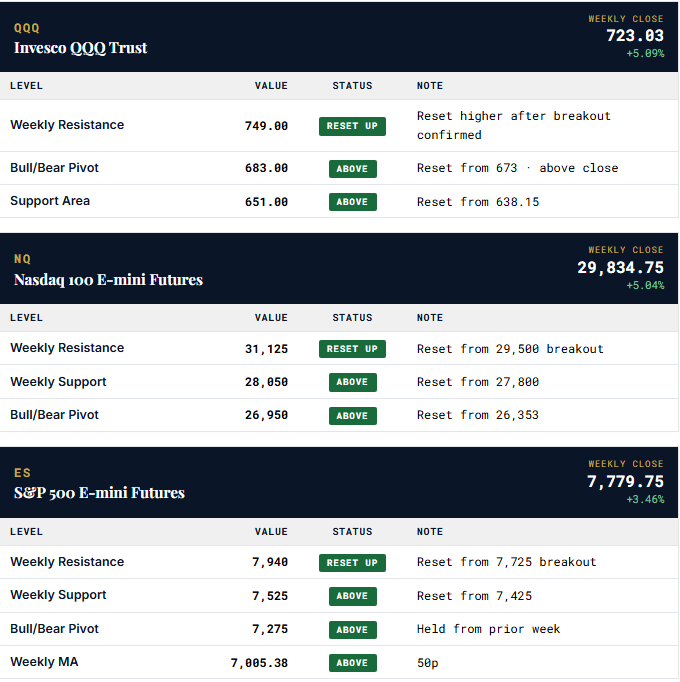
The equity breakout confirmed despite huge miss on the payrolls print. QQQ closed the week at 723.03, up 5.09%. NQ futures added 4.95% to close 29,834.75. ES futures added 3.41% to close 7,779.75. All three equity index proxies printed second consecutive weekly closes above their resistance lines, and every one of those lines has now been reset higher on the technical map. This is not a breakout waiting to be tested. This is a breakout that has been tested and held.
The yield curve bull steepened on Friday. The 2Y fell 4.4 basis points against a 30Y that fell only 1.0 basis point. The front end capitulated hardest, exactly the shape a market repricing a faster Fed easing path produces. The 30Y at 5.202% sits at levels last seen in June 2007. Yields should stabilize from here, but the direction of travel is now set. Considering the abysmal jobs report, as we suspected rate hike expectations for September plunged.
The Print: July Nonfarm Payrolls · Released 8/7/2026
The Data Behind Friday’s Repricing · BLS
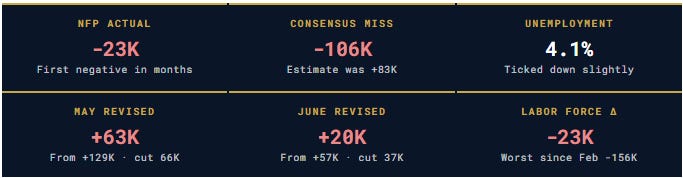
The headline missed consensus by 106,000 jobs. The more consequential damage sits in the revisions. May and June combined surrendered 103,000 jobs from prior estimates, retiring gains that had been printed and celebrated as evidence of a resilient labor market. When downward revisions of this magnitude become the pattern rather than the exception, market participants start treating the initial prints as noise and the revisions as signal. The Friday session repriced accordingly.
The labor force shrank by 23,000 in July. This is the mechanism keeping the unemployment rate anchored at 4.1% even as employment turned negative. Fewer people counted as looking for work compresses the denominator. When employment and the labor force fall by the same amount, the unemployment rate ticks lower on paper while the underlying condition of the labor market has demonstrably worsened. The Fed watches labor force participation as a signal of structural slack, and this print reads as demand-side capitulation. September Fed cut expectations repriced sharply on the release, and the systematic tape confirmed the shift: the FMTP flipped four fresh long positions on the same settle, discussed in §I below.
§I Futures Market Trend Program
FMTP · 20-Market · Settle 8/7/2026 · Regime Shift
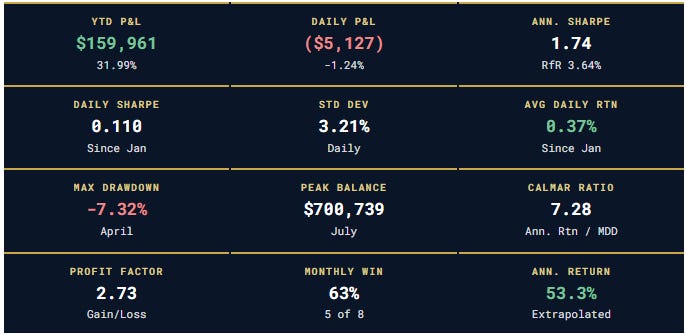
What You Are Reading: Base capital note. Beginning with the 2026 reporting cycle, the FMTP is presented on a $500,000 institutional base to align with the FTS Daily Signal published to the Founders Circle. Dollar P&L per single-contract position reflects actual per-contract results and is unchanged; account balance and percentage returns are computed against the $500,000 reference. This alignment gives Founders and Full Coverage subscribers a single institutional benchmark across both programs.
The FMTP is a 20-market systematic trend-following program covering interest rates, equity indexes, currencies, energy, and metals. The 8/7 settle triggered a regime shift: four fresh long positions activated in DOW, Russell 2000, Aussie Dollar, and Canadian Dollar. Two shorts flipped to neutral. The program went from carrying 3 shorts and 4 longs to 1 short and 8 longs in a single session. All results hypothetical and educational.
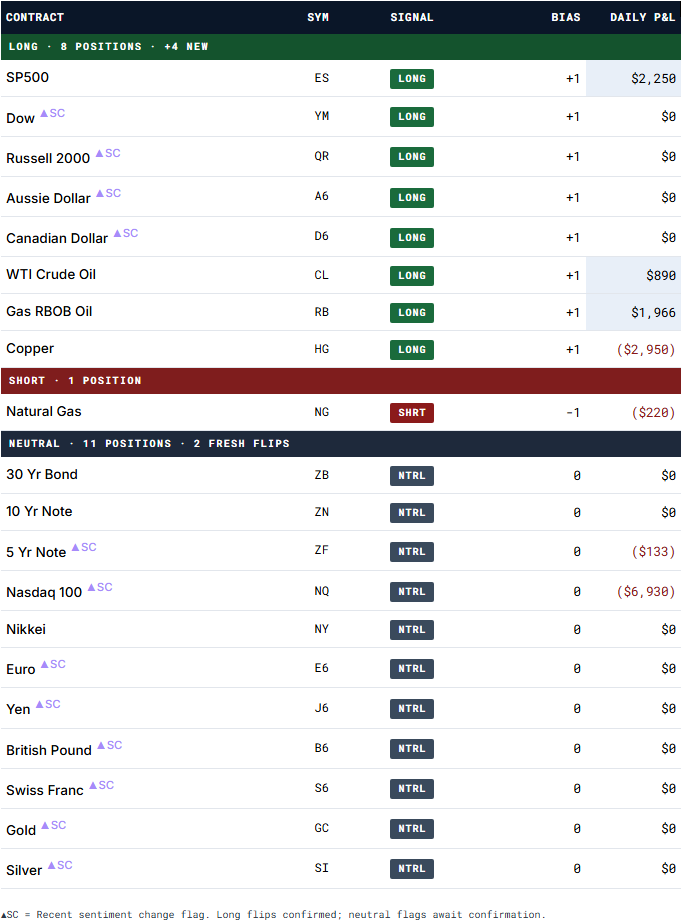
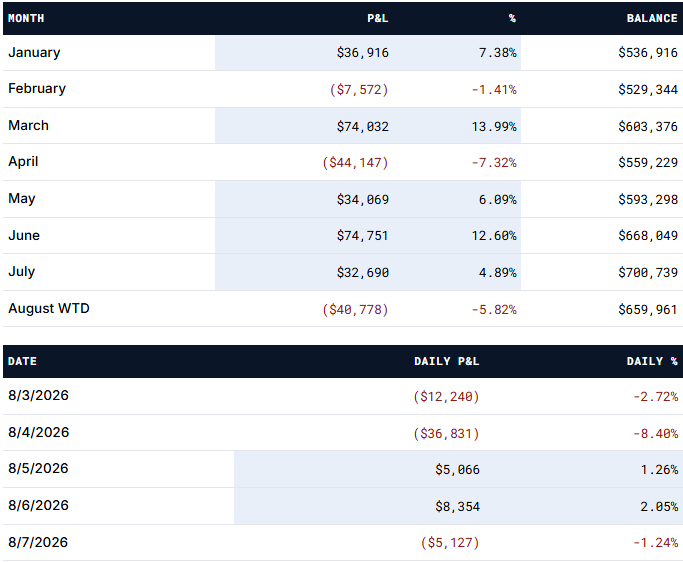
The program signal book underwent the largest single-day repositioning of the year on Friday. The equity complex went from short-heavy to long-heavy in one settle, with Dow, Russell 2000, Aussie Dollar, and Canadian Dollar all flipping into fresh longs on the payroll-driven session. The five-year note short and the Nasdaq 100 short both flipped to neutral, meaning the program neither confirms nor fights the current move in those two markets.
The pain of the day came from the Nasdaq short residual and the copper long, which absorbed $9,880 in combined losses. The equity, energy, and RBOB longs offset most of that. The August drawdown stands at 5.82% and the month is not yet halfway complete. Historically this program pattern (large April drawdown followed by aggressive June and July recovery followed by August pullback) resolves higher when the position book rotates to net long across sectors, which is what the Friday close produced.
§II MEGA9 Tracker & QQQ Hedge
Equal-Weight Mega-Cap Basket · Settle 8/6/2026 · Leadership Trigger 3650 Level
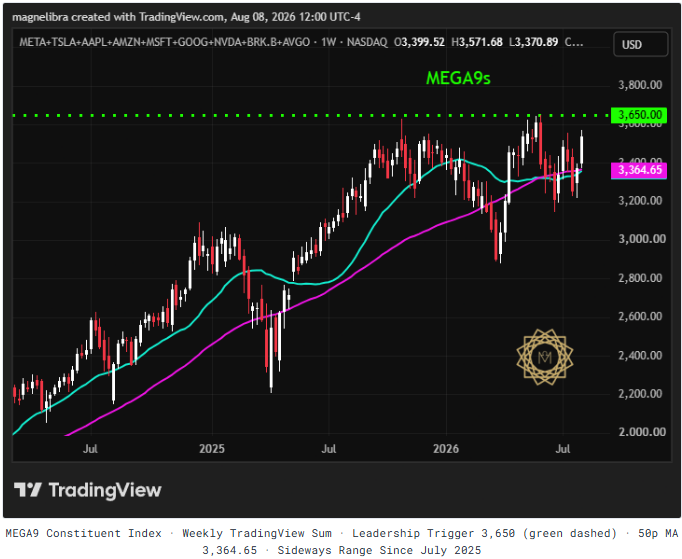
What You Are Reading: MEGA9 is an equal-weight basket of the nine largest U.S. equities by market capitalization, initialized at $100,000 with $11,111 per name. The QQQ options overlay is a discretionary hedge. Watch the Magnelibra internal TradingView MEGA9 constituent index: a weekly close above 3650 confirms tech-led leadership resuming from the July 2025 sideways range. Below 3650, the range continues.
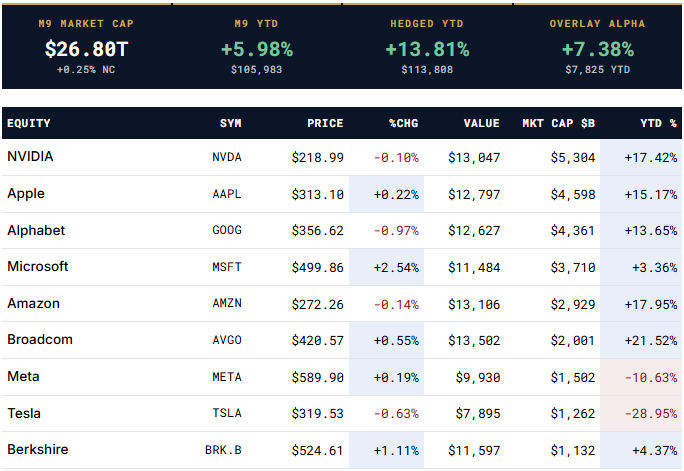
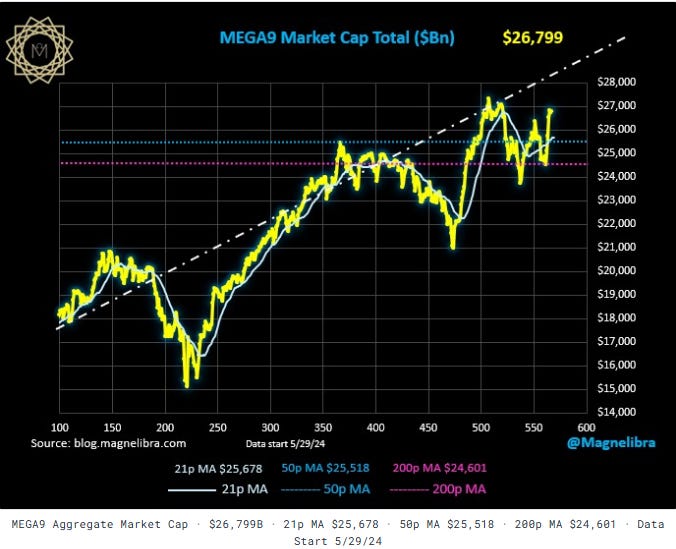
MEGA9 constituent-level closes are through Wednesday 8/6 (the tracker refreshes end-of-week). Aggregate market capitalization is $26.80 trillion, up 0.25% on the day. The unhedged basket sits +5.98% YTD. The QQQ overlay adds a 7.38 percentage point alpha for a hedged YTD of +13.81%. The current overlay position is flat options hedges after the last weeks moved stopped out at $10.00 from a $5.00 entry.
On the internal TradingView MEGA9s constituent index, watch 3650. A weekly close above 3650 confirms tech leadership resuming from what has been a sideways range since July 2025. Below 3650, the mega cap complex remains in the same distribution zone the index has traded since last summer. That single level is the tell for whether the equity extension broadens back into the seven names that have carried the year, or whether it stays with the small caps and industrials the FMTP just added.
§III Interest Rate Futures
CBOT Settlements · 8/7/2026 · Bull Steepening
What You Are Reading: Interest rate futures settle prices in 32nds (108-16 reads as 108 and 16/32). Falling yields mean rising bond prices. The Weekly Change columns compare Friday settle to the prior Friday, and the Monthly Change reflects the trailing 30-day move. Positive futures moves this week reflect the bull steepening: bond prices rose as yields fell.
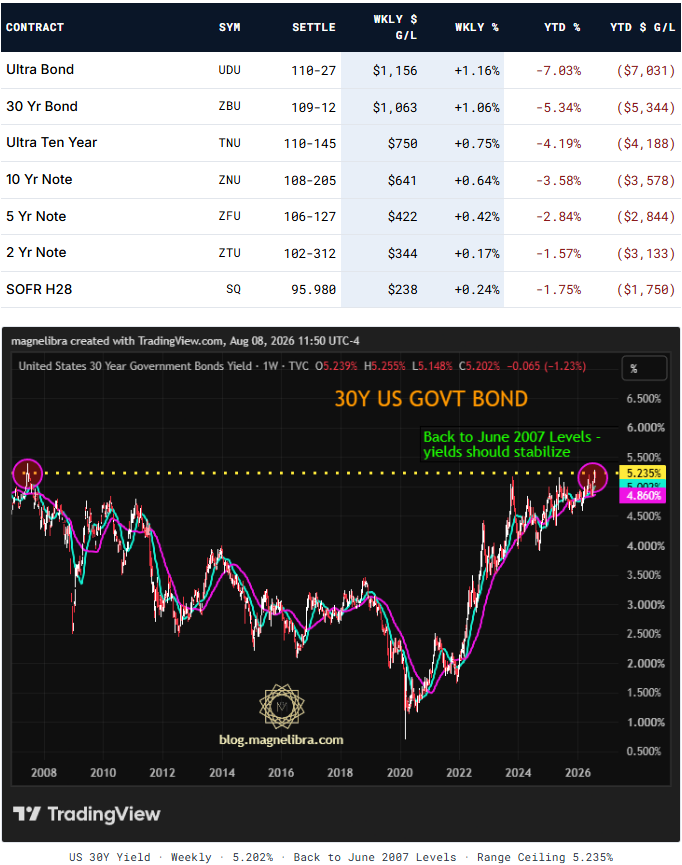
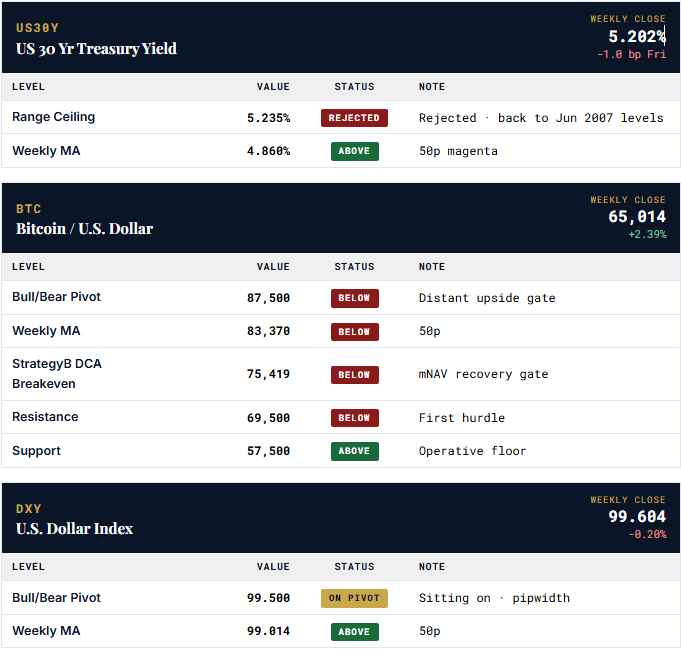
The 30-year yield sits at 5.202%, back to levels the market has not seen since June 2007. That is a historically loaded reference. The 2007 pre-crisis print marked a top before the yield complex spent 15 years in a lower range. This time the driver is different (fiscal issuance and term premium rather than a hawkish Fed) but the level itself carries technical weight. The daily high was up at 5.281% while the weekly high on the current move was 5.255%, and Friday closed 5.3 basis points below that level after the payroll print. Yields should stabilize in this zone for reasons we covered earlier this week in regards to duration hedgers. If they do not, the next stop is unmapped territory above the 2007 highs.
§IV US Treasuries & Yield Curve
On-The-Run Settlements & Curve Spreads · 8/7/2026
What You Are Reading: Yields fell across the curve on Friday, but not equally. The 2-year fell 4.4 basis points against the 30-year that fell only 1.0 basis point. This asymmetric decline is the bull steepening pattern: front end reprices faster than long end, curve spreads widen. The historical curve comparison chart shows where we stand against March 2023 (pre-hike terminal) and October 2023 (peak long-end yields cycle)
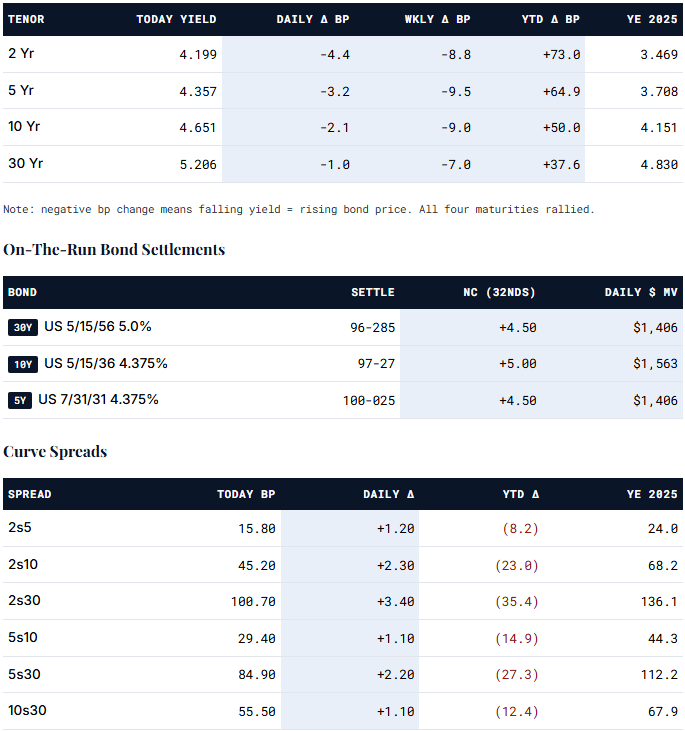
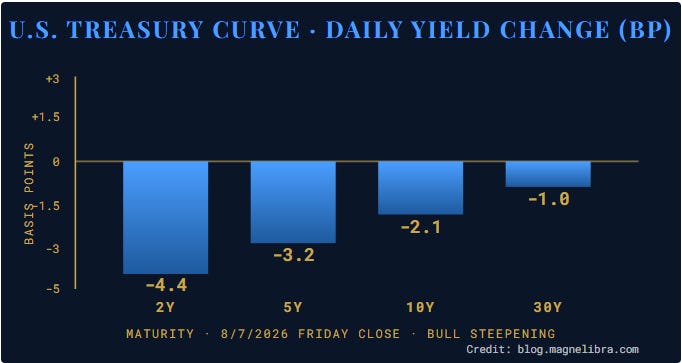
Every curve spread widened on Friday. 2s10 added 2.3 basis points to 45.2. 2s30 added 3.4 to 100.7 and cleared the psychological 100 mark. 5s30 added 2.2 to 84.9. This is the shape a market pricing in aggressive front-end cuts produces. Not a hard-landing steepening (which would typically be more violent and correlated with credit stress). Not a bull flattener (which would signal recession pricing). A textbook bull steepening on the back of a soft data print.
The historical context is meaningful. YTD, every tenor is still higher than the December 2025 close. 2Y up 73 basis points, 30Y up 37.6. The Friday move is the first significant rally against the year’s steady bear flattening trend. Whether it holds depends on the next payroll print and CPI release. If both confirm softening, the curve extension has months of room to run. If either surprises hot, this becomes a false break and the trend reasserts.
Next week the U.S. Treasury set to auction off $391 Billion in supply which includes brand new 3s, 10s and 30 year paper.
§V Equity Index Futures
CME Settlements · 8/7/2026 · Coordinated Extension
What You Are Reading: Every U.S. index futures contract added between 2.8% and 4.95% on the week. This is the second consecutive week of coordinated equity gains. The technical levels the market broke last week were tested, held, and extended. Every resistance line on the charts has now reset higher on the technical map.
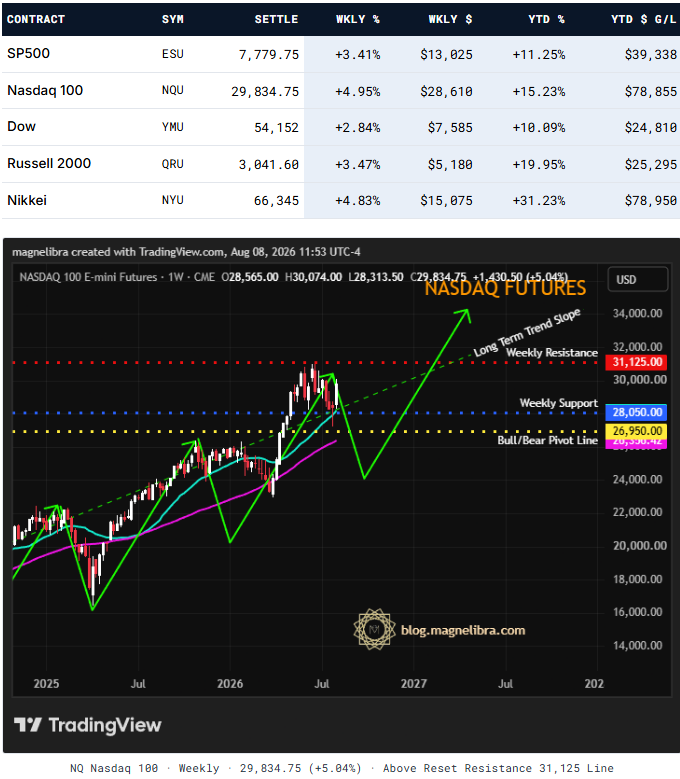
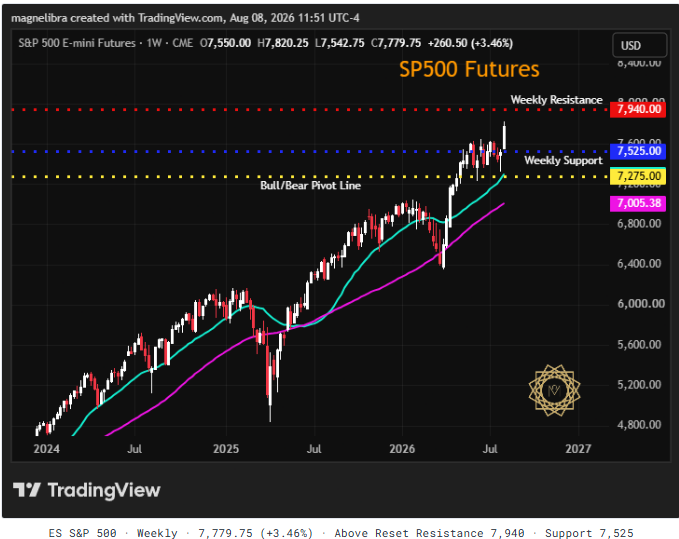
Every single equity index resistance has been reset higher. NQ resistance moved from 29,500 to 31,125. ES resistance moved from 7,725 to 7,940. QQQ resistance moved from 712 to 749. The reset is not a technical flourish. It is the recognition that the level was tested from above (support), and now sits below price as prior resistance turned support. That is how healthy breakouts look on the weekly frame.
Russell 2000 leads YTD at +19.95% and led on the week at +3.47%. Nasdaq futures printed the largest weekly gain at +4.95%. Small cap outperformance combined with mega cap catch-up is the shape of a broadening advance, and the FMTP added exactly that combination (Russell 2000 long, Dow long) on the Friday close. If the tape sustains this, the next resistance points on the map are NQ 32,000, ES 8,000, QQQ 780. The Long Term Trend Slope on the NQ chart continues to point toward 34,000 by mid-2027.
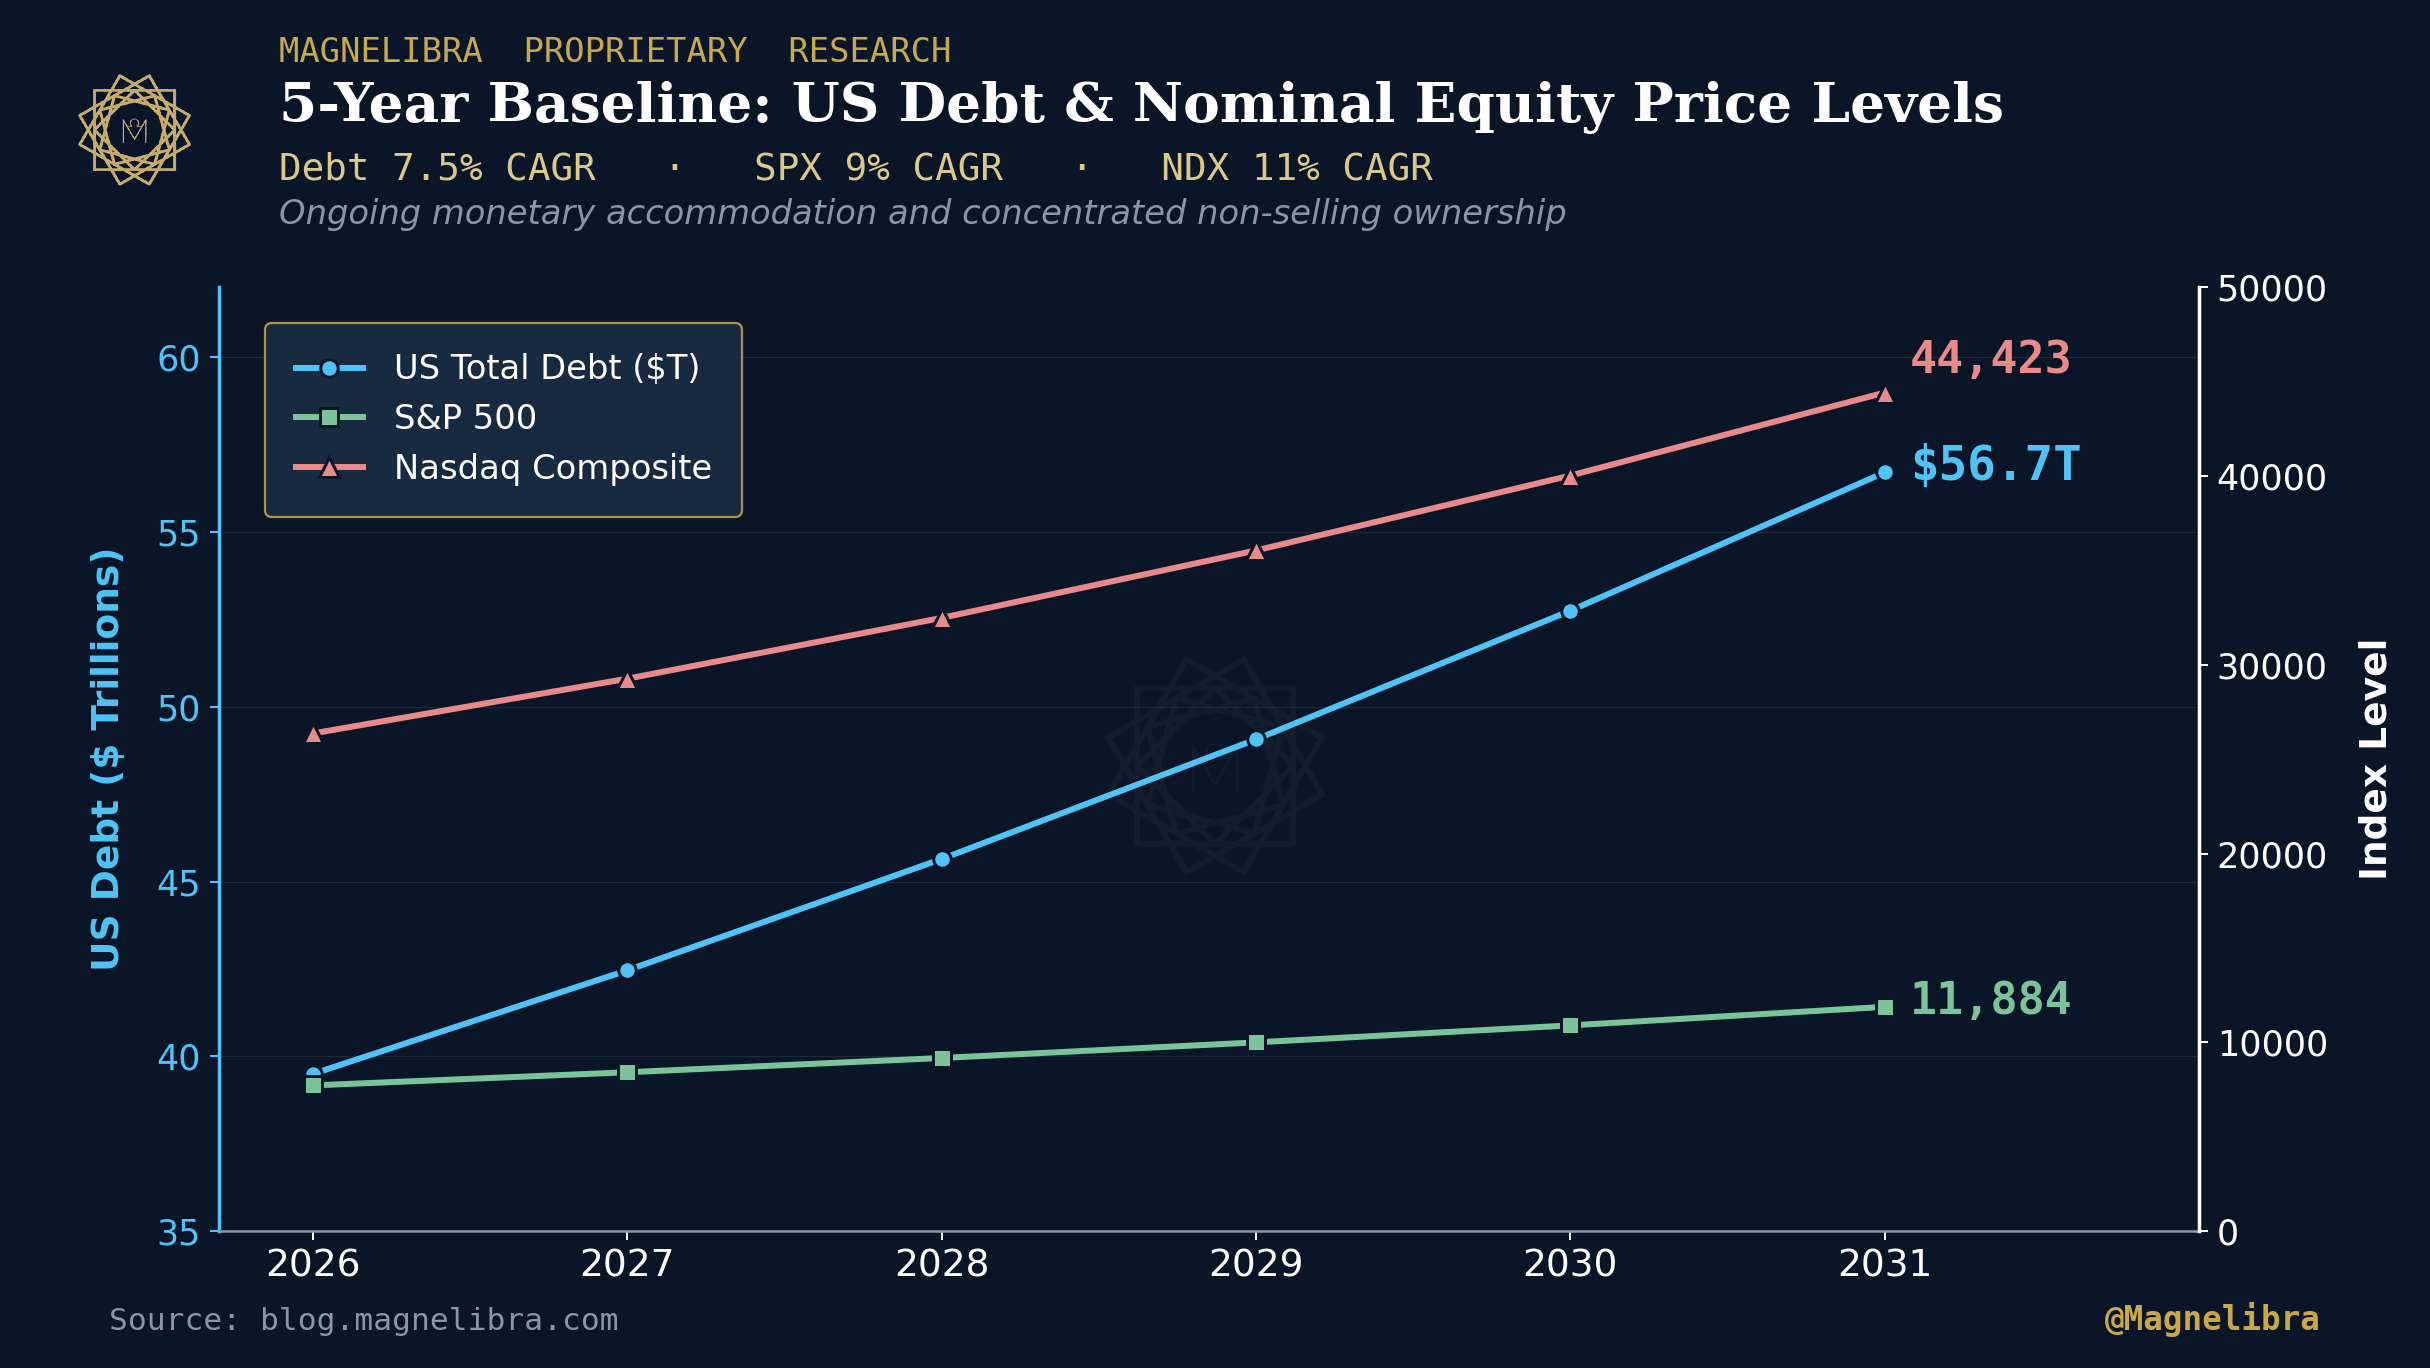
For those that didn’t read this weeks post with our 5yr baseline outlook please do so by clicking here, Why Expensive Doesn't Mean What it Used To
§VI Currencies & Bitcoin
FX Settlements & BTC Spot · 8/7/2026
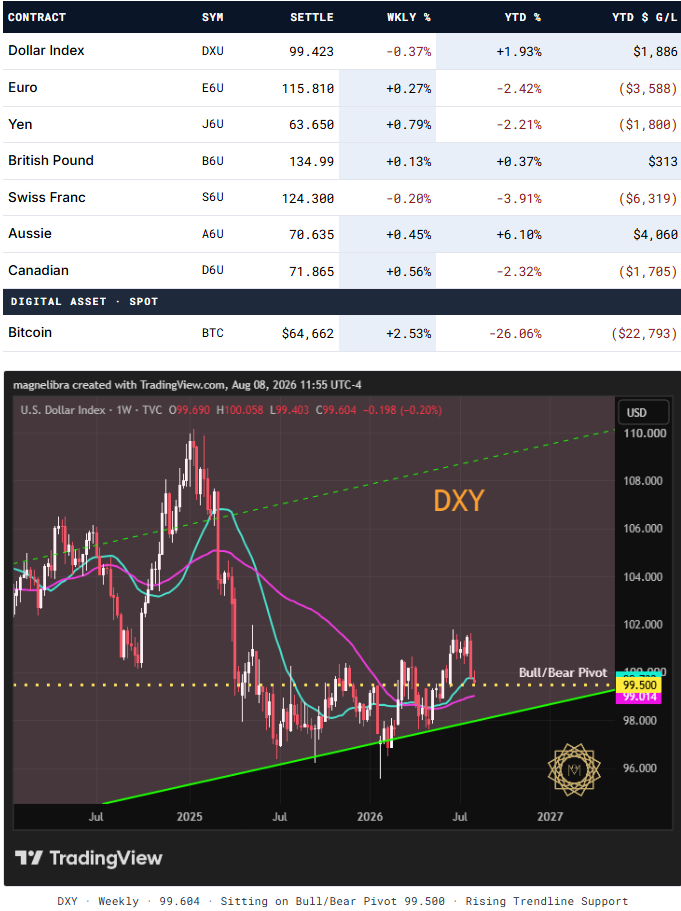
The dollar index sits directly on the 99.500 Bull/Bear Pivot. This is now the third consecutive week the price has closed within a pip’s width of the pivot. Weekly consolidation this tight against a decisive level typically resolves into a directional move within two-to-three sessions. The rising trendline from the 96.00 low sits just beneath. A decisive break of 99.500 to the downside opens the 96.00 test. A break higher opens the 102.00 area.
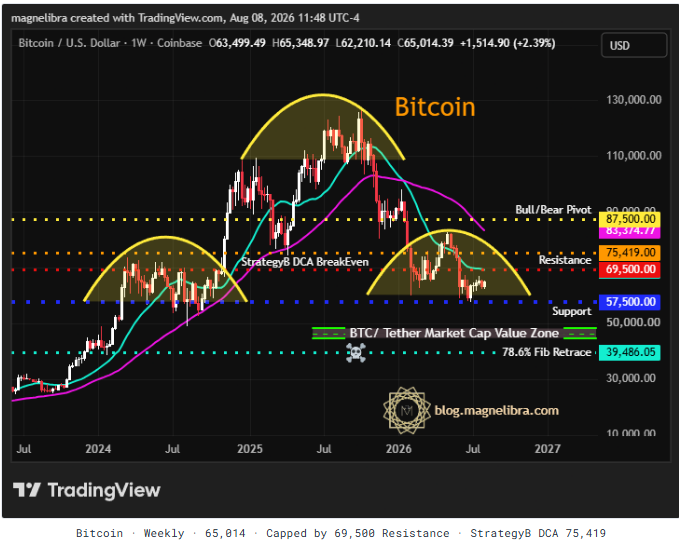
Bitcoin gained 2.53% on the week to close 65,014, still trapped beneath the 69,500 weekly resistance. The StrategyB DCA breakeven at 75,419 remains a distant target. Support at 57,500 holds. Bitcoin YTD sits -26.06%, one of the year’s worst-performing benchmarks and the sharpest divergence in the risk-asset complex given the equity extension. The BTC/Tether Market Cap Value Zone shown on the chart is where structural buying typically emerges. Below that zone, the 78.6% Fibonacci retracement at 39,486 sits as the terminal downside case.
§VII Energy NYMEX Settlements · 8/7/2026
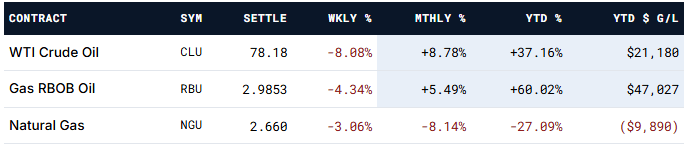
Crude gave back 8.08% on the week, the largest weekly decline of the year. On the 30-day board, crude still leads at +8.78%, and YTD it stands at +37.16%. This bifurcation, where the 5-day sits at the bottom and the 30-day and YTD sit near the top, is the shape of distribution. RBOB gasoline maintains the year’s dollar-value crown per contract at +$47,027, but also gave back on the week. Natural gas continues its year-long grind lower at -27.09% YTD.
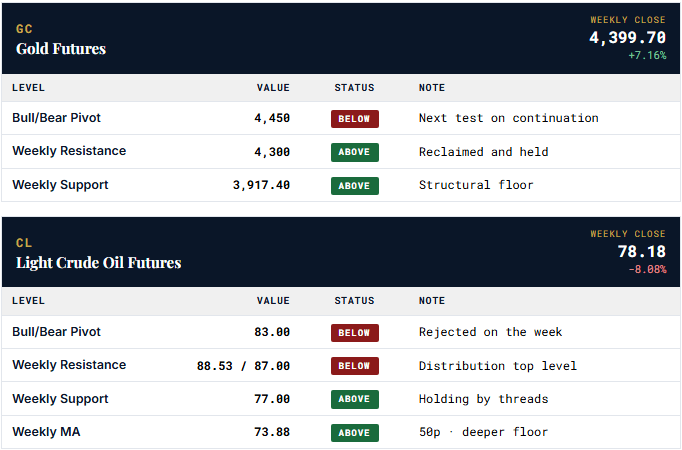
Technically crude rejected the 83.00 Bull/Bear Pivot on the weekly frame and now sits at 78.18. The 77.00 support level is the near-term line to hold. Below that, the 50-week moving average at 73.88 becomes the deeper floor. If crude closes beneath 77 next week, the distribution top thesis confirms and the next leg lower opens toward the mid 60s.
§VIII Metals COMEX Settlements · 8/7/2026
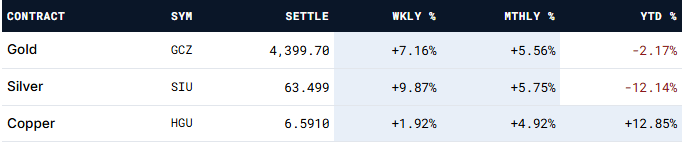
The precious metals complex was the week’s surprise leader. Silver closed +9.87%, gold +7.16%, both eclipsing every equity index proxy. This is the reflation trade coming to life alongside the bull steepening. Silver leads the 5-day winners board, gold sits second on the same board and third on the 30-day. This is the pattern that historically precedes broader commodity strength.
Gold reclaimed the 4,300 weekly resistance from below and closed the week at 4,399.70. The Bull/Bear Pivot at 4,450 is the next test. A weekly close above 4,450 opens the retest of the prior 5,600 area high. Copper closed 6.5910 up 1.92% on the week and remains the year’s industrial metal winner at +12.85% YTD.
§IX German Futures Eurex Settlements · 8/7/2026
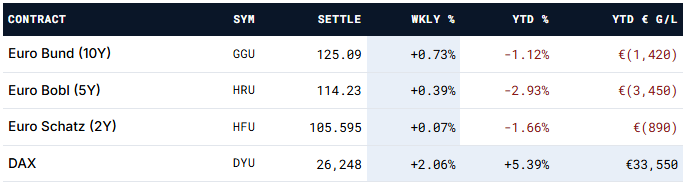
German rates rallied alongside the U.S. curve. The Bund, Bobl, and Schatz all added on the week, mirroring the bull steepening at U.S. duration. DAX added 2.06% on the week and now leads the European board YTD at +5.39%. The tight correlation between Bund yields and U.S. 10Y continues to define the European rates market this year.
§X Winners & Losers 5-Day · 30-Day · YTD Rank · 8/7/2026
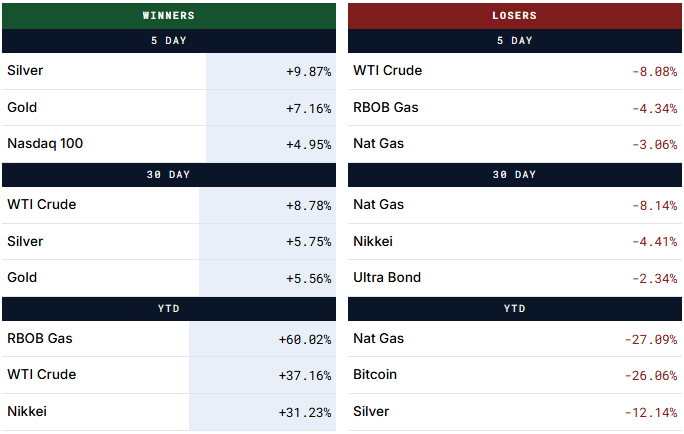
Silver and gold on the 5-day and 30-day winner boards. Crude on both the winner and loser boards for 30-day and 5-day respectively, the classic distribution top signature. Nat gas anchors the loser board across every window. Bitcoin remains one of the year's worst-performing benchmarks despite Friday's rally. The bifurcation between precious metals leading and energy softening is the reflation shift the curve is signaling.
Reference Key Levels Board This Week’s Technical Map · All 8 Tickers · Reset Levels Marked
BONUS Equity Focus The Regime Shift Behind The Move
The FMTP position book flipping from short-heavy to long-heavy in a single settle is not a coincidence. Systematic trend programs do not conspire with the tape. They respond to it. The fact that the Dow, Russell 2000, Aussie Dollar, and Canadian Dollar all triggered fresh long signals on the same session tells you the price action Friday was strong enough, and broad enough, to cross multiple independent trend filters simultaneously.
Broadening is the tell. The market’s YTD story until Friday was concentration. Seven mega cap names carrying a narrow index against a broader tape that was going sideways. The Friday session broke that narrative. The Russell 2000, up 3.47% on the week and now +19.95% YTD, is doing something small caps have not done since 2023. If the DOW confirms the trend on next week’s close, the “narrow leadership” story is over and the equity extension has real breadth behind it.
The 30-year yield at 5.202% is the counter-argument. That level was last seen in June 2007, three months before the credit crisis top. The setup is not identical (fiscal issuance rather than cyclical Fed policy is the driver this time) but the level itself sits in weight-of-history territory. If yields stabilize here, the equity extension has room. If they push higher toward 5.5% and beyond, something in the plumbing eventually breaks. That is the risk this move carries. We do not feel higher rates is the base case and rather the U.S. Treasury has their work cut out for them.