
PCE Higher, Risk is Being Hidden and FOMC Losses Hit $240 Billion
Subscriber Data for Aug28 2025

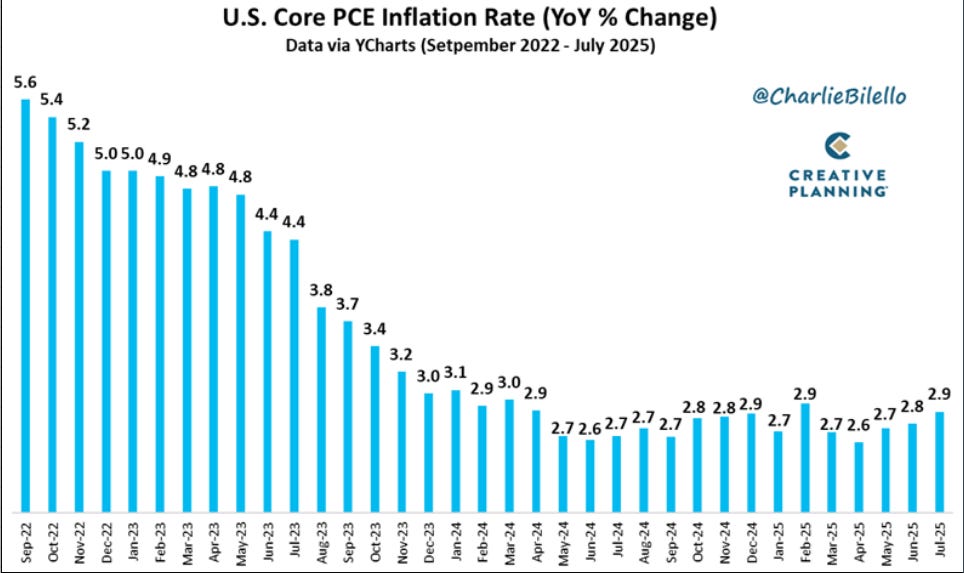
Good morning guys and happy Friday, today we saw the PCE data and an uptick to 2.9%. Here is the PCE chart that Charlie Billelo on X posted and he added these comments:
The Fed's preferred measure of inflation has moved up to 2.9%, the highest since February. Is that going to stop them from cutting interest rates next month? The market is saying no, with the probability of a cut still at 87%. The Fed has lost all credibility when it comes to fighting inflation. They should be hiking rates, not cutting.
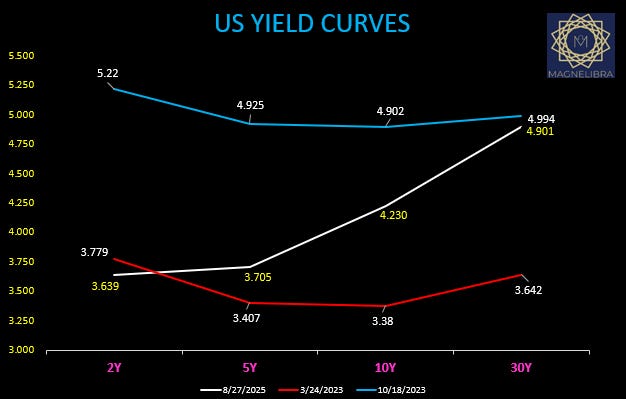
What Charlie doesn’t see is the whole picture, when it comes to the U.S. bond markets and where they are today. I disagree with his view on why the FOMC should not cut rates and one look at the U.S. yield curve compared to Q1 2023 till now paints a very different picture.
In Q12023 PCE was 4.8% and the bond market had the 2Y just a few bp higher than today. So its fair to say that the U.S. yield curve and bond players are on the FOMCs side when it comes to expecting rates and inflation to fall. MTR readers have seen this chart before but its obvious now that the bond players will be proven right and its dictated by the shape of the yield curve today as opposed to the super flat shape back in Q12023:
We also want to touch upon watching today’s close in the equity markets as we head in to Labor Day weekend. We talked about it yesterday and watching the QQQ ETF close today. Currently as of this note, the QQQ is -6.71 to $570, which on the week is down -1.35. This would be back to back lower weeks off of that 581 resistance level, but more importantly a close below 568 would put us back into the massive triangle wedge:
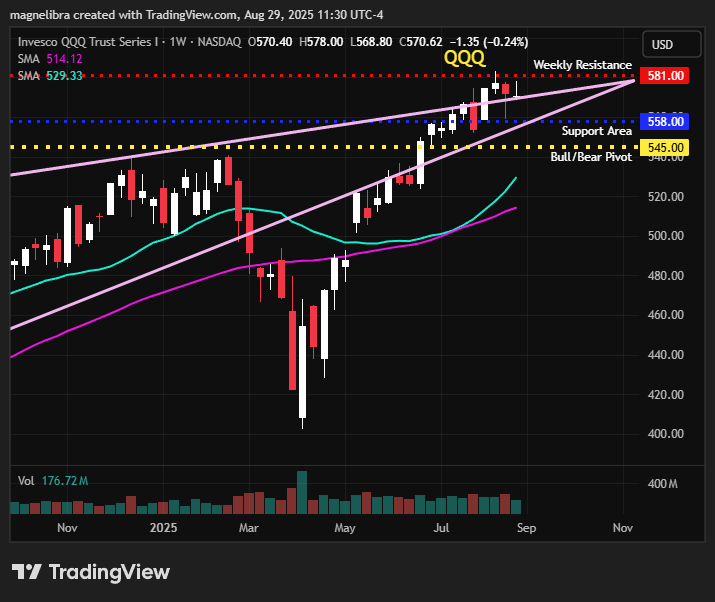
So this is the key to the risk markets and we are seeing a risk off move in early trading today.
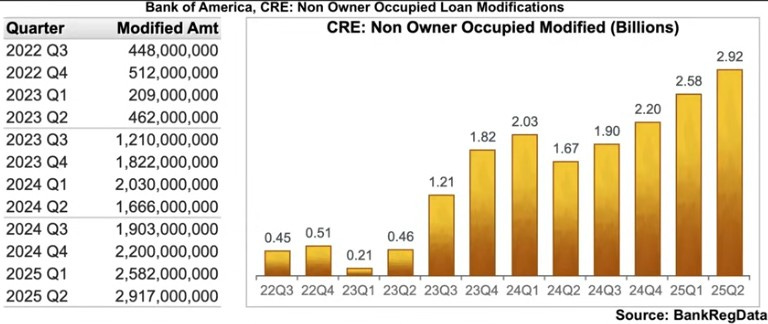
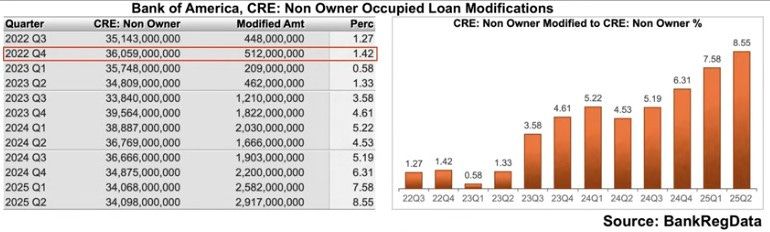
A couple of other items we want to discuss is the fact that we continue to see many on Social Media claiming that inflation will persist, that the economy is doing great, however we also know how and why that is. We know that the rules of finance have been realigned to hide risk, to mask delinquencies. We know this because the regulators have allowed the banking institutions to modify indefinitely to kick the can down the road, we also know that student loans have also been through the same financial engineering. We also know that there have been massive CRE write-downs and eventually this destruction of leverage will make its way down the line.
Here a couple of charts from the BankRegData and a link below will be included and should be a must watch Podcast from the Monetary Matters Network for MTR readers this weekend! In this chart they shared, you can see the massive increase in loan modifications (Mods), this is Bank of America data:
Here is it as a percentage of their book:
But Magnelibra, this is just one bank, JPM seems to be doing great and their clients continue to take on risk and buy assets. Well of course they are because JPM is loaning cash to their clients on an asset backed basis, but hey assets always rise, so there’s no risk right? When you wonder what leverage looks like…well here it is:
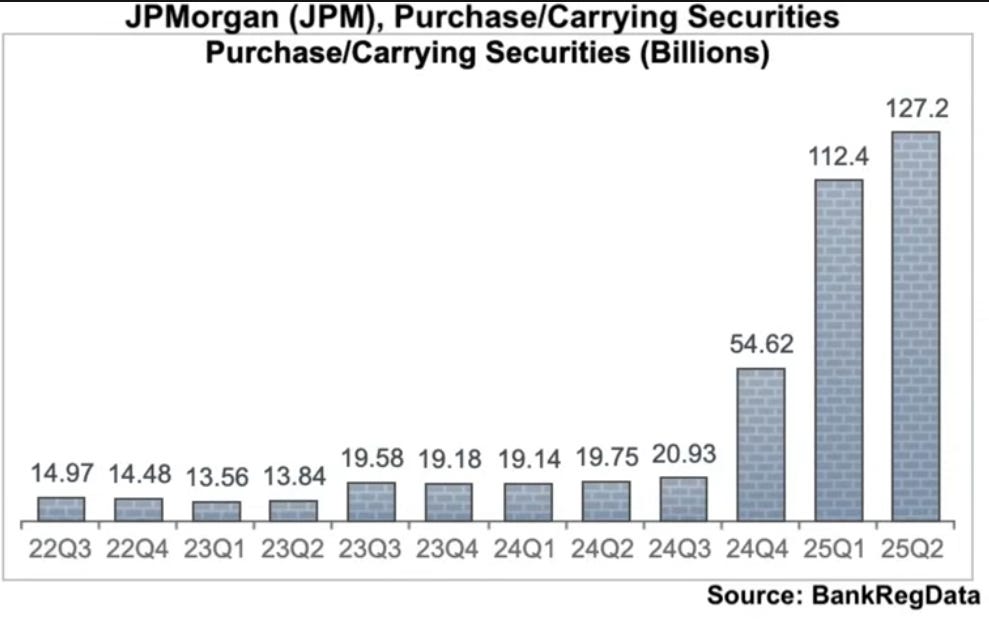
So when you wonder how risk assets can continue to rise, well you can see what type of financial engineering these banks are doing in order to, one, mask the real destruction in the underlying economy and two, loaning out massive amounts of encumbered capital.
We highly recommend you guys watch this Monetary Matters Network pod with Bill Moreland and you can view all his charts and commentary its an eye opener! Here is a link to the podcast on YouTube, Banks Are Hiding Credit Losses (Here’s How) | Bill Moreland of BankRegData
So what happens if risk assets start to fall?
But Magnelibra, why would risk assets fall everything is great. Well here is our negative carry chart, maybe you can correlate the highlighted areas and compare them to each other and what happened every time after years of negative carry:
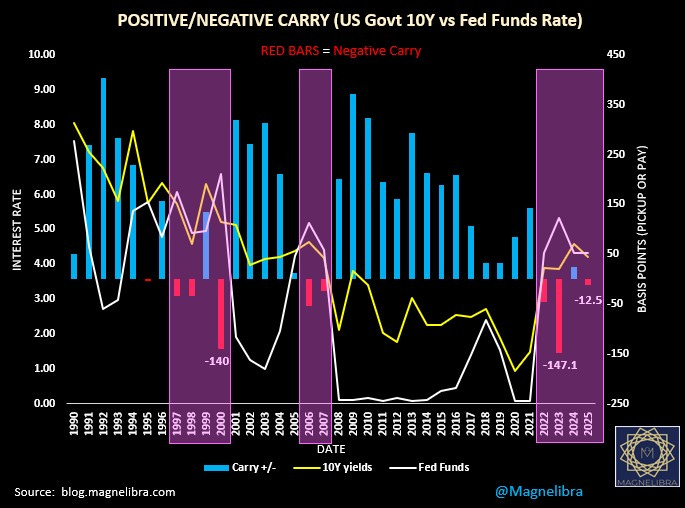
So if you look at 1997-2000, well you get the same look as we have today. When you ask why the investment community cheers that the FOMC is about to cut rates, we really don’t understand it, we view it a a very dangerous new risk cycle.
Speaking of the FOMC, yesterdays H4 report shows the Federal Reserve has finally hit the $240 billion deferred asset level (unrealized losses):
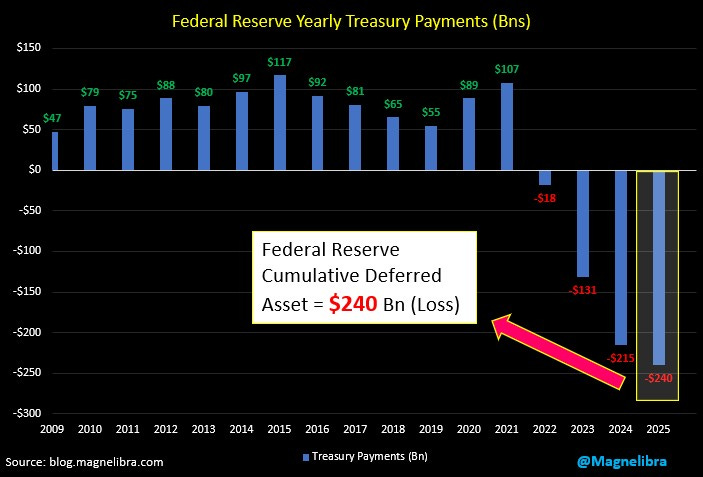
This does call into question the ability for the Federal Reserve to be bailing anyone out!
Ok we will now move onto our subscriber only section where we highlight all the daily data and trading trackers that we hope our investors use to compliment their own investment themes. We believe the way we structure our data, the way we present it to you, offers a unique advantage to follow along and learn how to trade and invest in a more global macro hedged format. We really put a lot of effort into trying to best convey the markets movements, the base case fundamentals that exist and then to extrapolate them into actionable processes. We believe that if you follow our work, start implementing some of the things that we present, you will not only improve your odds of winning but also gain an invaluable mindset to take through all facets of your life. So think about subscribing and becoming a supporting member, at the least share our work if you can!
The price is right and we hope you take advantage of our pricing tiers, we know you will gain exponentially more.
********************SUBSCRIBER ONLY SECTION**********************
