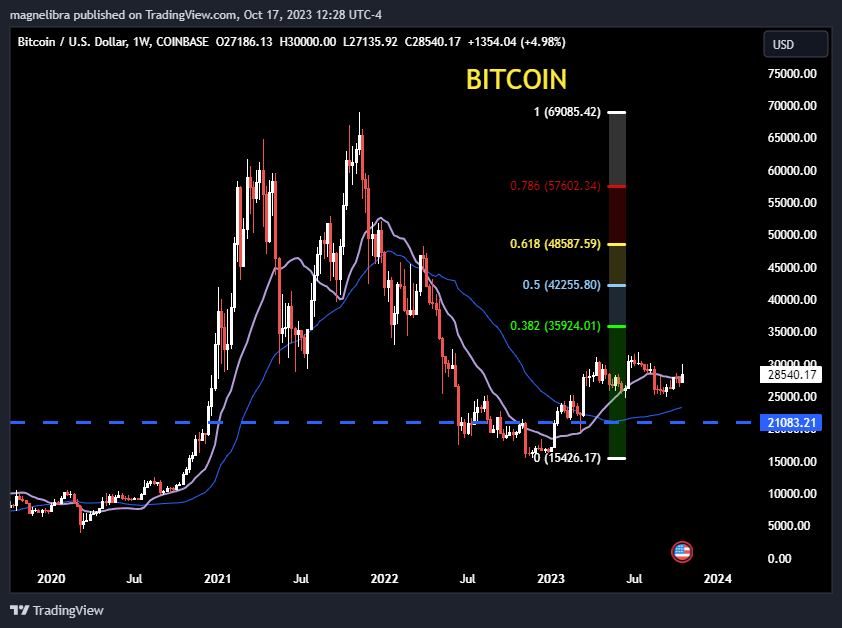
To our dismay and certainly not a surprise the equity markets showed strength yesterday. When we look at the QQQ ETF it seems that the buyside algos that control these markets have prioritized and parameterized a descending angular momentum buy area which we display below:
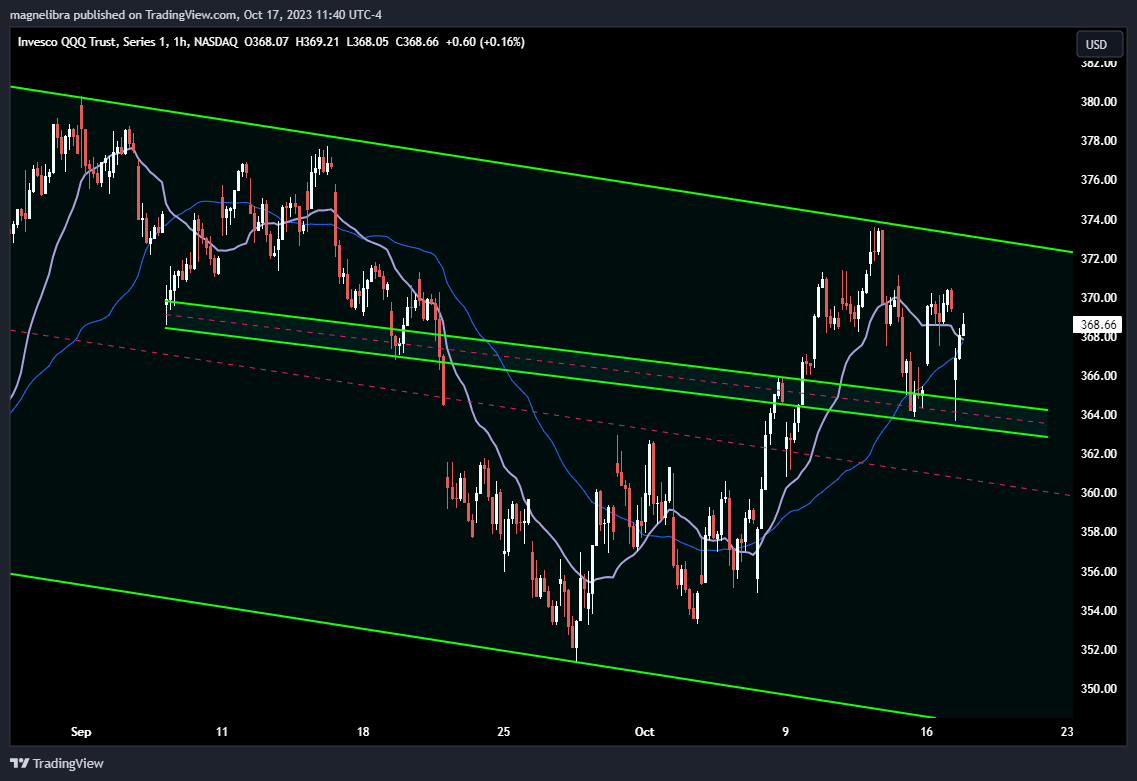
The gap down on Sept. 7th, then again on the 19th, which finally broke on the 20th led to a 15 point decline. Then the rally up stalled in this descending area on Oct. 6th and 7th but broke above this area on the 9th which stalled again at the important 373 resistance area. Now we back tested this area again on the 13th and 17th but we are now seeing the 21 and 50 moving averages converging.
For us this is still a bear market rally and all the oversold readings from late September have now been worked out. We would need the QQQs to settle a week above 373 to change our minds but they also have this descending wedge support at 363 basically so those reflect our base sentiment pivots.
We also continue to see a push higher in yields which has led to an obvious contraction in the spread between the US Govt 10Y yields and the Federal Funds rate. We often refer to this as the 10Y/FF yield curve spread. We apologize to some of our readers who have asked for further explanations on our acronyms so we will try to do a better job of clarifying. When we look at for instance yield spreads, we are comparing the yields of different durations of products. Federal Funds rate is the most widely known rate and its actually not an investor rate, rather its a bank to bank rate for borrowing from excess reserves from one another. However we like the spread because it give us an idea of how inverted the US yield curve actually is. By inverted we mean a negative sloping yield curve. Look at the chart below the red line (Jul10 2000) from the two year on out is an inverted yield curve where shorter term notes yield more than longer term ones. Compare that to the green (Feb15 2011) line which is positively sloped:
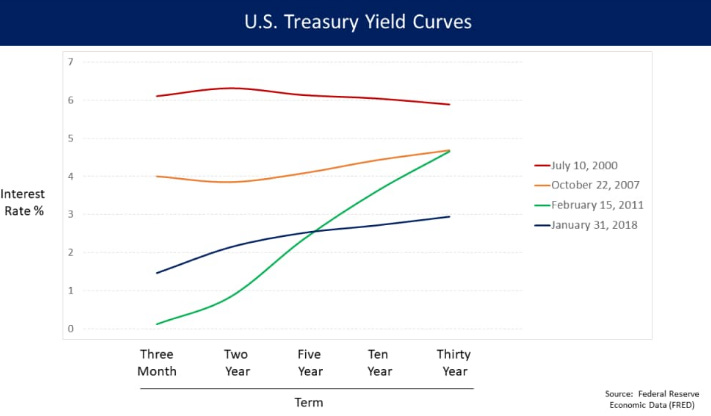
These yield curves give investors a good idea of the cost of funding or credit in the market place. You may hear us talk about “Negative Carry” which is what inverted yield curves are and that is why we talk about the 10Y/FF inversion because it shows us just how inverted or how much negative carry exists in the credit spreads. To explain negative carry we need only to look at the yields, so for the Federal Funds rate we use the top of the band which is 5.50% and for the 10Y it is currently trading 4.81% so the spread is 4.81% - 5.50% for a negative or inversion of -69 basis points. The chart below uses the median of the Federal Funds at 5.34% so the difference is then negative 53 basis points:
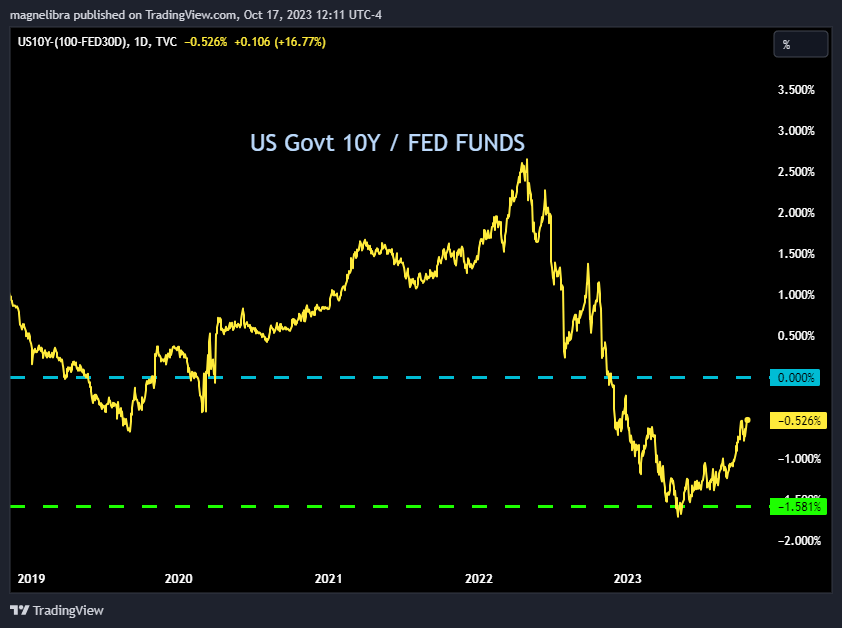
Why is this important? Well to put very simply imagine you are a leveraged large investor and your most important and most critical input to your profit is your cost of carry or more commonly referred to as WACC. Weighted Average Cost of Capital. So when you have the very short rate or overnight funding rates averaging 5.35% and rising and you have an investment rate say a US Govt 10Y only providing 4.50% as a coupon, you can see how your interest rate on the capital is drastically lower than your investment rate of return on you 10Y coupon. In the fixed income arena this is a killer to leveraged players and all the rehypothecated games they play.
Rehypothecated basically means “multiple claims” which is done in the tri party repo market where many participants claim ownership of a single US Treasury in order to earn extra interest, when in reality, we all know there is only one owner, but this repo system sees fails to deliver and it knows that this rehypothecation exists.
This is also why you see a lot of flight to quality in times of stress, well you used to at least in the US bond market, that is until our Government decided that money will be inflated and are now basically racking up $1T in new debt per year, hell their interest on their debt is $1 Trillion a year! So the US bond safety mechanism is no longer there and evidence further is the massive concentration into the MEGA8s that we often highlight where most of those corps can borrow at 100 basis points less than the US govt, so flight to safety is in real cash producing assets now, not US bonds.
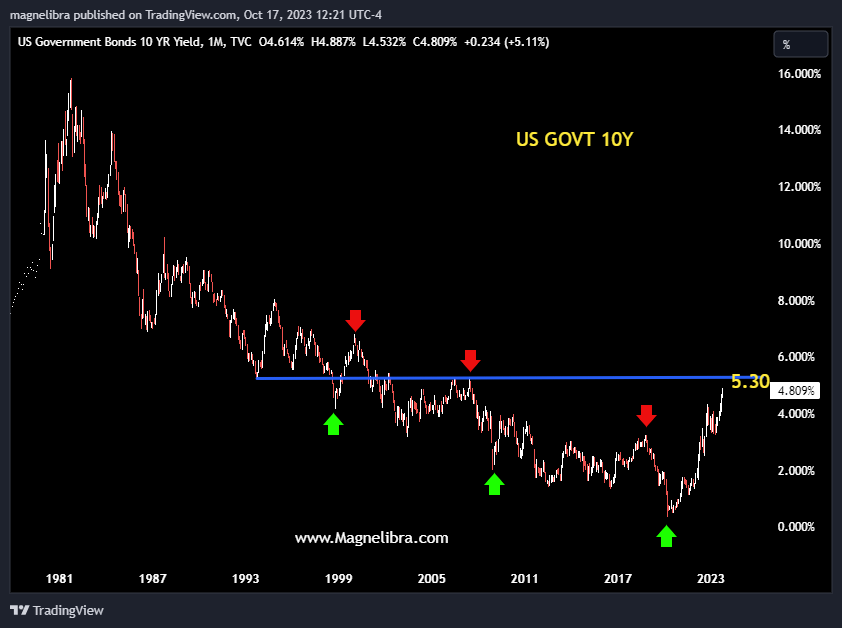
Back to the US Bonds and in particular the US govt 10Y we can see the ceiling is very clear, it sits at 5.30%. Will we trade up there? It does seem possible but we aren’t really sure the catalyst for that at this point. The FRB would have to raise the Fed Funds at least one more time and not hint at a pause, it is possible, so will see. For now though the trend in yields is still higher, but we know many are talking about the huge volume in the TLT ETF last week and yea that is a sign of capitulation, but it will depend on the FRB rhetoric. Here is the 10Y chart:
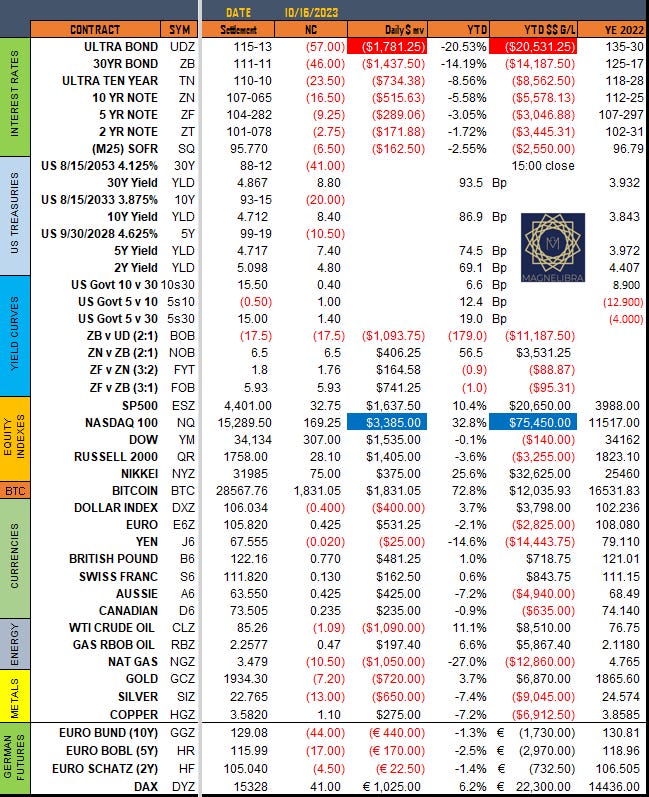
Ok so onto the trackers and settlements for yesterday where you can see bonds continue to lose ground, the Nasdaq was the big winner and metals gave some gains back:
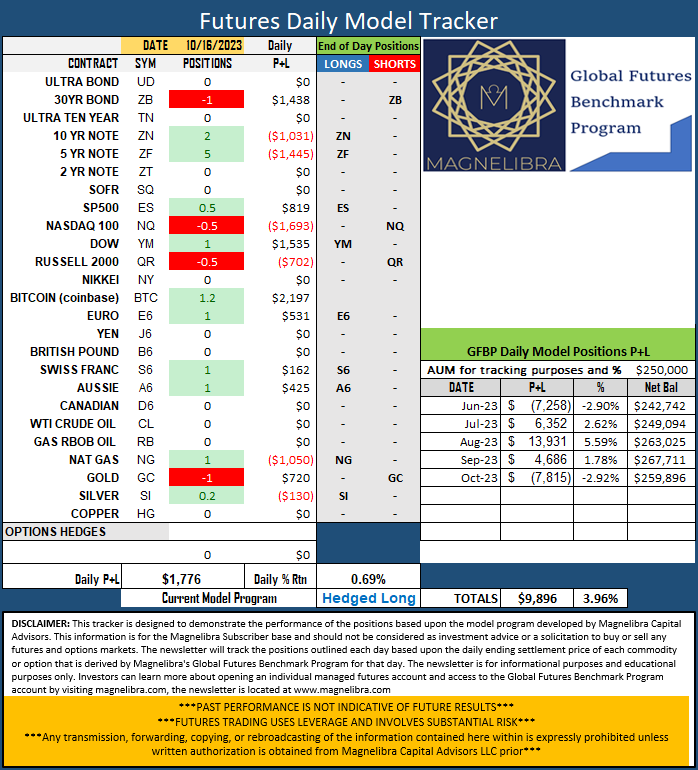
When we look at the Futures Positions Sentiment, no changes:
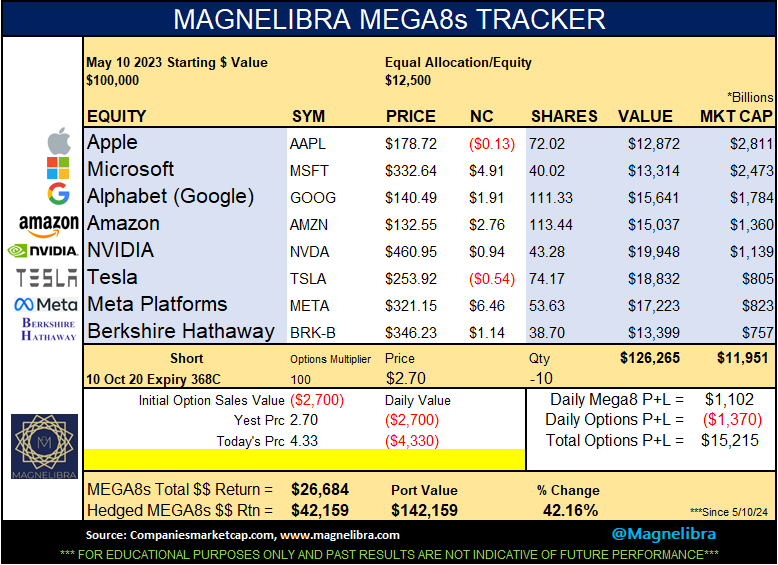
Finally the MEGA8s still hovering near the $12T Market Cap and led by Meta and Microsoft:
Alright that is it for today, we are making this a free one so just share if you can and spread our work so that others can gain from our collective knowledge. With as fast as our world is changing we all need a better grasp of our reality and how all this stuff effects our everyday lives.
Bonus Chart! We wanted to show this chart here and we know the halving and the ETF approval will be coming over the next year. We want to set our parameters here and on the downside it is $21k and upside we see $35k those are the levels of go with or not. Right now we are in active accumulation mode by many investors in anticipation of the ETF approval and the upcoming halving, meaning we don’t see many organic sellers, so you know where our sentiment overall is: