

Modern monetary mechanics are difficult to decipher because of two key factors:
The sheer complexity of the relationships between, the Federal Reserve, the US Treasury, the GSEs, the Commercial Banks and other global central banks
The massive amount of both the supply of global fiat currencies and the complex Eurodollar system which is the true plumbing of the global economy
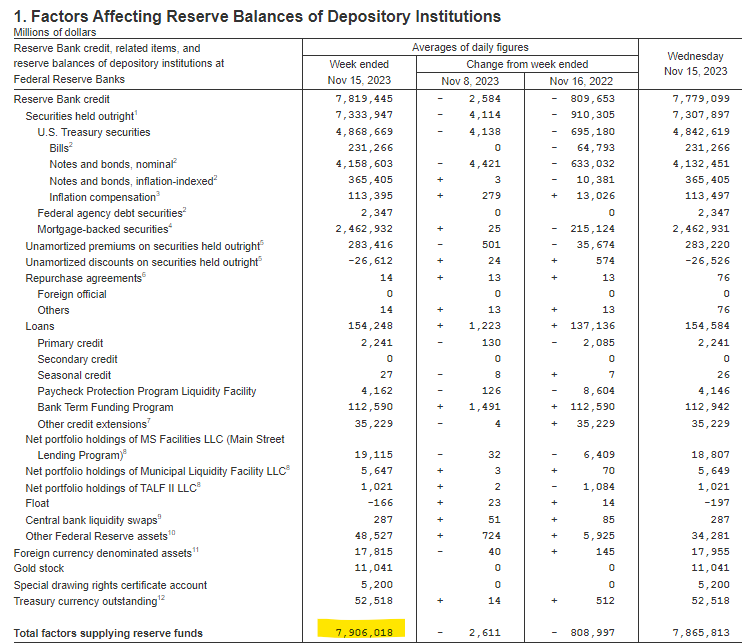
The trillions upon trillions of dollars that are at work each and everyday, leads to a staggering amount of risk and leverage throughout the global economies. So if we take to broad a stroke, well the details will surely be over looked. So one thing Magnelibra likes to focus upon is the Federal Reserve asset base, which comes out each Thursday afternoon at 4:30pm Est. This report is more formerly known as, “Factors Affecting Reserve Balances - H.4.1.”
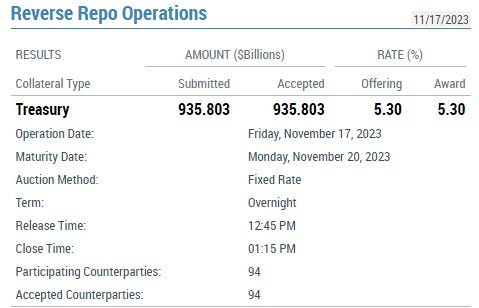
The other item we watch is the NY Federal Reserve dashboard which updates the Repo System figures for that day, and that comes out at 1:15pm Est. every day.

So when we look at both of these, the two key figures we are looking at are the Federal Reserves Assets or more particularly the “Total factors supplying reserve funds”
When we review the NY Fed Dashboard we look at the days Reverse Repo Figures:
So when we look at this year, 2023 from the perspective of both Quantitative Tightening and Reverse Repo we can quasi paint a picture of excess liquidity for the global investment market place. From our perspective, and many others for that matter, often more simply look at just Excess Reserves. This can also found on the H4 Report. We like to take the Currency in Circulation + Foreign & Other Official Deposits and back out the TGA. So for this week if we do the math:
Currency + F&O Deposits - TGA or $2.326T + $1.331T - $738.6Bn = $2.918 Trillion in Excess Reserves.
For us this is truly the base system capital and for an economy that has $33.7T in debt means we are running a levered book of 11.5x and its obvious our debt is a negative contributing factor now. (A bit less if we back out about $8Tn in intragovernmental cross factors) So let’s stay on point, we know the base excess reserve amount. What we are trying to quantify is exactly how much quantitative easing is going on as we often here the FRB is in QT mode and this central bank reduction in assets should cause markets to fall.
If we took it for face value, yes, in 2023 the FRB assets have continuously and systematically been reduced, yet risk markets are much higher as the Nasdaq is +30% plus, how can this be? Well we have an answer and we will display our proof in the next chart:
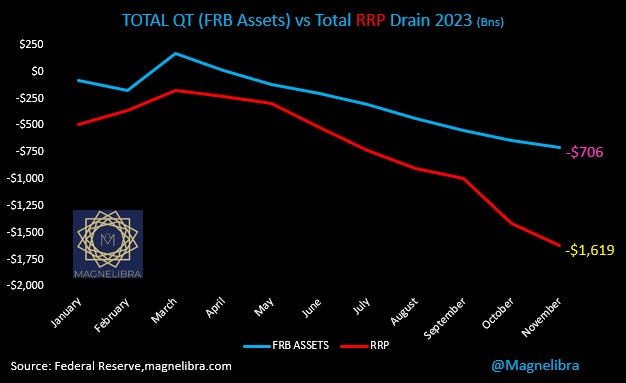
Yes it is true that the Federal Reserve has reduced its assets by $706 Billion dollars. However, what is also true is that the Reverse Repurchase Agreement Program has seen a drain of $1.62 Trillion dollars.
This is an offset of nearly 2.3x, meaning for every dollar of QT, $2.3 dollars of RRp is taken out of the FRB program and being invested elsewhere. If the capital is not locked up in overnight RRP at the FRB, well it must find some other attractive investment opportunity elsewhere.
Could this extra $913Bn be the reason why QT and higher rates for that matter are not reducing asset prices like many base economists think?
Well we think so and only when the RRp moves to zero and we still are in QT mode, that we will actually see a real market response.
As it stands today the RRp is $935 Billion and the FRB assets are $7.9 Trillion, is $7 Trillion the farthest the FRB can go in regards to QT before we start to see some real fireworks?
Can risk markets continue to rally until we get to this point?
Considering we have nearly $3T in excess reserves and $935 still waiting in RRp, chances are many are wrong sided here and asset inflation, at least for a few equities (MEGA8s) seem to be heavily supported. However the longer the FRB keeps rates elevated, the more time passes and markets have to readjust to this higher theme. The latest expected yield curve predicted path, seems awfully generous on the forward rate cut expectation…we are not in that camp and believe rates will remain 5% plus in Fed Funds land longer than many think.
Here is the expected path per Charlie Billelo on X:
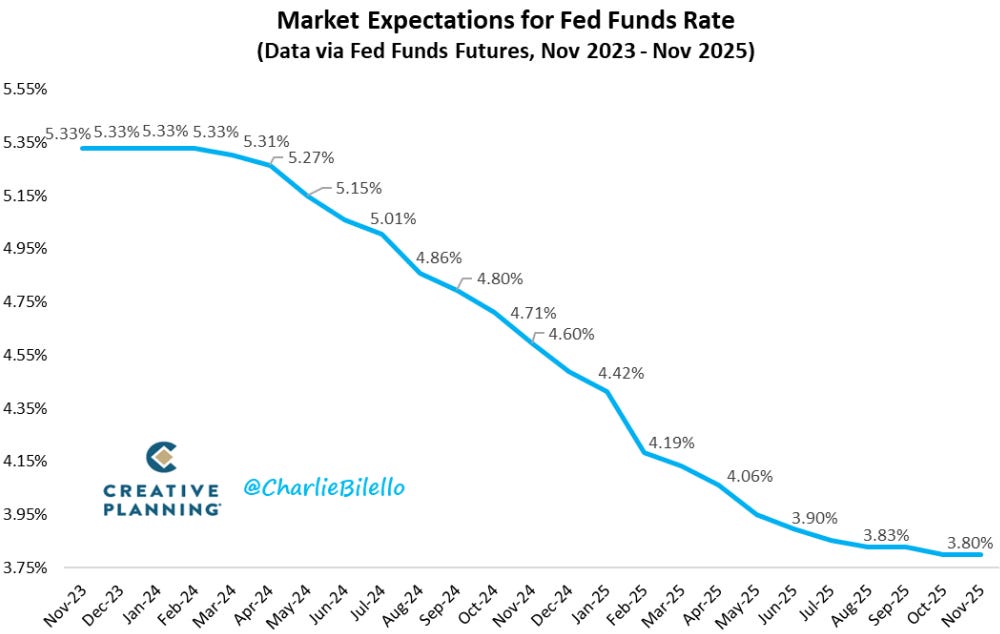
Remember, higher rates = greater risk free interest income! Can you imagine pre Covid getting a 5.5% US Tbill, when rates were ZERO back then, investors would have killed for it. Now we are here and already everyone says we are going back down…not so quick!
This is a free post and we hope you all enjoy it. Please feel free to share our content on your social media platforms, please think about supporting our work here as we bring our subscribers, content like this but so much more. Our subscribers enjoy our daily data for the futures and cash markets we follow. They enjoy analysis that can only come from decades of derivative experience. Our goal is to force you to think outside the box, to view markets from various angles and always to improve your mindset. You deserve to understand how and why our monetary system works, how our markets work and we will do our best in fulfilling that promise.