

As we pointed out a little over a week ago, the markets where exhibiting some exhaustive selling signals and we have been rallying ever since. Now we know oil is still high, we know inflation is there and we know the FED will still raise rates. However we must keep things in perspective and what we like to do here at Econemotions is have our followers focus upon time.
The FED which we refer to the Federal Reserve as, is remarkably successful in buying time. Sure the names at the FED rarely change, much like government, it always seems to be the same bloke’s running the show [which is also why we are never right/left/liberal/conservative, but constitutionalists at heart]. What we mean by time is that the FED tries to mask all its problems that it creates from over printing debt, by smoothing out time and drawing out the negative effects of inflation/deflation asset bubbling, etc. '
However when things get a little out of their control, we see pricing mechanisms discount asset prices and discount them down to the point where we like to refer to nominal pricing as trading back to levels vs a given point in time in the past. For instance, when we look at this Euro Currency chart, we see that the Euro fell all the way back to 2016 levels:
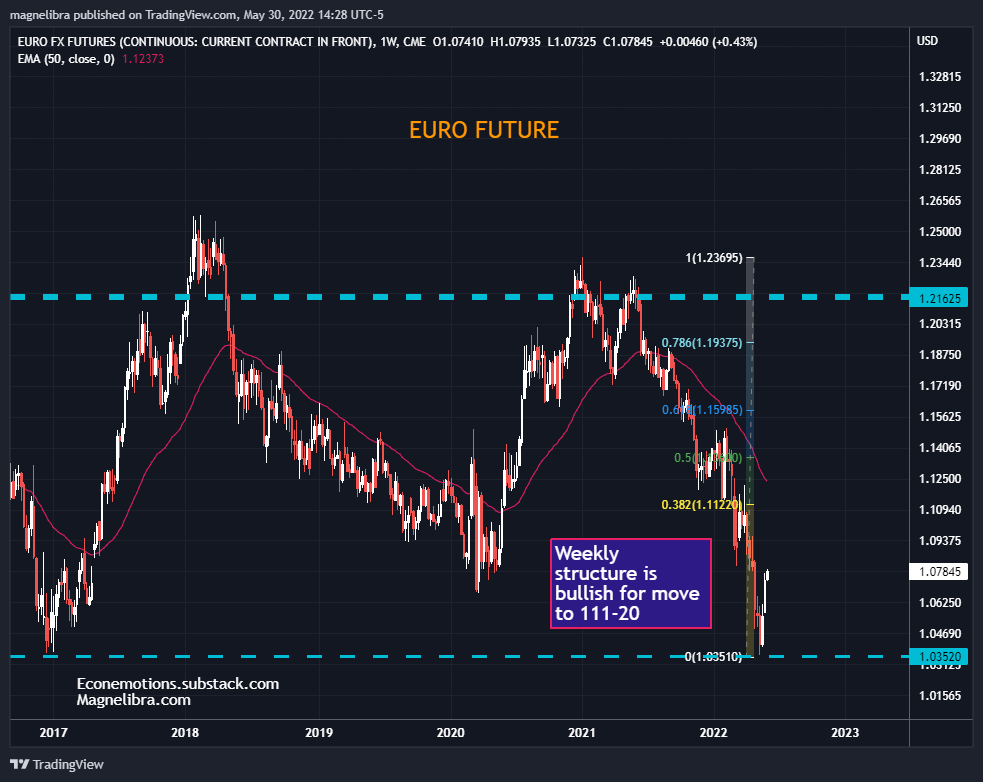
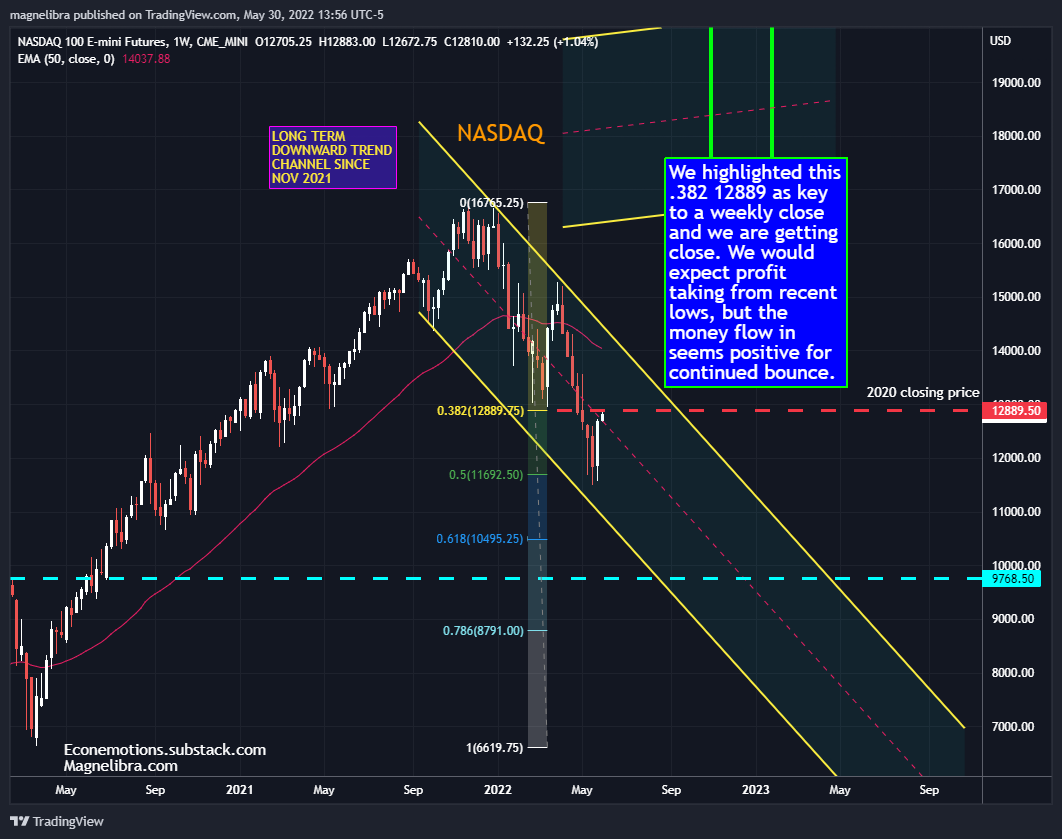
Not a bad discount 6 years in pricing mechanism, discounted and well we weren’t the only ones to notice, as you can see its rallied over $4 since then. Equally we saw the Nasdaq battered down to an area not seen since Q3 2021 and an area that was a 30% discount from recent euphoric highs. The chart below shows the Nasdaq bouncing from that level and now testing the all important 12889 area which is also the same level the market closed out 2020 at. This area is the key to bulls taking this initial run to the next stage:
Ok so those are just a few examples of how we price markets in a unit of measurement based upon a prior time. We know the FED will slow walk this QT path and we have been vocal about our call for them to cease raising rates once they get to 1.75%. We continue to make that call. We also know the equity markets are resilient and may even rally till the FED does indeed stop raising rates, for once they stop, well that will mean the markets are readjusting to some new data and that very thing that ends up forcing the FED to stop hiking will be the very same thing that puts a cap in the equity markets run up as well.
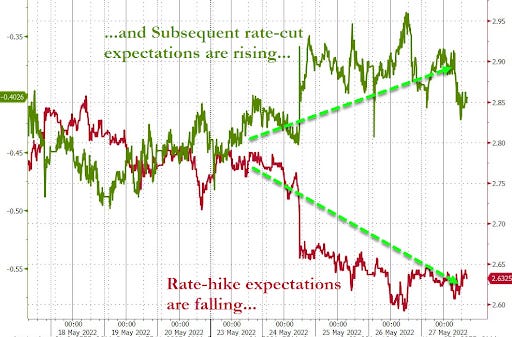
We can already see the future rate hikes being taken away via this chart from Zhedge:
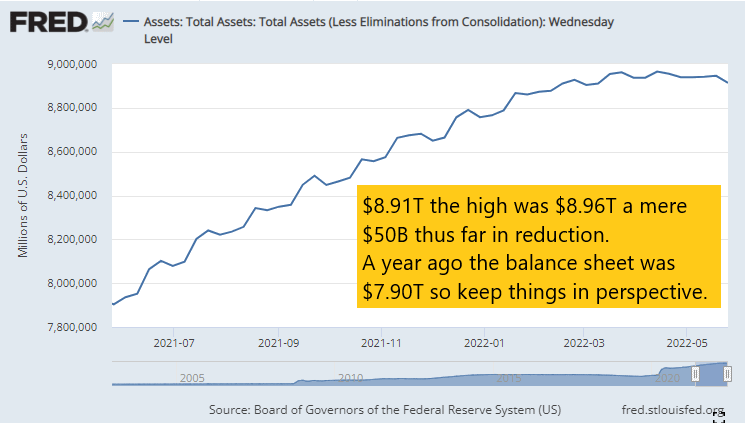
Let’s also be honest and note that the so called QT or Quantitative Tightening is nothing more than baby steps to take us back slightly from all time highs, this next chart should make it obvious, and no the market does not care about $50 or even $500bln in reduction from these levels:
We leave all that hype for the media to keep you interested. We don’t want to just keep you interested, we want you informed as to the reality of our financial and economic system.
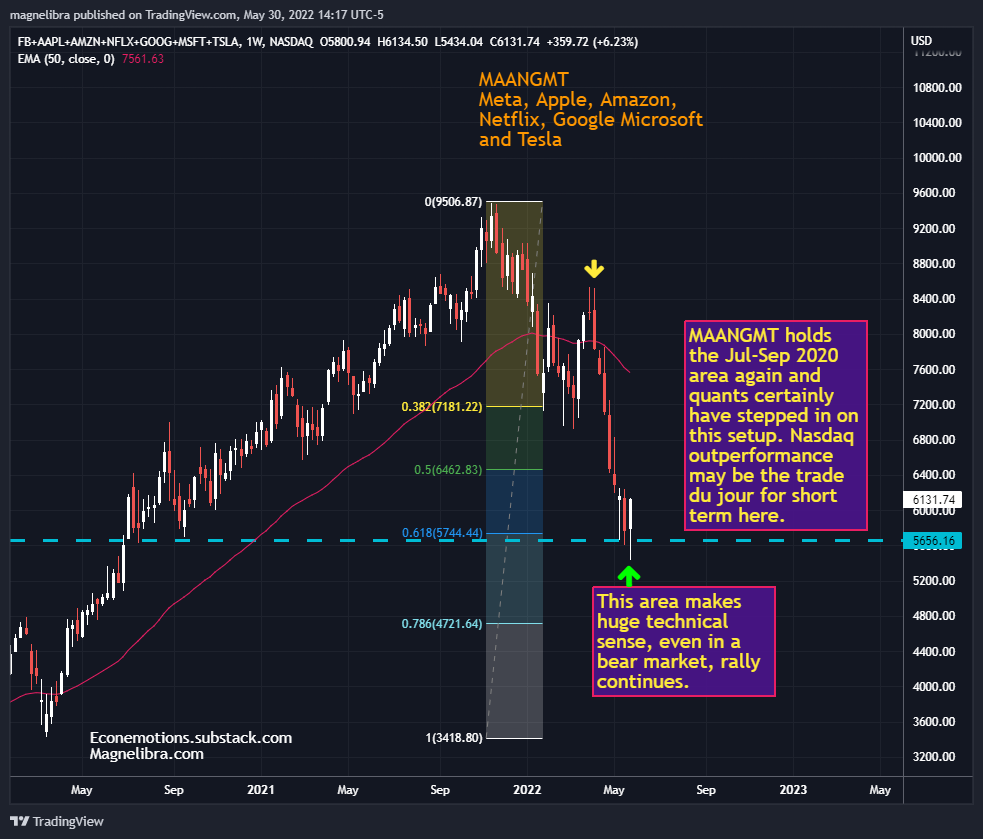
Alright so on to our charts, we already posted the Euro and NQ, so lets follow upon the NQ with our MAANGMT chart (our Nasdaq proxy) which shows a huge weekly bull candle at an area backed up by major technicals:
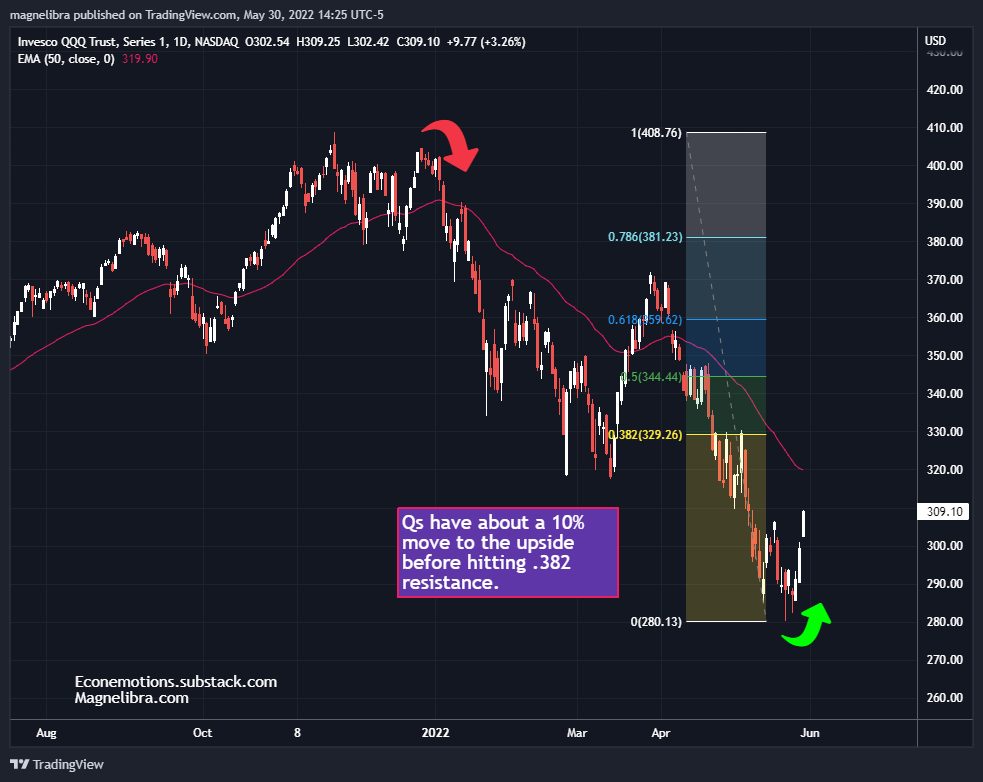
The QQQs fund also has room to run given the first real technical resistance areas are at the 100ema and .382 fib as shown below:
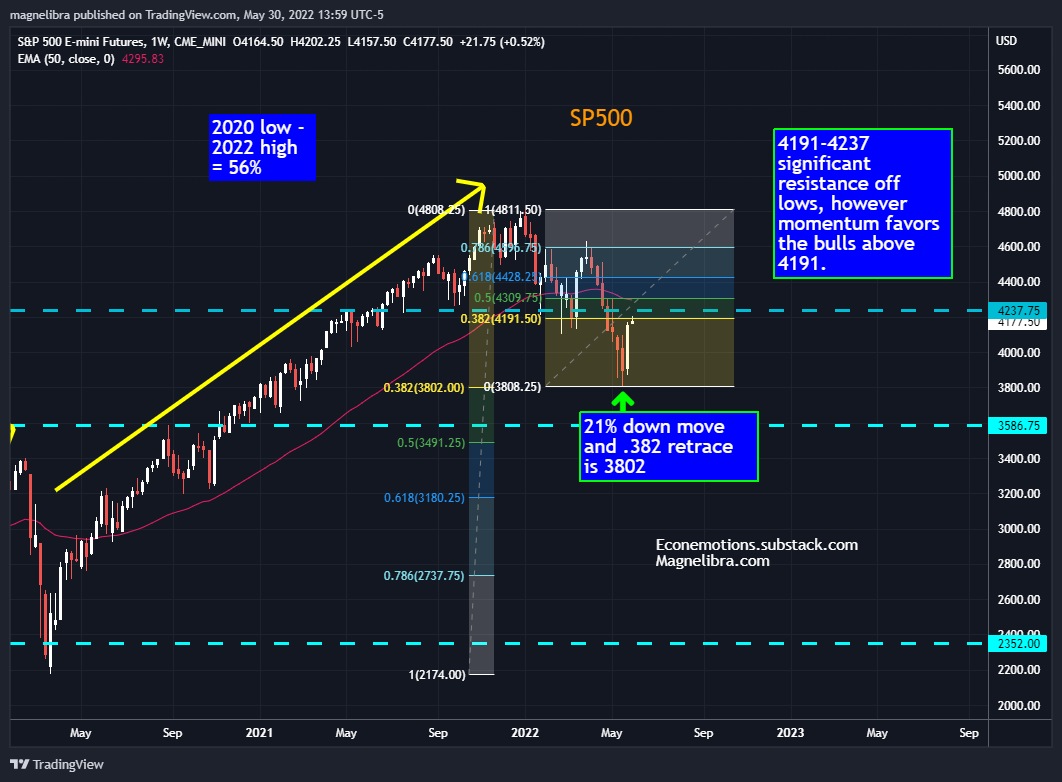
As far as the SP500 4191 is key now and it has performed as expected off of that all important 3800 area. We could see technical selling and profit taking from here from fast money accounts who got in on the lows but real money flows have come in and this market seems well supported for now:
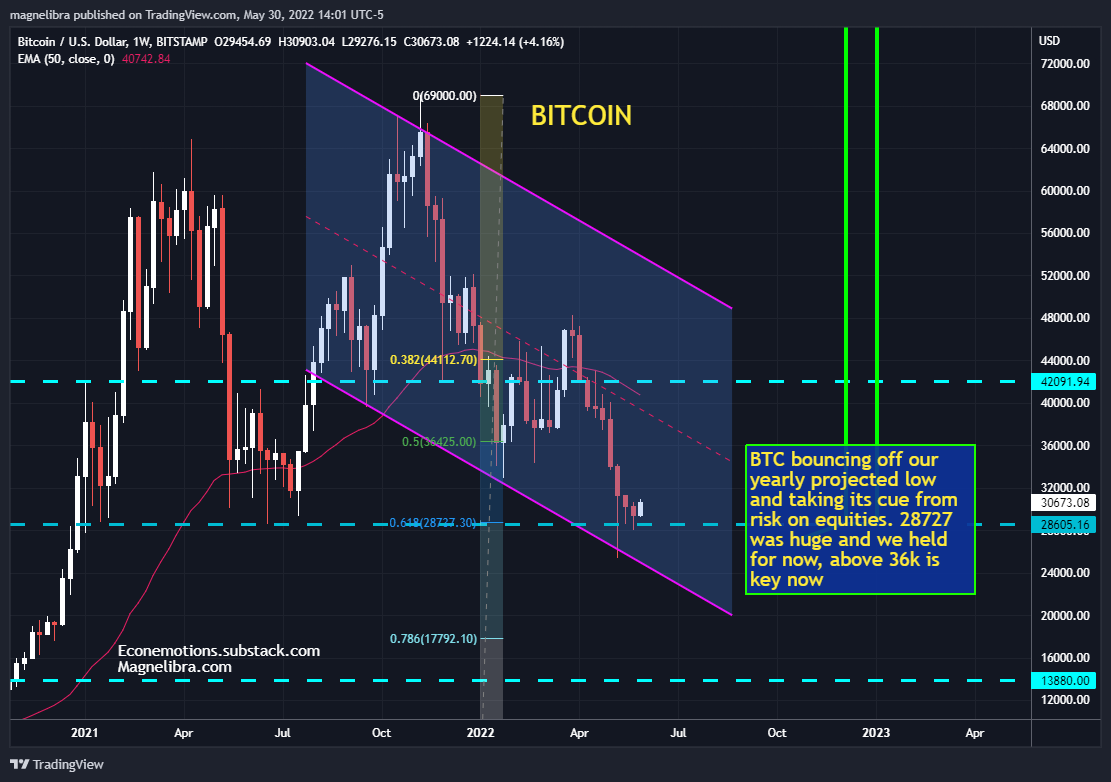
With all the risk on Bitcoin too is benefitting and is now back above $30k
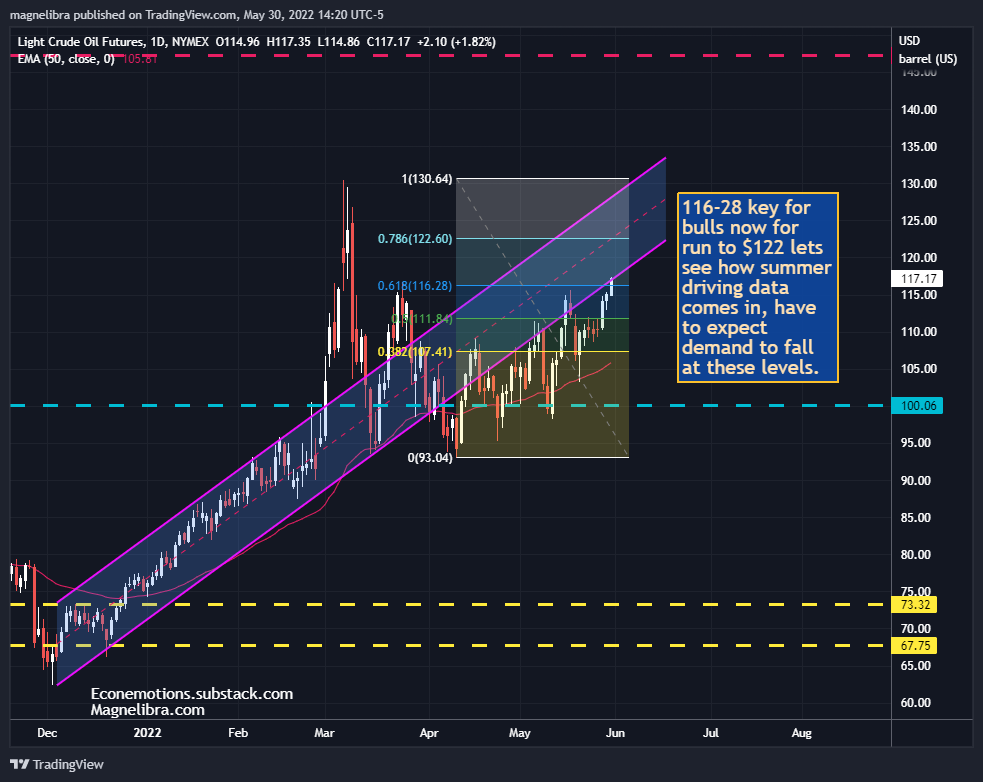
Crude Oil continues to climb after breaking back above that $100 area and is now coming into longer term resistance at 117-122 area. We would suspect a reversal to be had at that 122-00 area and if touched and then closed below would be a great signal to look at bearish positions:
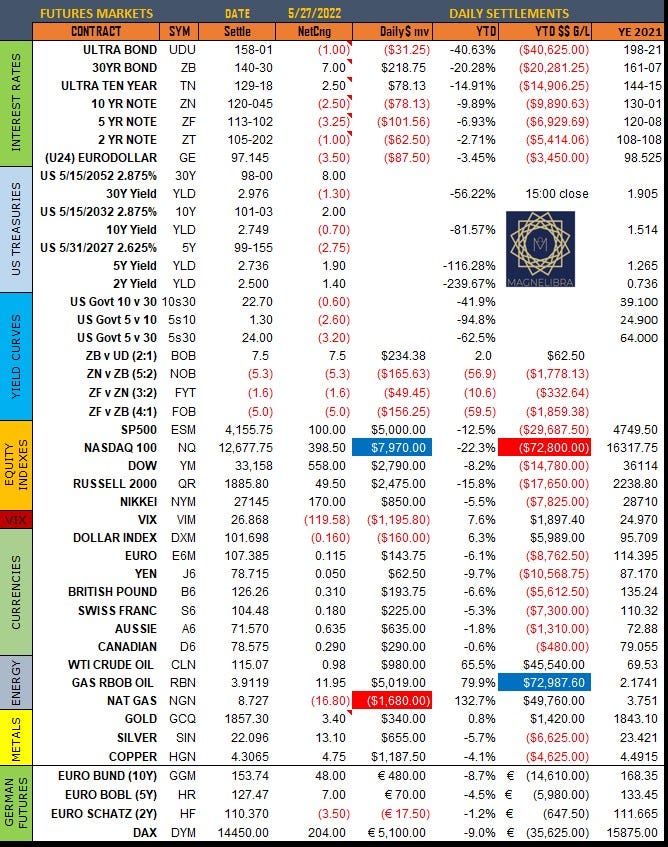
Ok on to the settlements for Friday May 27th we hope you have had an enjoyable and relaxing Memorial Day weekend and we hope you will continue navigating this journey with us Till next time…

DISCLAIMER: For educational purposes only. This is not a solicitation to buy or sell commodity futures or options. The risk of trading securities, futures and options can be substantial and is not for everyone. Such investments may not be appropriate for the recipient. The valuation of futures and options may fluctuate, and, as a result, clients may lose more than their original investment. Nothing contained in this message may be construed as an express or an implied promise, guarantee or implication by, of, or from the author Michael Agne owner of Magnelibra Capital Advisors. Magnelibra the CTA and its Global Futures Benchmark Program may hold long and or short positions in the various futures and markets that Econemotions covers. We will never claim that you will profit or that losses can or will be limited in any manner whatsoever. Past performance is not necessarily indicative of future results. Although care has been taken to assure the accuracy, completeness and reliability of the information contained herein, we make no warranty, express or implied, or assume any legal liability or responsibility for the accuracy, completeness, reliability or usefulness of any information, product, service or process disclosed.
ALL RIGHTS RESERVED 2022