
Regime Change Plan Accordingly
Russia, Rate Hikes and Technical Charts

We won’t even comment on the Super Bowl, game was boring, ads weren’t great and let’s be honest the social distance thing for the half time acts made what should of been a memorable performance, well barely excitable…anyway we titled this post “Regime Change!”
We aren’t talking about removing governments although the posturing in Ukraine is troublesome and as a side bar, Putin’ was very obvious and honest in his recent speech, which we will sum up here and in response to any conflict that may transpire if the West continues to encourage NATO involvement and installations around Russia and in consideration of that fact that the US has removed itself from the missile defense treaty:

We believe his words and humanity must be very aware of the risks not only to the global markets, but for general peace. We can sense the change, we can sense the anger and the instability is what’s driving the mass psychology and its why we feel that this time IS DIFFERENT! A link to VPs speech is here, Putin on Ukraine
Yes its a dangerous proposition to think markets can fall, but as the global central banks led by the FED have irresponsibly slow dripped free money for a decade with negative rates and we won’t even comment on China…the money printing is out of control and now the time of reckoning has come in the form of real INFLATION.
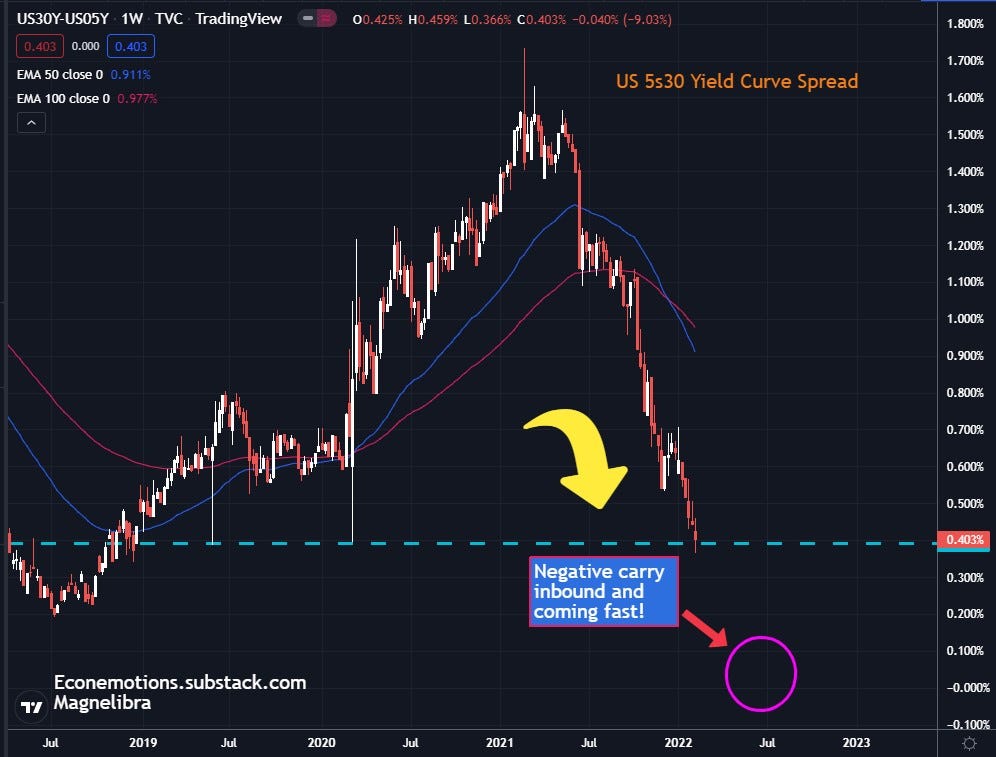
No the FED cannot control inflation, it controls the leverage mechanism know as positive carry by which they keep long rates well positioned above the short rate which they do control and positive carry results in risk free arbitrage for profit. Trust us we did it for a decade arbing US Treasuries vs futures, we are experts at it. However when the yield curve inverts and you have negative carry…as our last post talked about, then banks have to find real avenues of profit and revenue. All the balance sheet games that they can play jamming large positions down narrow fast money paths is no longer viable.
Now we have a Federal Reserve and markets with this insight as to the future of rates:
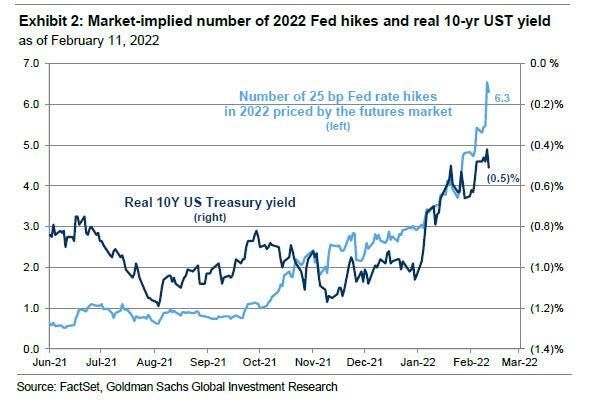
6 rate hikes with Econemotions predicting a juicy 50bp next month…its the only way to combat this levered over speculation. We believe they will continue that path until FED FUNDS reaches 2% by which the US Govt 10Yr will most likely be trading 1.85% and will have a negative Fed Funds/ 10 yr curve which will be the bottom of the cycle.
The hard part is, how hard and how fast? This next chart is an illustration of what the Feds trajectory of balance sheet reduction might look like as the FED is calling for a reduction down to $6.1 to $6.6T, yea no doubt they will do it, probably stopping at $6.66T why not, makes sense doesn’t it? Anyway here is our chart of the expected reduction path for Fed Assets not in time because we don’t know the time frame of the reduction but rather our blue line down represents where their expected path will end up:
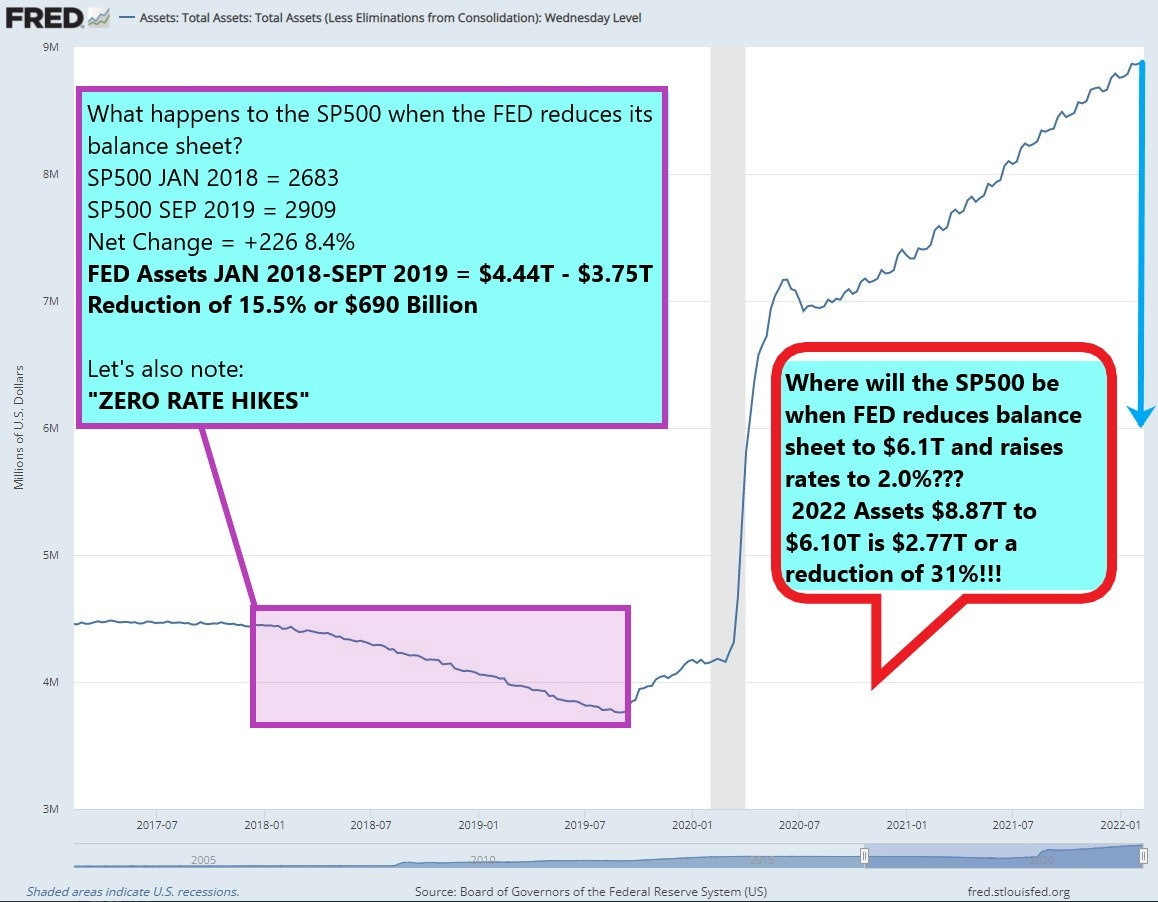
If the FED does somehow have the guts to destroy asset prices like that and reduce the balance sheet by 30% or some $2.7 Trillion then we applaud them. As far as our chart below we try to compare the Jan 2018 to Sept 2019 cycle of Fed Asset reduction. The SP500 did ok over that year and a half, it gained 8.4% actually, however this was a different beast, this was a balance sheet half the size and this was WITHOUT RATE HIKES! Big difference! The bond market was forcing the FEDs hand and trying to invert the curve at that time, but the Repo debacle in September was the last straw and the FED caved to the monetarists, for those that don’t recall here is the SOFR chart from then, now that’s a spike:
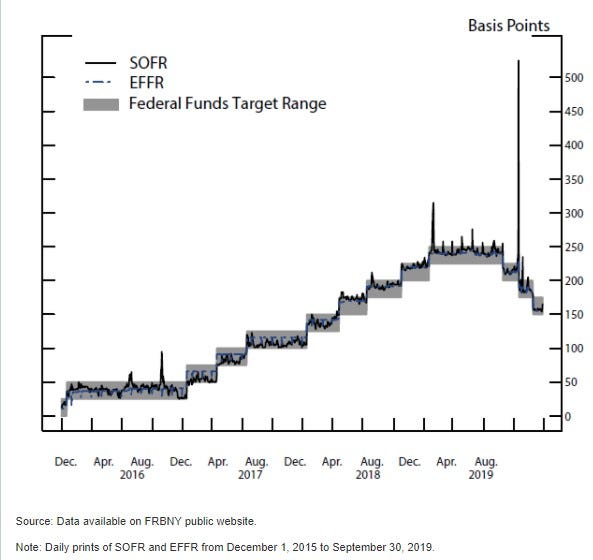
With the FED reducing their balance sheet, expect a major repo disaster like the one above, except this time the FED won’t be able to acquiesce, this time, someone will fail!
Now we have been hearing a lot about the epic inflows into equities especially last week. Well we have a different take on this, one, the nominal amounts vs percentages is a fairer comparison over time:
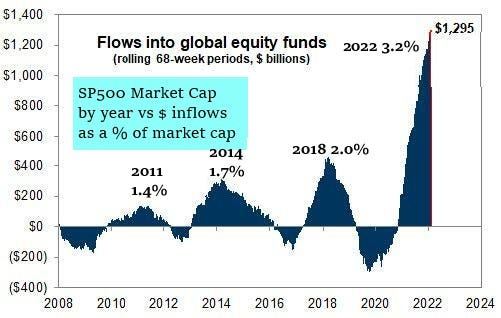
The comparison we are making is the Dollar amount of influx vs total SP500 market cap and although we see a massive $1.295T influx, its 3.2% of the market cap. Large nominally but we feel percentage wise our analysis puts it a bit more in context.
What troubles us more so though is the fact that the overall market especially the Nasdaq lost 3% last week or 485 points in the futures. For Econemotions this is more of the conditioned Pavlov dog that has been lulled to sleep by monetarist phenomenon. Yes we know the 1% never have to sell, however that doesn’t mean their nominal value cannot be destroyed and furthermore we know leverage is about to be carted out feet first. What will also be lost is time, we know Central Banks buy decades of it, yet this time, they levered themselves and their prowess, arrogance eventually gets the best of us.
So to sum up our regime change, the Central Banks have exhausted their games for now and have pulled so much future GDP forward that their debt over hang has made a mockery of organic economics. We keep hearing the FED can’t raise rates, well they will and they have too and its not going to be pretty, buckle up because the trains already left the station!
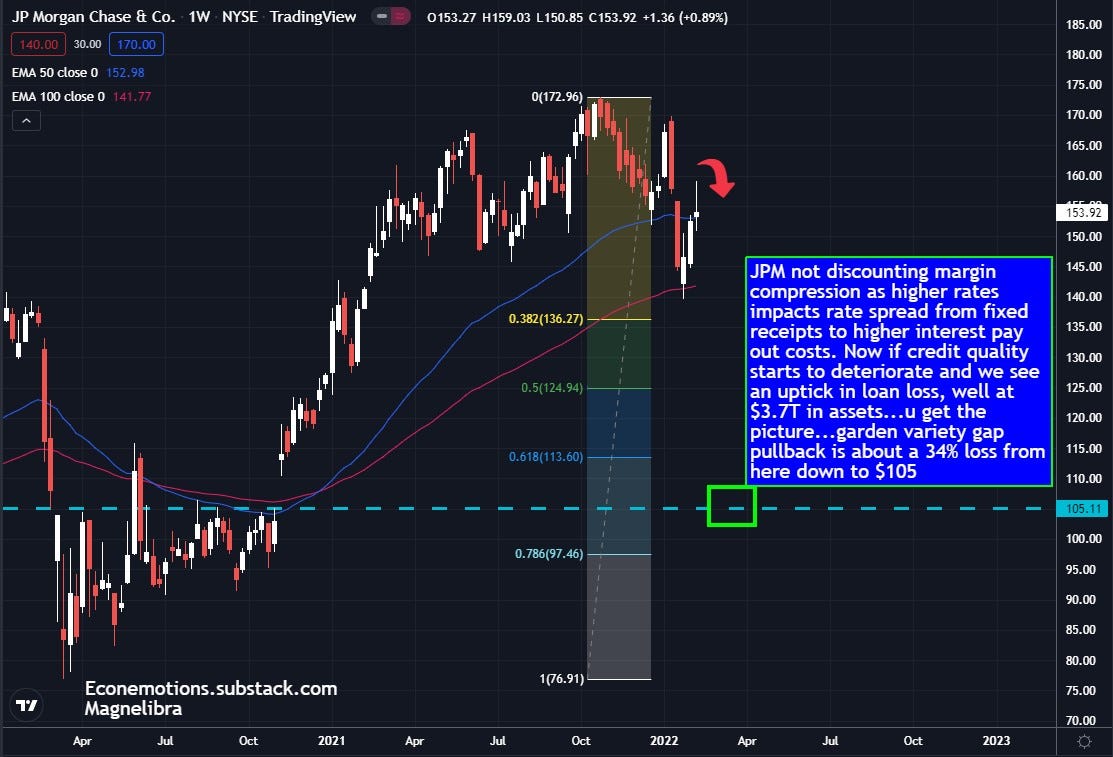
As for out technical charts and considering nobody is talking about margin compression at the banks, well let’s look at the big dog JPMorgan Chase shall we:
Where’s the compression coming from, well here is the US Govt 5s30:
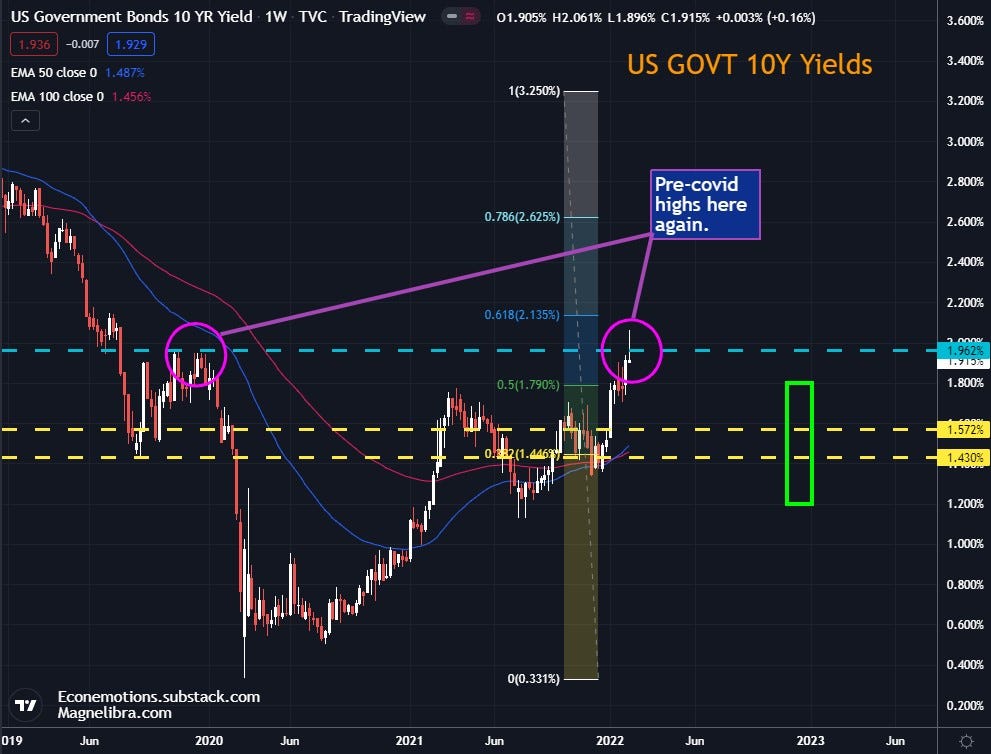
What is the US Govt 10 Year saying about all of this? Well we like the hammer last week and we suspect the bond market knows something and that is the inversion will lead to some massive margin calls around the globe and the tide will roll out and reveal those in due time:
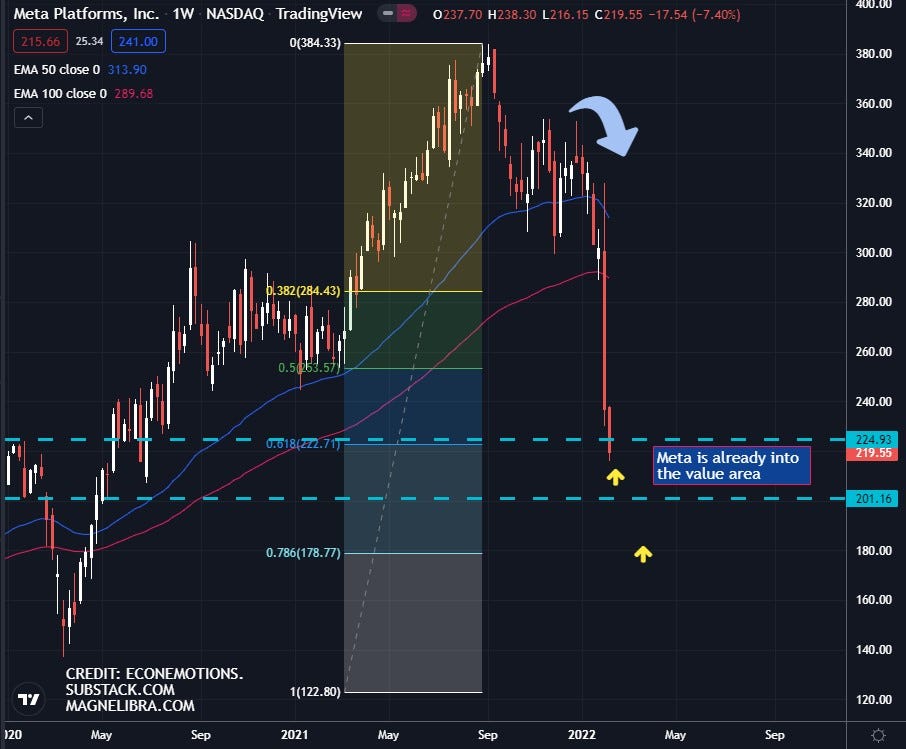
As far as the tech sector, we feel its toast, we really do, the arrogance and the top of it all for us was the introduction of META and yea their commercial sucked too and for the first time in its history Facebook is losing LOST steam:
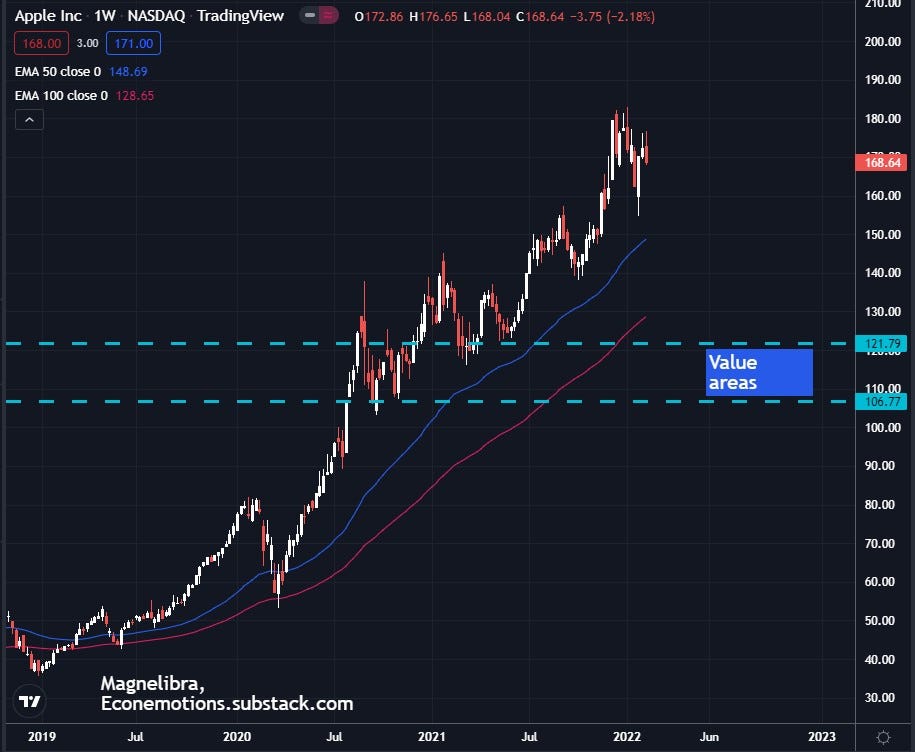
Apple and their cash hoard will not be immune either:
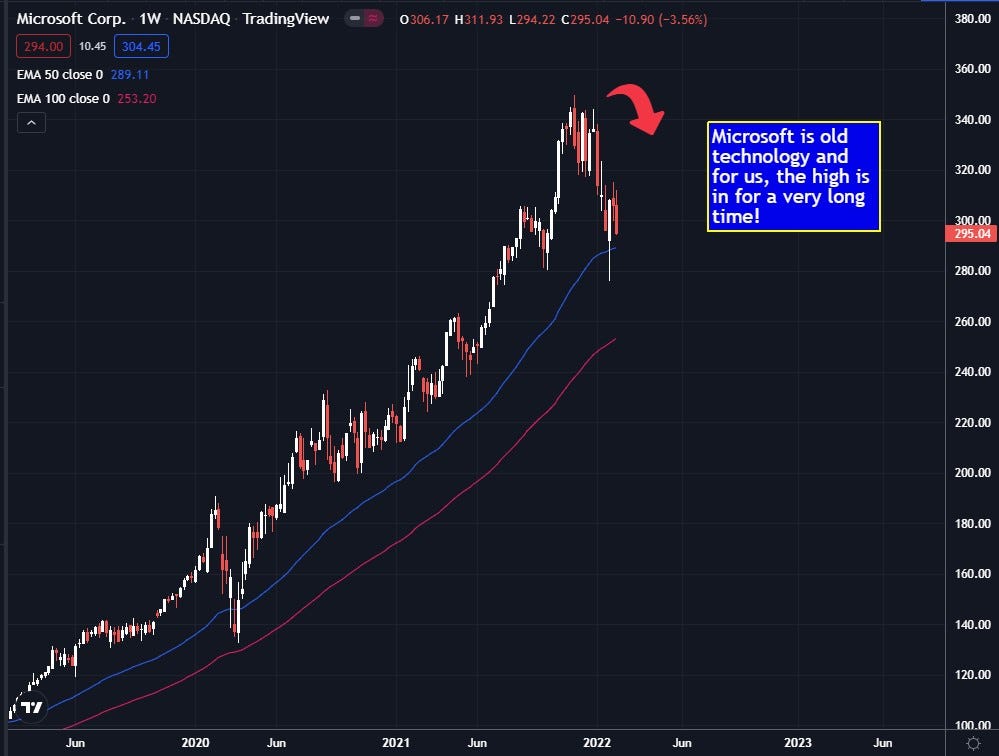
Microsoft, well their time has come and gone as well:
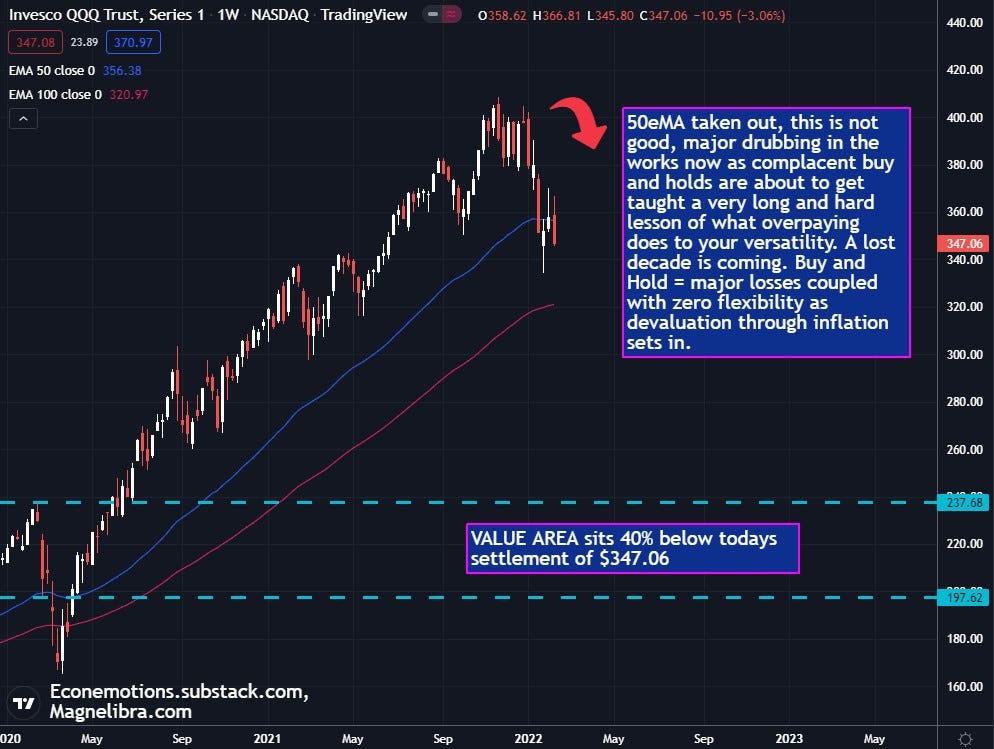
As for the QQQs this isn’t going to be pretty:
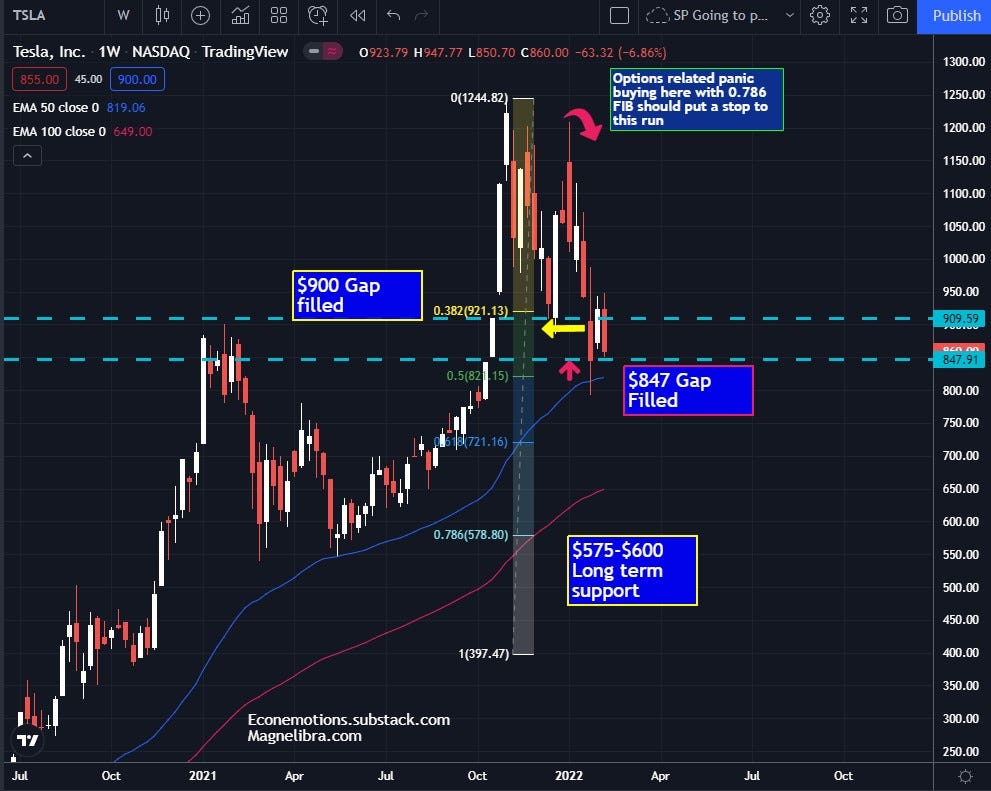
We like Tesla in the long term, but valuations will be driven by overall market direction:
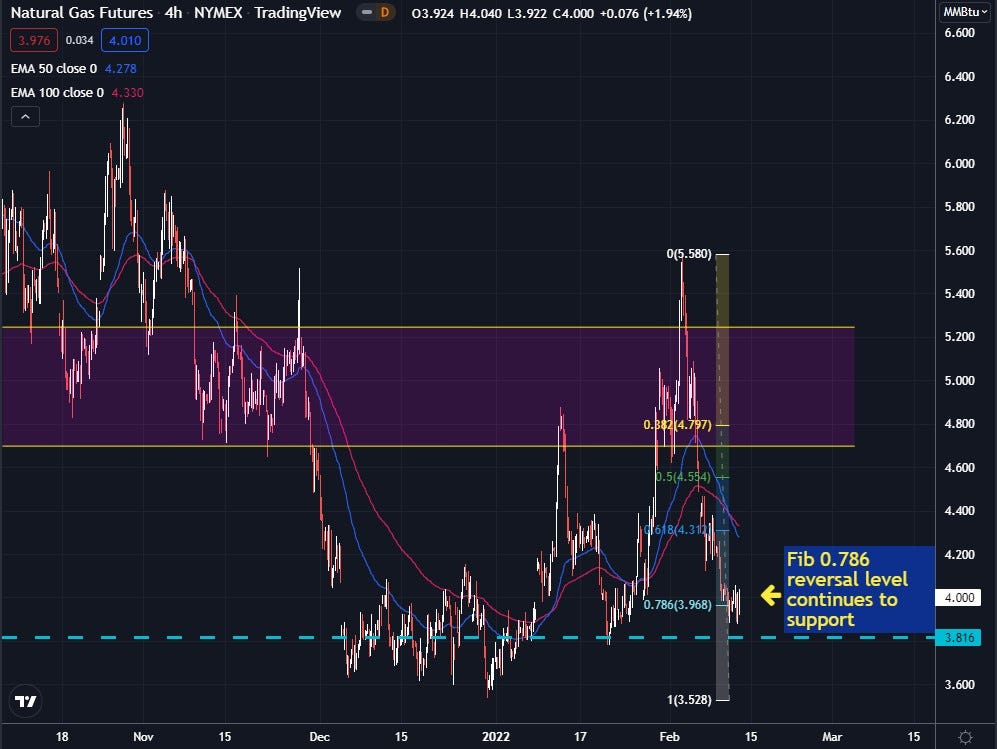
On the bright side we have Energy and Metals, no doubt energy being boosted by the prospects of war and we can’t imagine where Nat Gas will go if and when, but here are the charts Nat Gas up first holding the 0.786:
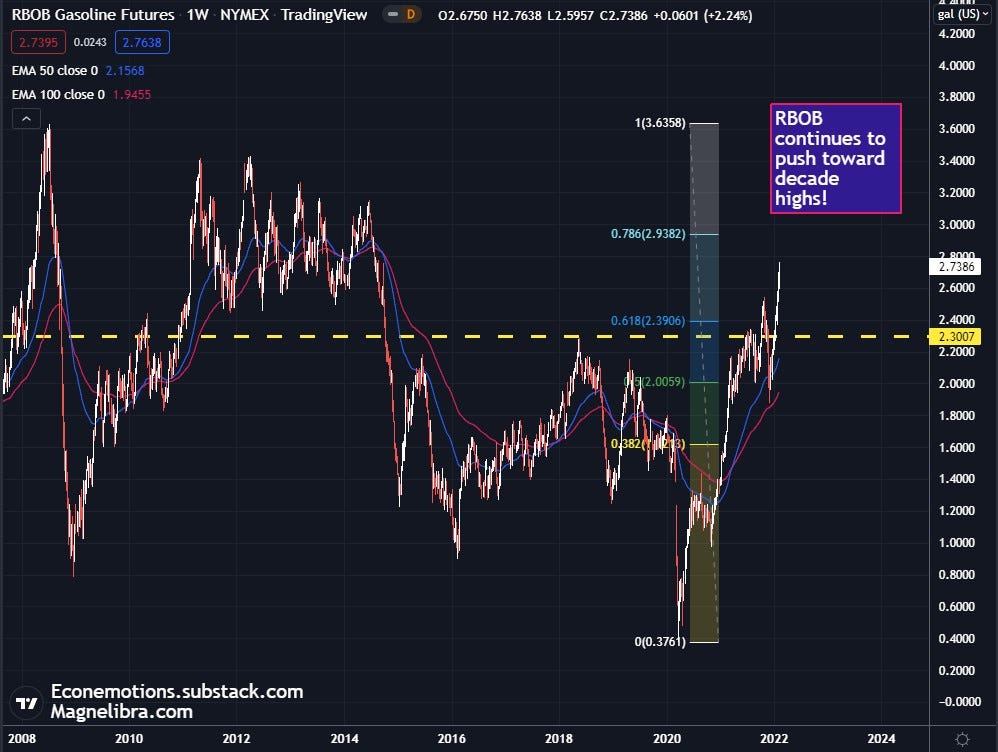
RBOB looking to take out decadal highs:
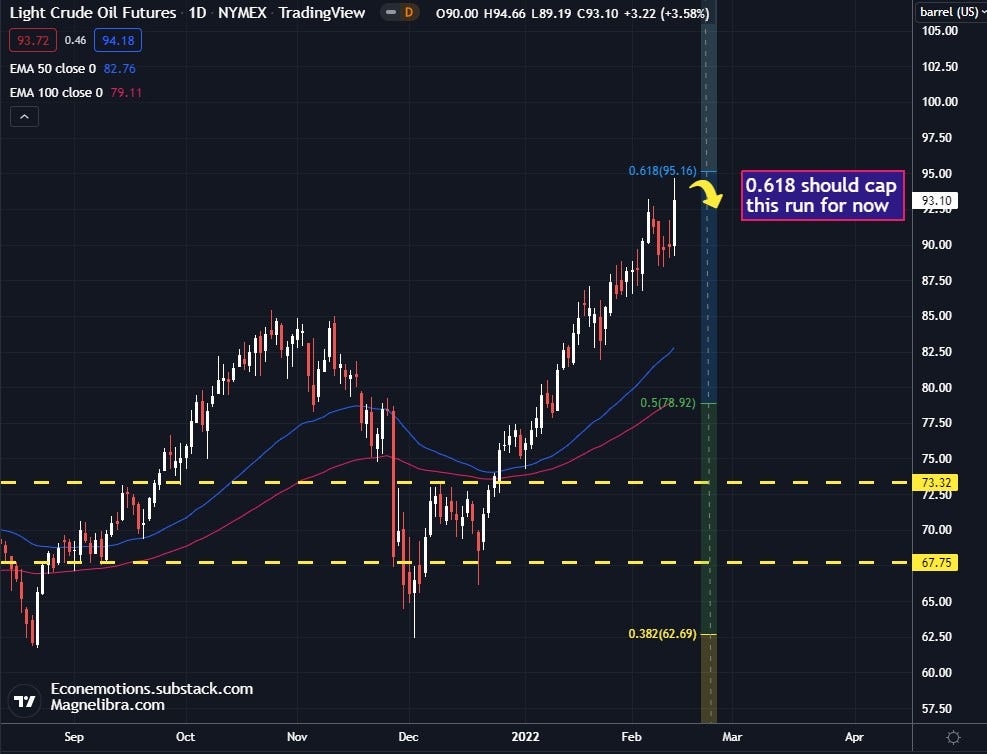
Crude at the 0.618 so will see how the sellers react here:
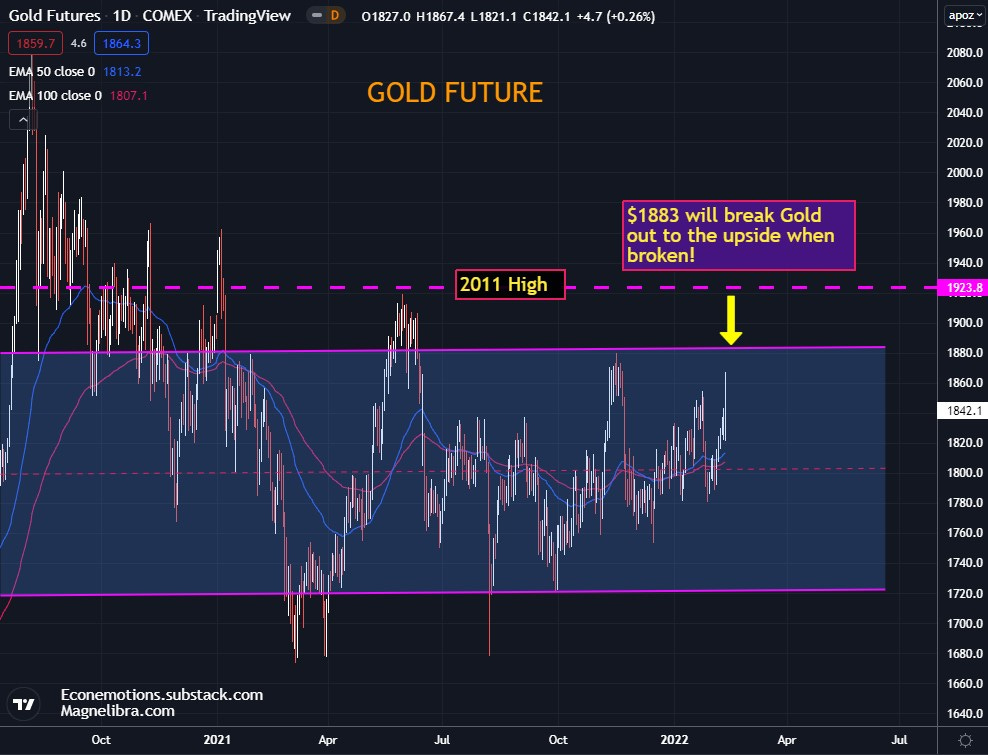
And Gold, we know its undervalued and we know its always going to be money, yet the paper selling keeps it undervalued, but eventually new highs will be had $1883 is key:
Finally check out this factor Bitcoin chart, we love it and we feel the mathematical construct is truly working as it was intended and this weeks record haul for US authorities as crazy as it was, had the looks of a PR campaign…anyway here you go and why you look at this chart realize this Crypto and Coinbase all advertised during this year’s Super Bowl, no longer a gimmick I guess:
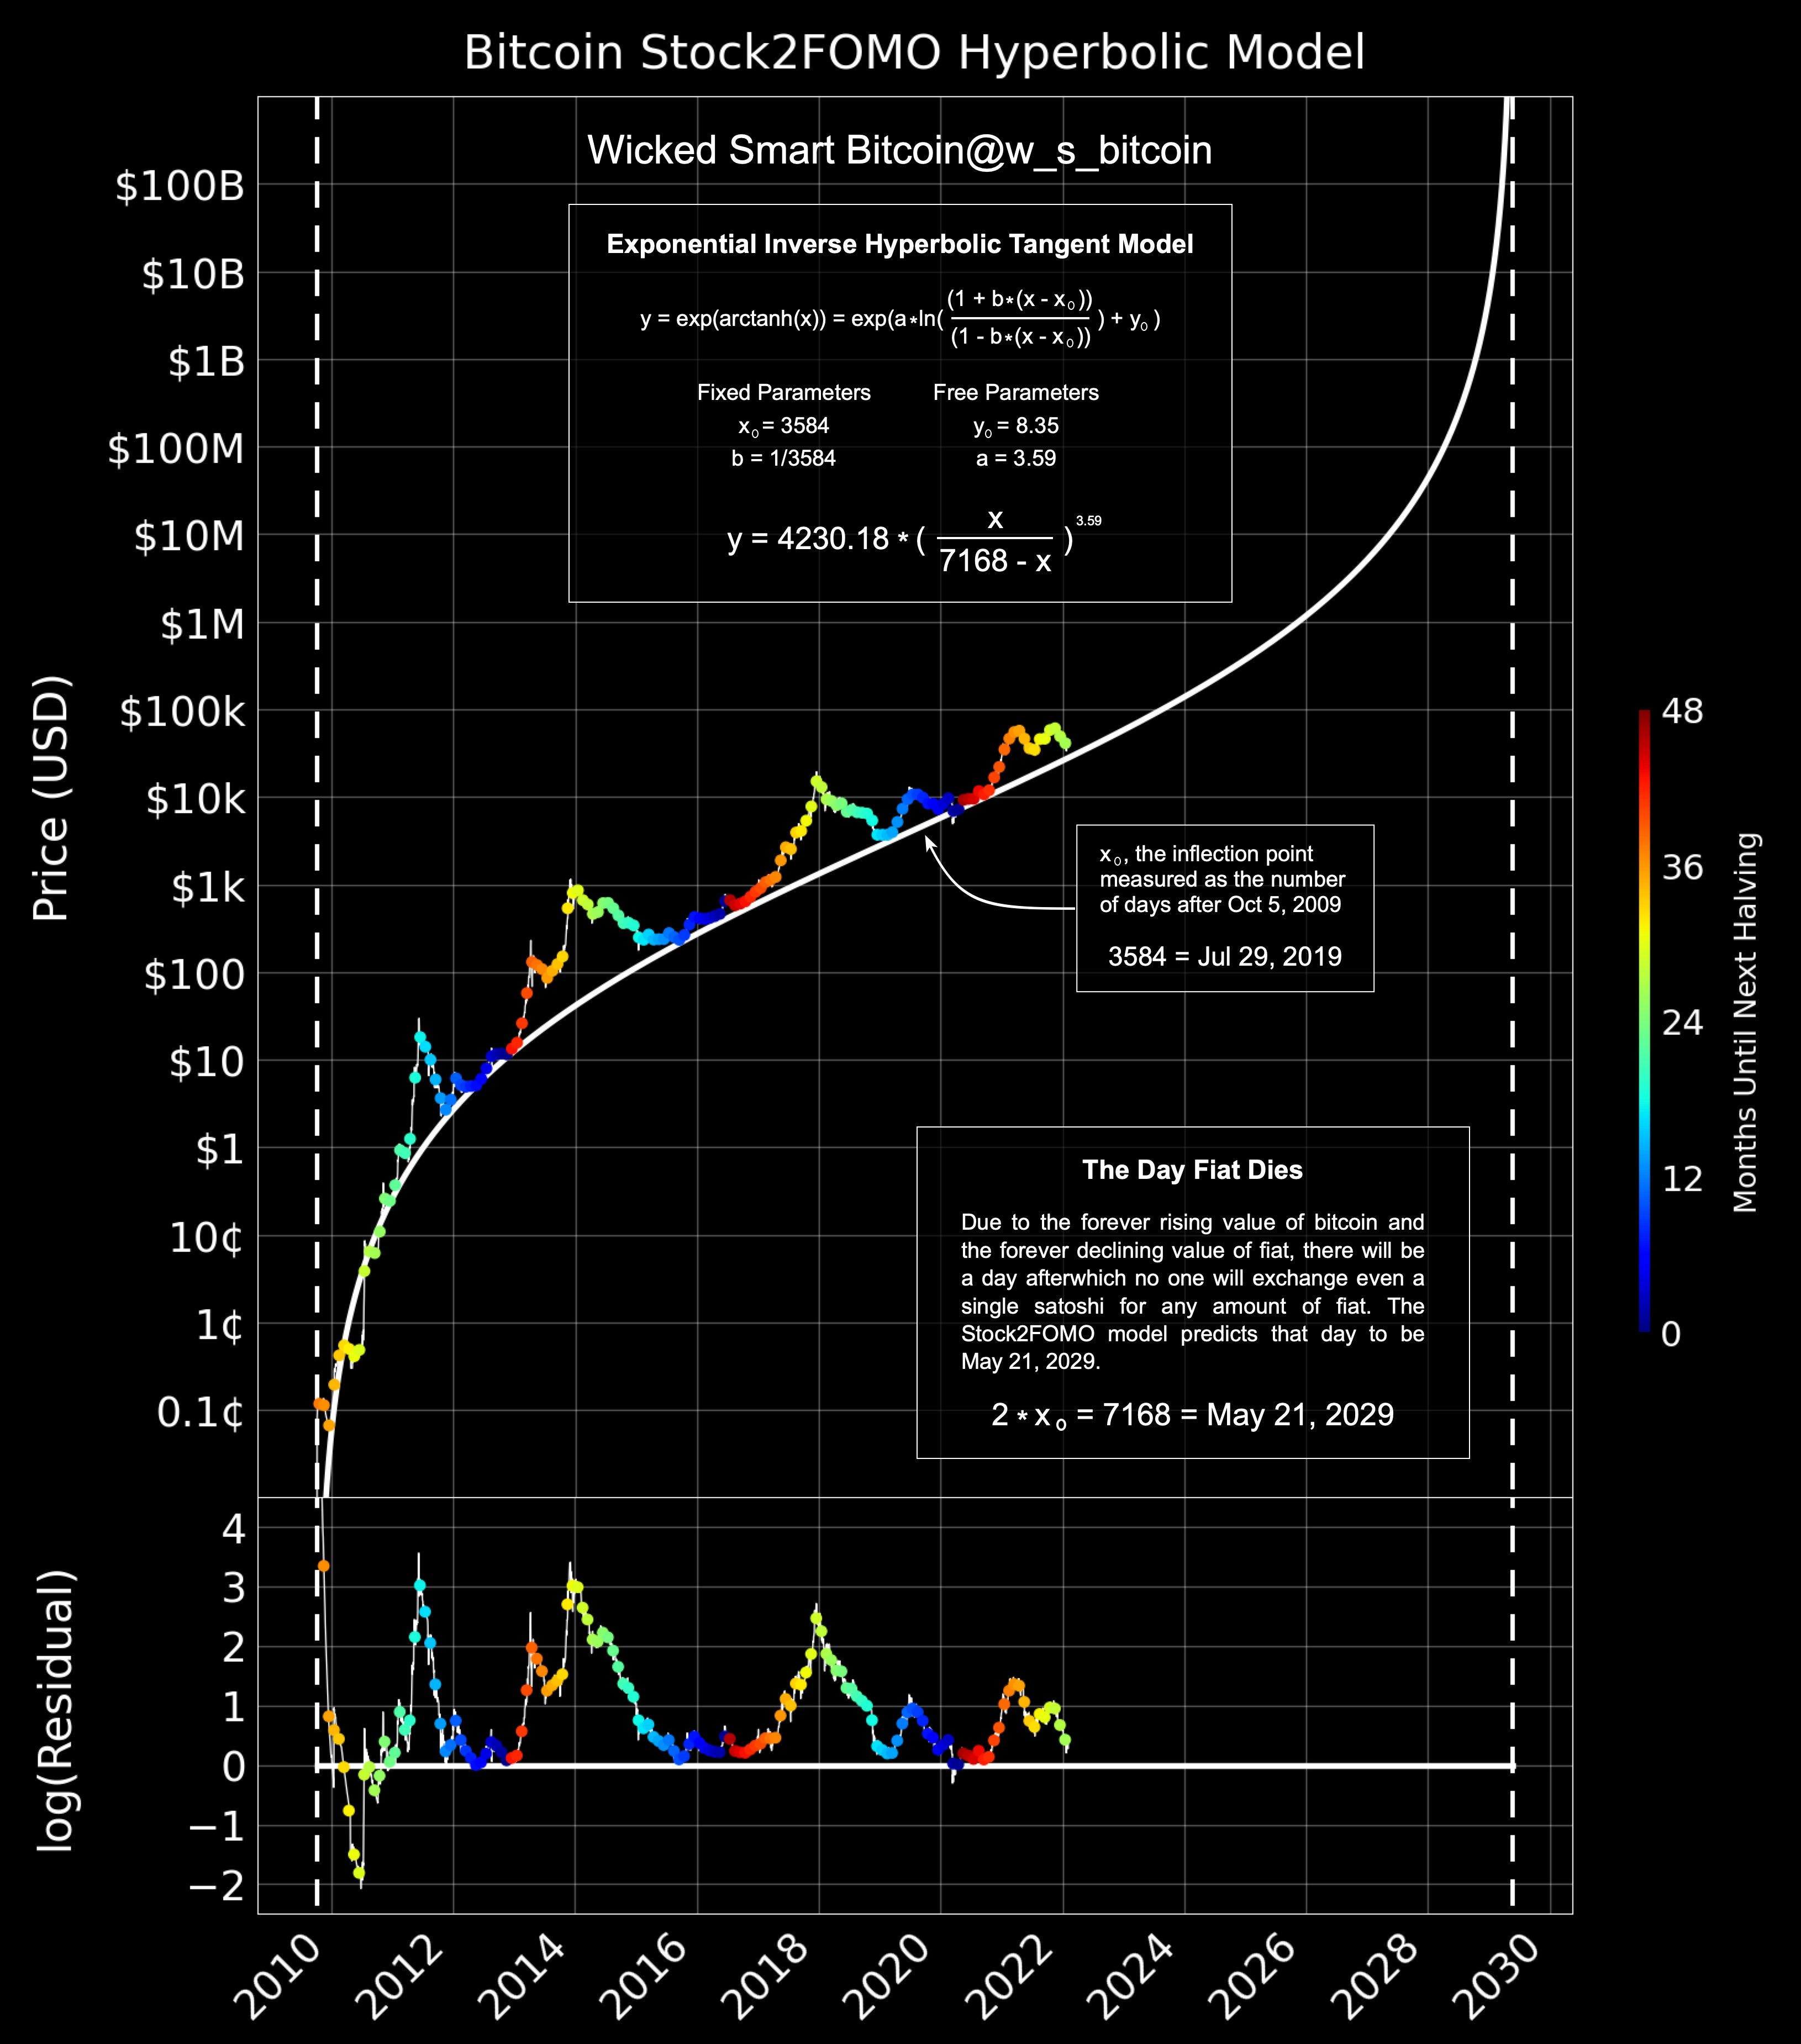
You think fiats not worried? You think central banks have control? Andrew Jackson despised central banking, Austrian economics despises monetarist intervention and why? Because it distorts organic economics, it concentrates wealth and its designed to devalue your labor function. We keep hearing higher rates will kill the economy? Well we suppose we are about to find out! IF and when the FED does reverse this new regime, then our prospects will change, but for now, it is this is how we view things.
Till next time…
Please think about joining the ranks who subscribe and support our missives here. When you read Econemotions trust that you will obtain a different thought process a different way to look at things in your own journey.
Your support is greatly appreciated and we have new tiers to support us, every little bit counts. You should be able to implement a lot of this into your game plan not just in trading, but in all walks of your life. We are in this together whether you believe that or not, it doesn’t matter, we are all connected, so stay positive and know your atoms do have an effect on everyone else around you, so STAY CALM and SIGN UP TODAY!
DISCLAIMER: For educational purposes only. This is not a solicitation to buy or sell commodity futures or options on neither commodity futures. The risk of trading securities, futures and options can be substantial and is not for everyone. Such investments may not be appropriate for the recipient. The valuation of futures and options may fluctuate, and, as a result, clients may lose more than their original investment. Nothing contained in this message may be construed as an express or an implied promise, guarantee or implication by, of, or from the author Michael Agne owner of Magnelibra Capital Advisors. Magnelibra the CTA and its Global Futures Benchmark Program may hold long and or short positions in the various futures and markets that Econemotions covers. We will never claim that you will profit or that losses can or will be limited in any manner whatsoever. Past performance is not necessarily indicative of future results. Although care has been taken to assure the accuracy, completeness and reliability of the information contained herein, we make no warranty, express or implied, or assume any legal liability or responsibility for the accuracy, completeness, reliability or usefulness of any information, product, service or process disclosed. ALL RIGHTS RESERVED 2022