

We are starting today’s note with a WSJ article which exposes the banking sectors usual accounting trickery to circumvent reality. This article is a must read and outlines just exactly the problem that is seemingly never solved, which is the ongoing ability for institutions to play accounting tricks to cover certain aspects of their business that they don’t want people seeing. Now we are not stating these moves are illegal, rather we want to point out the fact that time and time again, institutions in the finance world find endless ways to bend reality and we think the onus must be put onto management and they need to be held accountable, here is the link, As Interest Rates Rose, Banks Did a Balance-Sheet Switcheroo
We wanted to thank our connection professor Rebel Cole of FAU (yes that Final Four NCAA FAU) for pointing this article out to us.
With this in mind and after watching the congressional testimony of Vice Chair of supervision with the FRB, we can’t help but think that the San Francisco Fed and VC Barr knew of the issues at SVB and for whatever reason, (he stated they did not qualify for stress testing given the banks size at the time), however the fact that the stress tests threshold wasn't met is a cop out. When you see that kind of management negligence and disregard for interest rate risk, which as he put it “is the bread and butter of banking,” well were sorry that just doesn’t add up, they knew and they should have done something. What is even more troubling is that the so called stress testing that is conducted, when banks do qualify, didn’t even have higher interest rates as an attribute of their top risks.
As for someone that has traded billions in US treasury securities and has seen blow ups from LTCM, the gaming of the 30Y in Oct 2001, the CDS era of complete lack of regulatory oversight and complicit action from from regulators, auditors, examiners to rating agencies, on and on and on.
We also saw Senator Warren who is nothing more than a mouth piece for pretending to have consumers backs, calls for more regulations, when in fact it is the lack of those in charge of enforcement that are complicit.
It is comical and sad to watch year after year, decade after decade the same games being played by Wall Street and the use of KStreet and DC as their fiddles. It is truly amazing and then the charades during countless congressional hearings, to only see that STATUS QUO is the real agenda, printing Trillions in QE is the real agenda, Concentration of wealth is the real Agenda.
The good thing is AI will expose corruption and hold those accountable especially those in power whom lay excuse after excuse for their complete and utter ineptitude! Although word on the street now is that Wozniak and Musk are calling for a stop to AI research, gee we wonder why…and no its not so that it becomes to advanced. Rather its the same reason they do not want decentralized immutable blockchain networks like Bitcoin. Why? This graphic shows why:
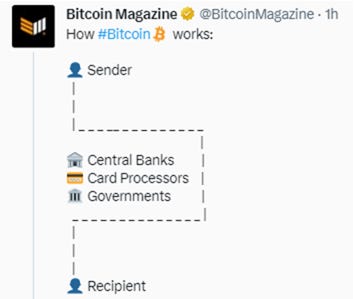
Kind of eliminates a lot of things don’t you think?
We also wanted to touch upon this chart we saw:
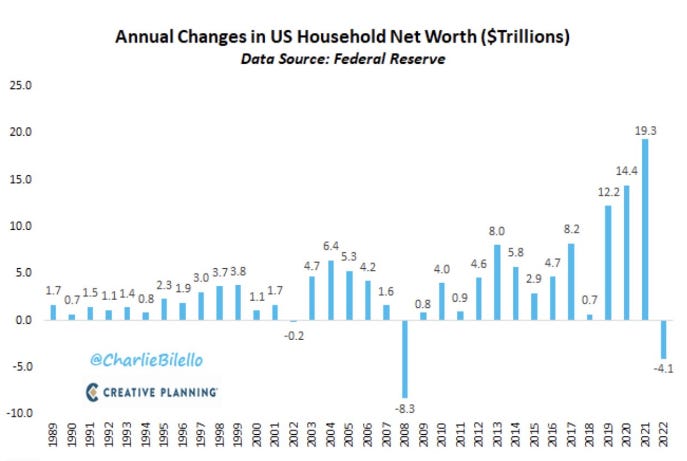
Some were making a big deal out of this, but rather we must take it in context and in relationship to the prior years growth. Which if we do, we can see that this -4.1 print is a mere 10% reduction of the prior 3 years QE, stimulus hand outs and asset price appreciation. If you look at 2008 it nearly wiped out the prior 3 years in total...so no, that is not a big deal now, if it was down 40.1 then yes...but its not, not yet at least.
Looking at this next chart, the question shouldn’t be whether or not this is the Housing Bubble 2.0 but rather if we stand at 2x the prior labeled bubble, What then if not derivatives is the cause of this 2x rise? Perhaps the 10x rise in FRB balance sheet assets???
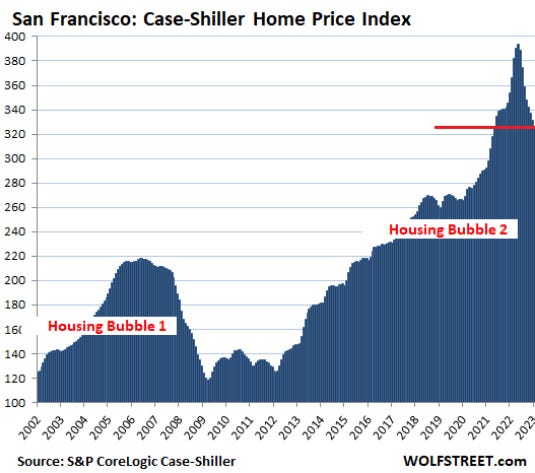
Here is where the FRB is caught, you see you cannot have this kind of credit fueled nominal asset price growth without QE or some sort of levered mechanism. With that they should keep interest rates higher and reduce their balance sheet (Sell of assets) at the same time. The fact that they have raised rates, but continue to expand their balance sheet is the single leading reason why asset prices haven’t come down very much. This is a problem and main street America is beginning to wake up to this issue.
Ok onto the markets, we wanted to share a few charts, first up are the equities, and we can’t say we are surprised, as you know the FRB assets have increased some $300Bn and yes you know where that levered credit ends up…also the USD is under attack but we don’t think this is going to last very long, especially not with yields rising off their recent lows. Anyway we see the SP500 at pivotal resistance and would suspect a battle here near 4060/4070 area, but quarterly end flows will dictate and could see continued window dressing:
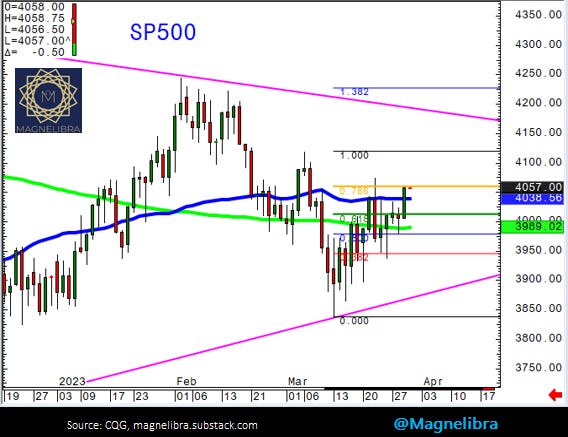
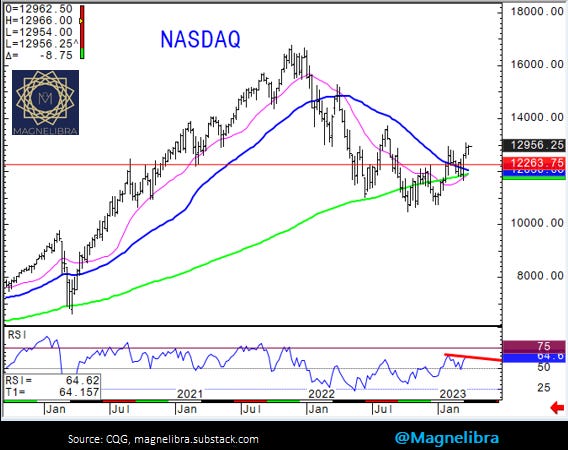
We like the higher price theme as long as it trades above 4038 but below that risk is back testing lower. As for the Nasdaq it continues to attack that 13000 area and sellers seem to keep appearing, so it will be interesting to see if we can get a close above that:
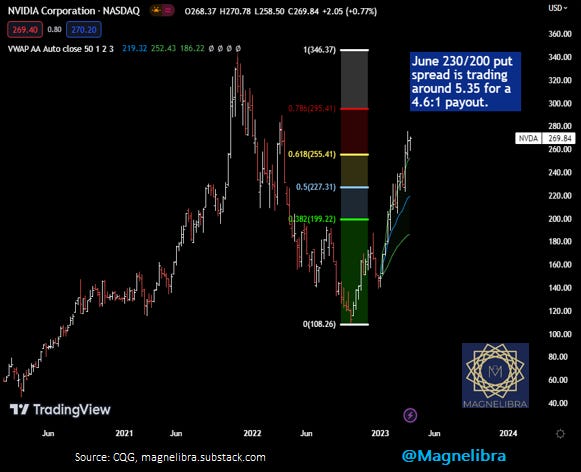
Speaking of the Nasdaq, we have put Nvidia on our radar, this thing is so priced for perfection and we can’t even fathom why buyers would still be supporting this here. We took a look at the June 230/200 put spread, seems like quality risk/reward:
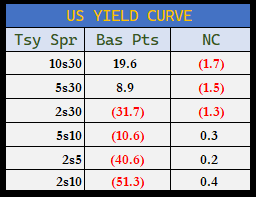
As for the US Bond market, we have seen things come down with the MOVE index off its highs, the US Yield Curves have taken back some of that swift steepening move of the last few weeks and the curves are as follows:
We have the US Govt 10Y/ FedFunds spread back near record lows or inversion which is as you know the real leverage and carry killer it sitting at a -1.267%:
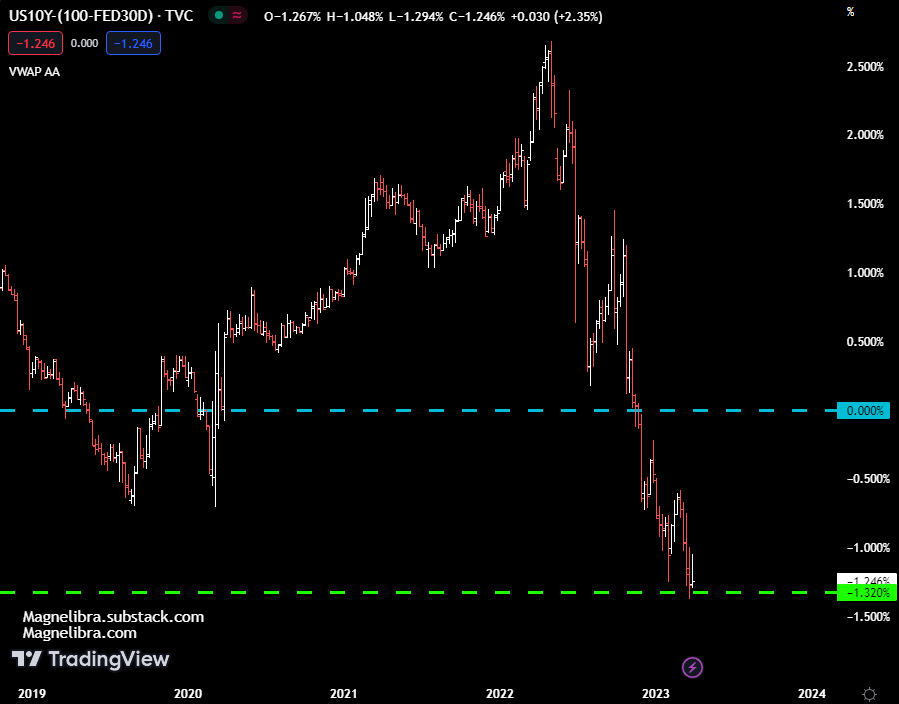
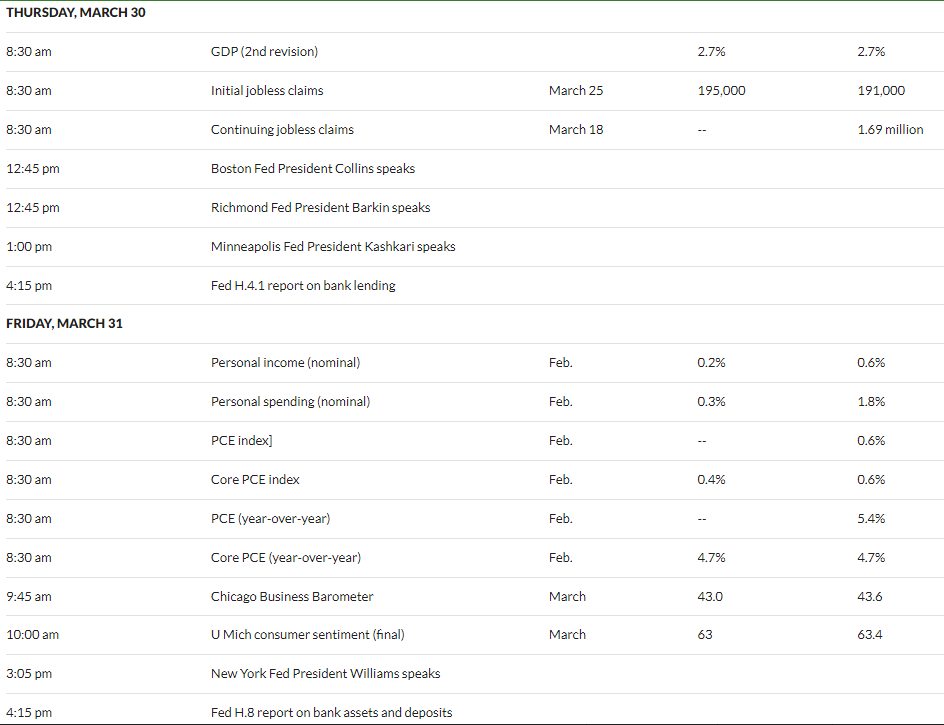
The bond market continues to pound the table for rates and the FRB to pivot. Will they? Can they? Do the bond managers out there suspect the risk of inflation is minimal vs the risk of a hard landing? Sure seems that way, but for now Powell and Co. do not seem to share that same sentiment, then again, will see how this weeks data finishes out, we should get more insight to the inflation picture.
Thursday and Friday’s economic data releases are shown here and once again we will get a glimpse into inflation and the FRBs weekly numbers where we see just how much was tapped via the discount window and the BTFP:
DISCLAIMER: For educational purposes only. This is not a solicitation to buy or sell commodity futures or options. The risk of trading securities, futures and options can be substantial and is not for everyone. Such investments may not be appropriate for the recipient. The valuation of futures and options may fluctuate, and, as a result, clients may lose more than their original investment. Nothing contained in this message may be construed as an express or an implied promise, guarantee or implication by, of, or from the author Michael Agne owner of Magnelibra Capital Advisors. Magnelibra the CTA and its Global Futures Benchmark Program may hold long and or short positions in the various futures and markets that Magnelibra covers. We will never claim that you will profit or that losses can or will be limited in any manner whatsoever. Past performance is not necessarily indicative of future results. Although care has been taken to assure the accuracy, completeness and reliability of the information contained herein, we make no warranty, express or implied, or assume any legal liability or responsibility for the accuracy, completeness, reliability or usefulness of any information, product, service or process disclosed.
ALL RIGHTS RESERVED 2023