

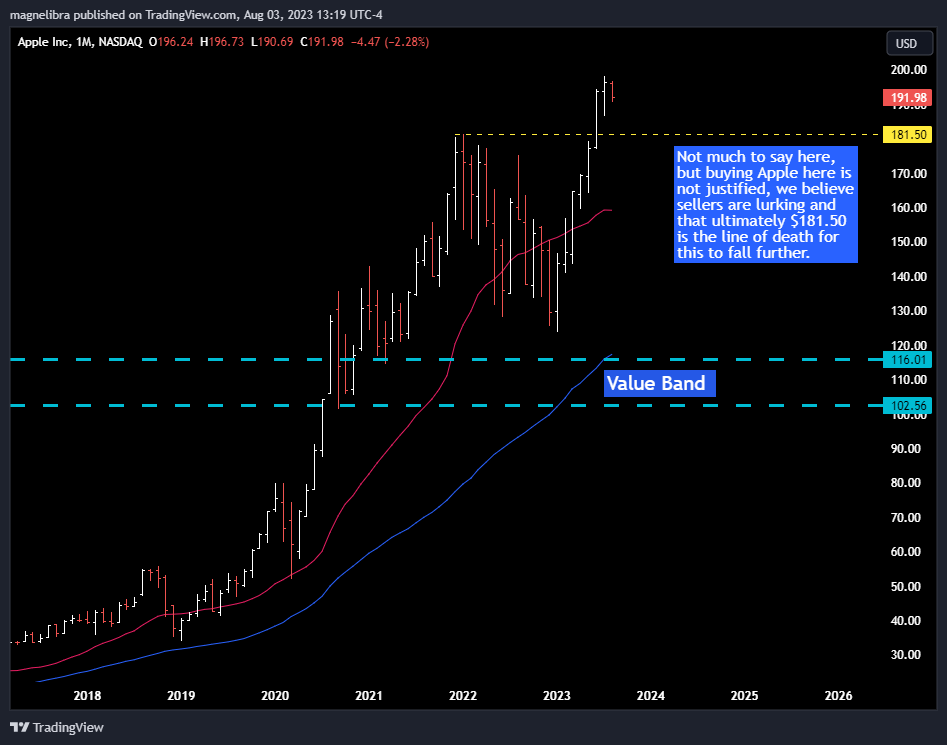
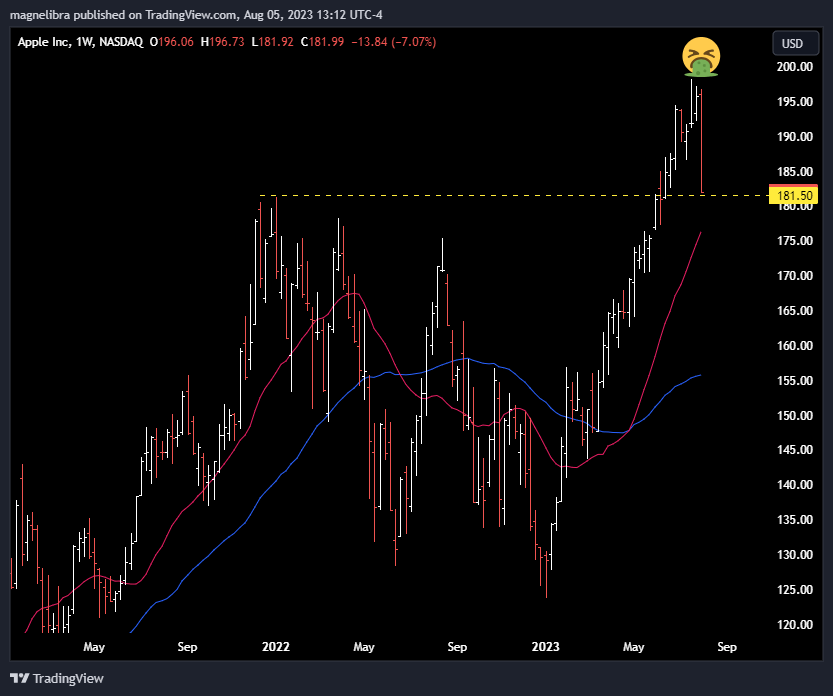
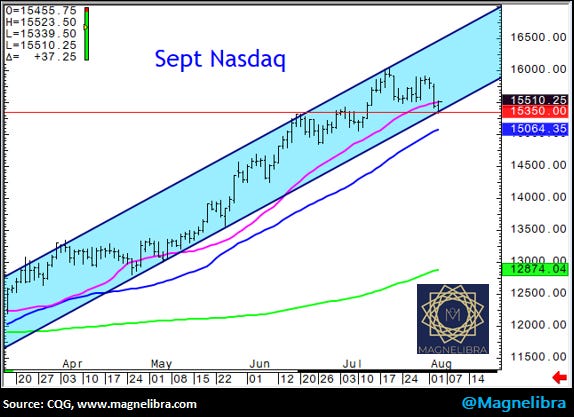
Alright last Wednesday we put out a free update entitled, “Apple Earnings Boom or Doom for Nasdaq” where we highlighted Apples potential slide toward the all important $181.50 and a Nasdaq futures chart showing 15350 as a major support level. Well let’s take a look at these charts that we posted and how they look after Friday.
First up here is the Apple chart we posted in our Wednesday note the technical top that is being put in with $181.50 highlighted:
Fast forward to Friday, where the low was $181.92 and settled $181.99:
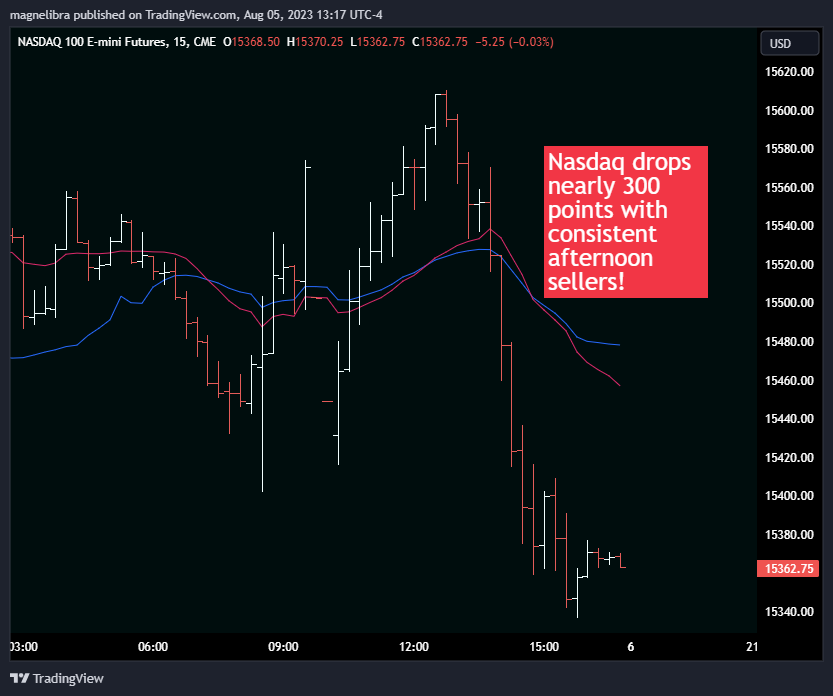
We are not taking this signal lightly and in fact Friday’s Nasdaq futures action was indicative of how much the sellers are in control as the morning bull attempt was flattened by the afternoon with a whole host of consistent and heavy selling:
And to compare to Wednesday’s chart of the Nasdaq futures, well this trend channel will give away with a close below 15350 on Monday:
So many say, well we never saw that selloff coming, or who would have known…well now you know, the stage is set and as you know we have two pillars left to fall before we see real equity selling.
1. A negative Non Farm Payroll print
2. FOMC rate cut.
So there you have it, we are on the cusp of the AI euphoria being drained and for the economic reality of higher rates destroying corporate and Main Street balance sheets. Yea we know the rates are locked for the consumer, yes low mortgage rates for sure…well they aren’t for credit cards and auto loans, they aren’t immune from higher consumer discretionary costs. Throw in a negative payroll report, increase layoffs and you will have a recipe for a very hard landing.
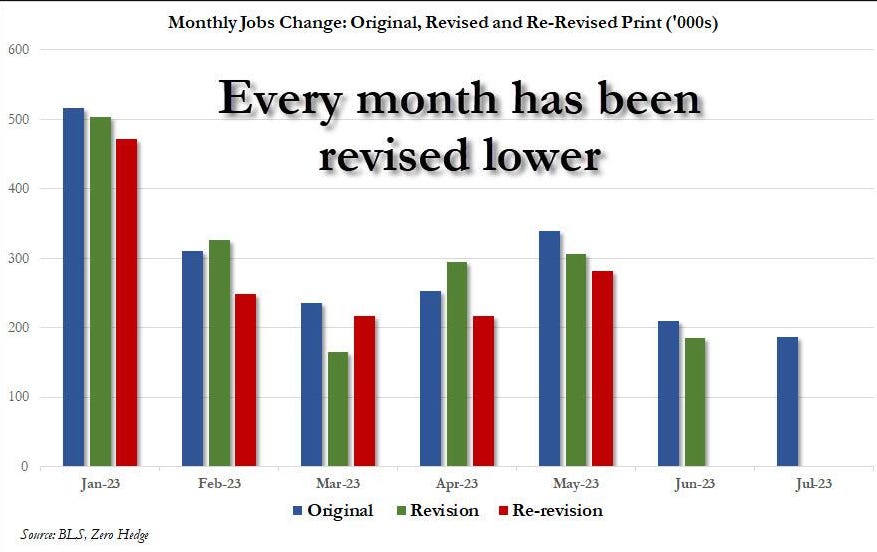
As far as NonFarm Payrolls, Friday’s was the first below expectations, since, well since we can even remember as it came in at 187k exp 200k. The revisions keep on coming in with lower prior numbers and we all know even those are probably not the actual numbers:
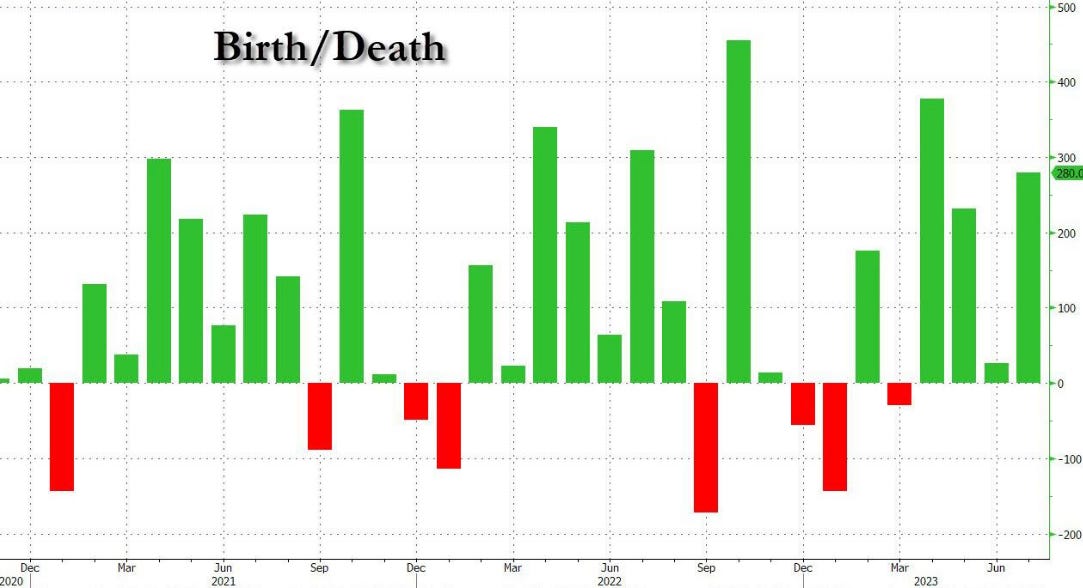
To make it all worse, the BLS birth/death model tends to always add 100k +, this is a survey number not actual, i.e. its made up, fantasy land:
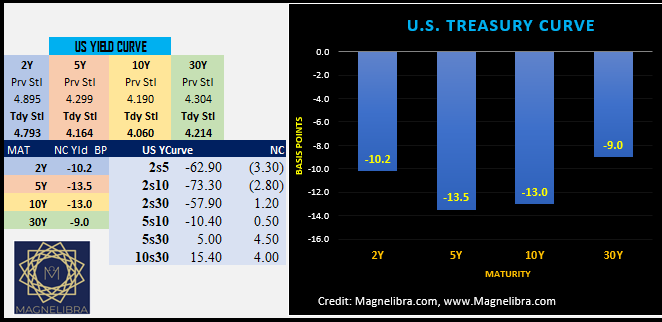
All in all this is the trend change we were looking for, a below expectation print. We know the US bond market loved it as yields were pummeled:
As far as all the other markets here is how things settled out on Friday:
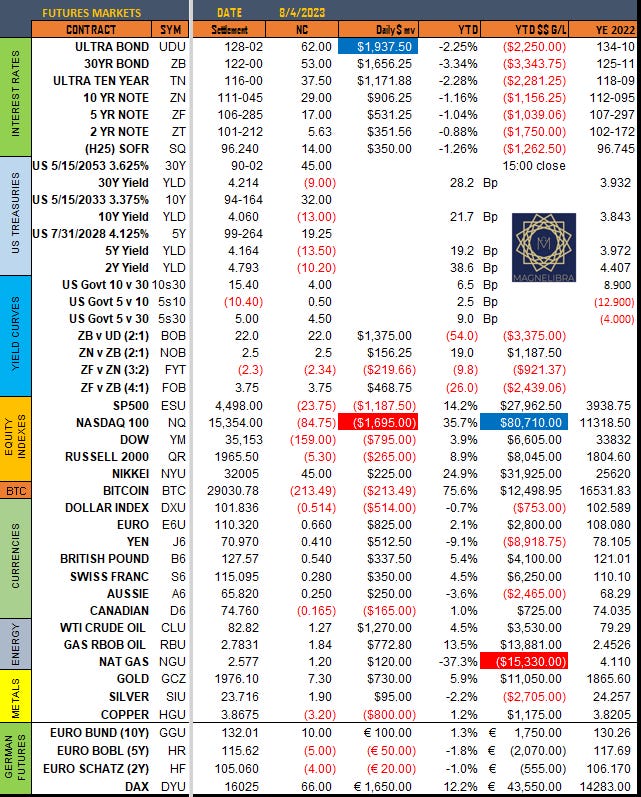
The US Bond market was the big winner, FX was also higher despite the equities getting hammered, with energies and metals higher except for copper.
The MEGA8s were mixed as Apple killed the equal weight in this complex but Amazon made up for those losses, so the MEGA8s didn’t see much damage:
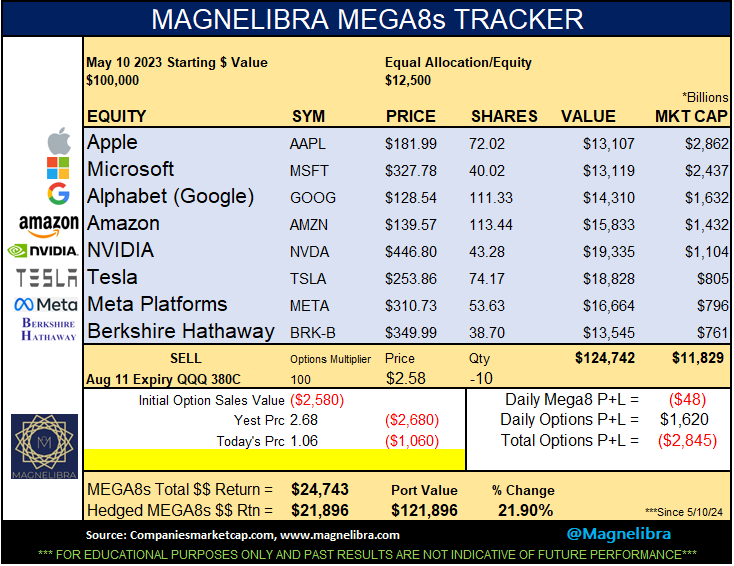
As you can see our option hedges continue to perform and its exactly what we want to see especially as this market stagnates on the highs.
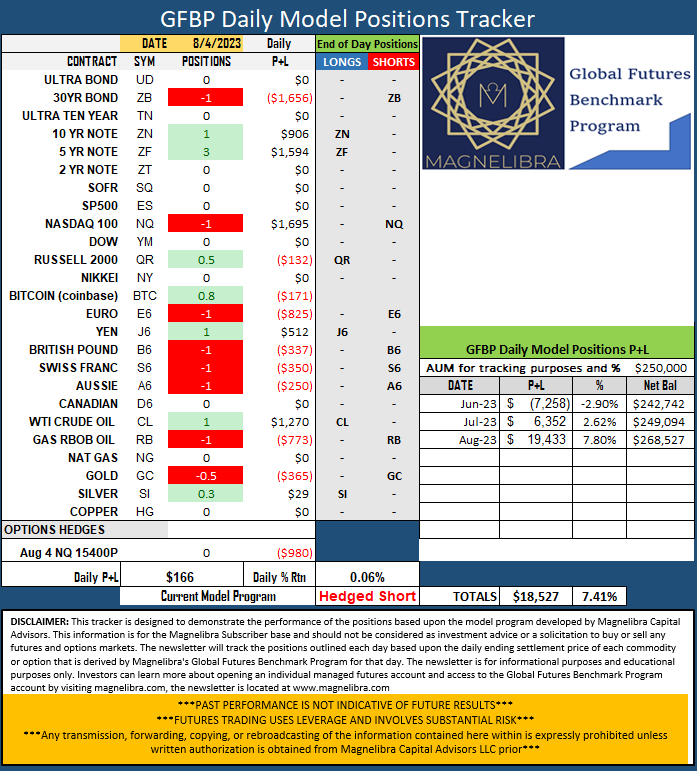
As far as our GFBP Tracker we will continue to monitor US Fixed Income, to add to the steepening bias and will look to adding a Dow long vs SP500 short, August is off to a stellar start and indicative of a trend change we have been trying to capture for sometime:
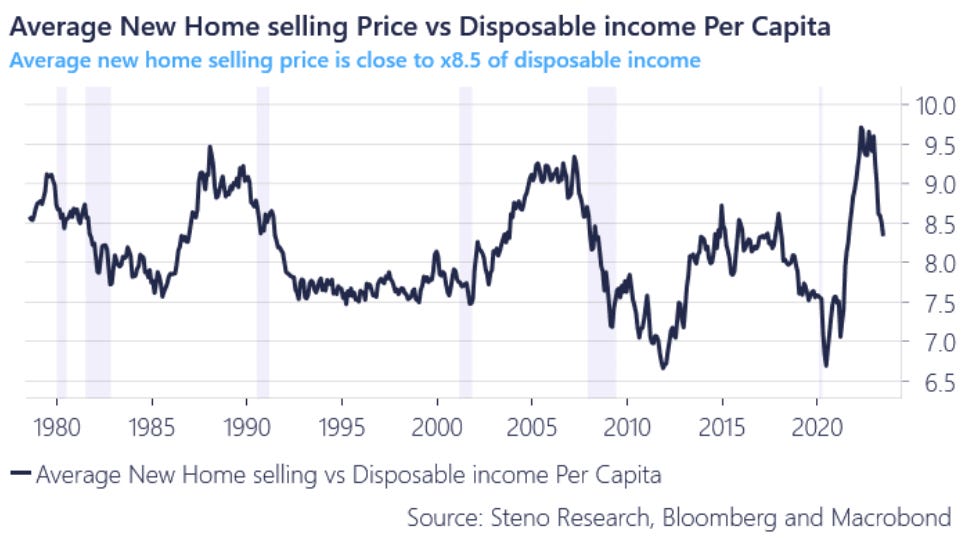
We saw an interesting chart for home affordability. To put these numbers into perspective lets see how much of a average new home selling price drops from 9.5 to 7.0 on this chart. We will use their DIPC of $46795 which at a 9.5x = $444,552 ANHSP. If we keep the DIPC at $46795 then at 7.0x this equals an ANHSP of $327,565. This signifies a 26.3% drop in the Average New Home Selling Price…
Another interesting thing about this chart is the tops that are put in, actually precede a recession…that is very telling for today’s economy as well:
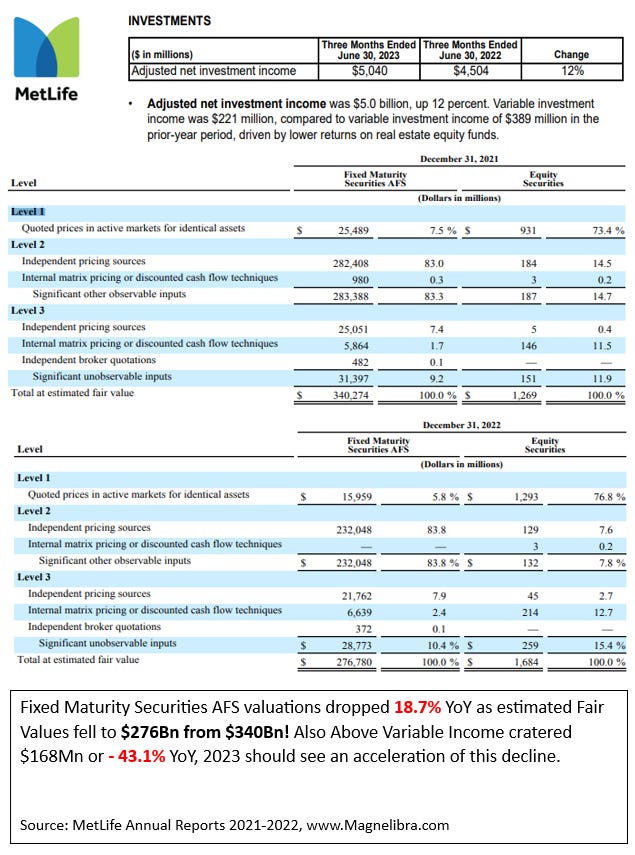
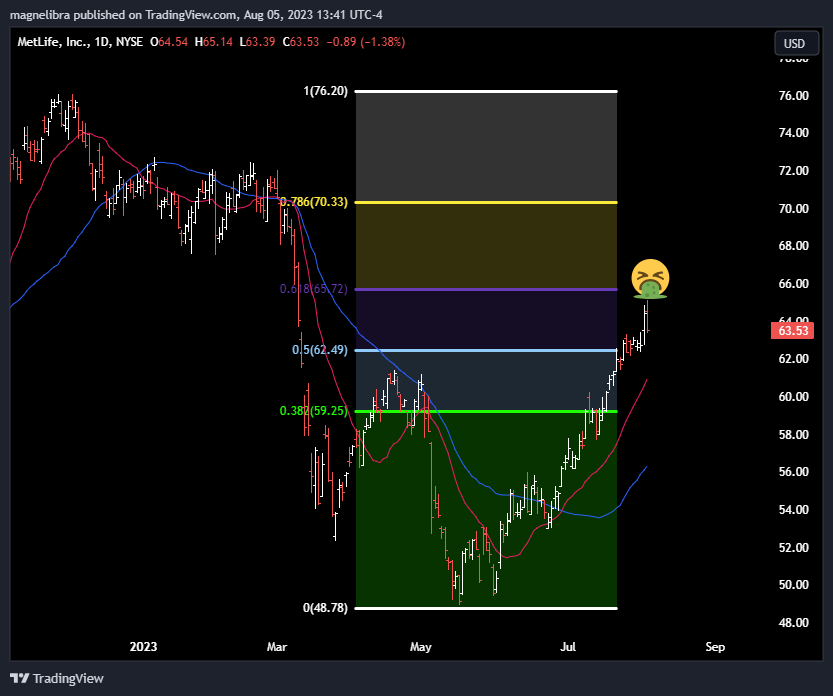
Finally we wanted to add a little bit of equity research we did because we feel that the full brunt of the CRE melt down has yet to be felt. Given the fact that regional banks and insurers are big investors in CRE, CLO, ABS etc. we felt compelled to look under the hood, dig a bit deeper. We decided to look at Met-Life, for no particular reason, but what we found is that their Fixed Maturity Securities, their available for sale (AFS) valuations dropped 18.7% last year…we can’t imagine this year will be any better and that $64B stinger will most likely be topped again this year. We do not believe many see this but we do, we believe the coming write downs will lead to either capital raises or fire sales, take your pic, either way its destruction of share holder value:
The recent run up in Met-Life seems a bit much, we looked at the March $40 puts, they were around $1, but we suspect will start to creep up now:
Ok that is it, we hope you share our work, we hope you enjoy what you read, we hope to improve your vision when it comes to market clarity. Our goal is to expose you to how Magnelibra thinks, how it looks at markets, how it looks at the global macro picture and most of all provide you with insight and commentary that can only come from decades of experience trading derivatives. Please share this letter in hopes that we gain exposure. If you aren’t subscribed please do, its like a $1.67 a day, less than a cup of coffee that you enjoy for 20 mins and toss in a garbage can. What we provide are life long learning lessons and your return on your $1.67 probably has no upward limits!
Cheers
DISCLAIMER: For educational purposes only. This is not a solicitation to buy or sell commodity futures or options. The risk of trading securities, futures and options can be substantial and is not for everyone. Such investments may not be appropriate for the recipient. The valuation of futures and options may fluctuate, and, as a result, clients may lose more than their original investment. Nothing contained in this message may be construed as an express or an implied promise, guarantee or implication by, of, or from the author Michael Agne owner of Magnelibra Capital Advisors. Magnelibra the CTA and its Global Futures Benchmark Program may hold long and or short positions in the various futures and markets that Magnelibra covers. We will never claim that you will profit or that losses can or will be limited in any manner whatsoever. Past performance is not necessarily indicative of future results. Although care has been taken to assure the accuracy, completeness and reliability of the information contained herein, we make no warranty, express or implied, or assume any legal liability or responsibility for the accuracy, completeness, reliability or usefulness of any information, product, service or process disclosed.