
SP500 vs Nasdaq Spread Chart
Crude Oil Weak + Tracker Updates

Ok sorry for today’s late post, but there are just a few items we wanted to share. The first visual is a chart of the SP500 vs the Nasdaq Futures. We like to view these in contract dollar value and here is what the latest is showing:
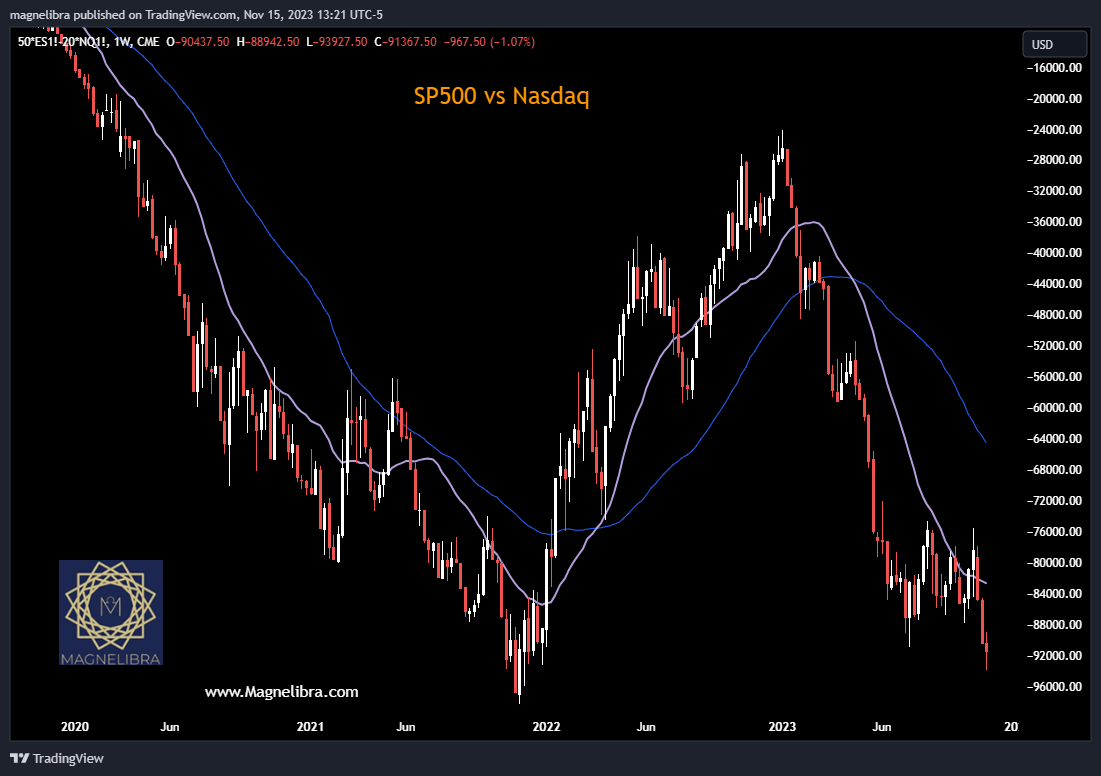
This really shouldn’t be much of a surprise as 2023 has been the year of the MEGA8s as we have noted time and time again! What we see now is that the spread is right back near the prior support which was hit in late 2021. Will we start to see a wider dispersion of equity interest outside the MEGA8s?
Perhaps, but the bigger question is does this area of support signal a deeper directional move?
The last time we hit this support area, the Nasdaq collapsed from 16700 to 10700 roughly a reduction of 6000 points or 36%.
Please note, we are not suggesting that if this time the spread reverts it will be doing so under a collapse of the Nasdaq high flyers. Rather we may see investors spread out and diversify from these MEGA8s and this could cause the spread to revert.
So don’t take this chart for anything more than what we see, which is an area of prior support. If history is any guide, well the equity markets tend to rally into the first rate cut post a rate hiking regime. This is what we are seeing now, however we must also note that the dynamics in the world are very different. The US Debt is out of control and the rest of the world knows it and has made attempts to de-dollarize.
