
Steady Now & 3iAtlas Have You Heard?
Subscriber Data for Aug25 2025

Good morning everyone and welcome to another edition of MTR. Let’s start out with today’s data chart showing a continued decrease in the home price composites (green line). Please note the increasing red line is the mortgage rates but inverse on this chart meaning the higher the red line goes the lower the 30 mortgage rate is. As you guys know, rates are just one part of the affordability curve, price is by far the bigger factor as is stable and steady employment and income.
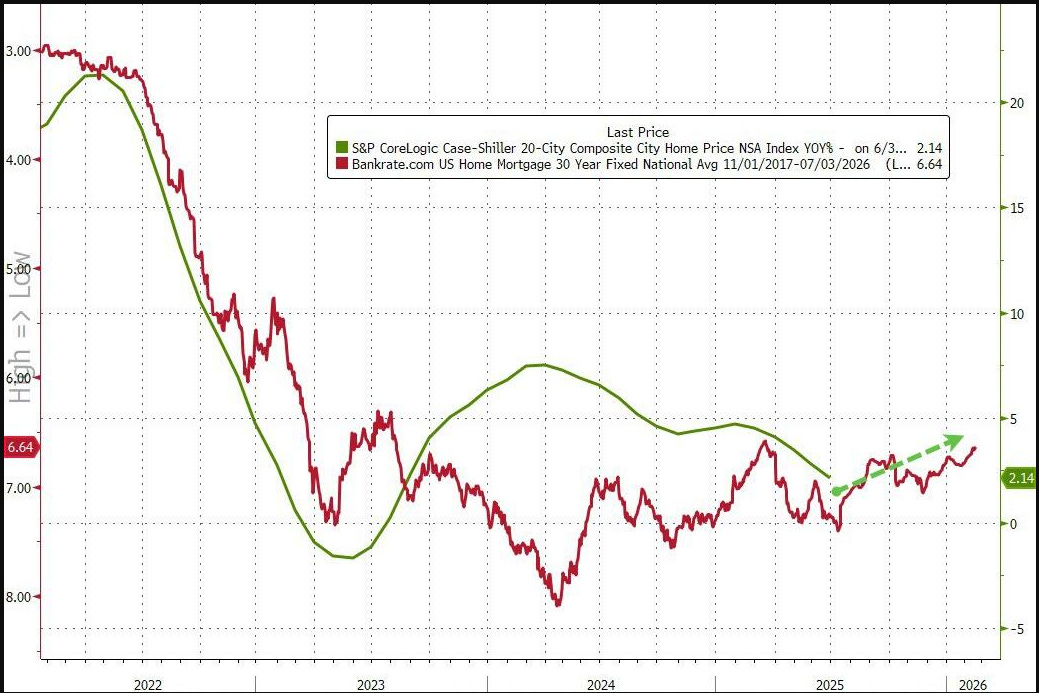
The data is interesting to note as both New York and Chicago saw large annual gains thus far 7% and 6.1% respectively. Seems at least the demand in the bigger cities remains adequate and perhaps a reversal of the southernly immigration post covid. Maybe the south proved to hot for many Northerners. Tampa saw the largest drop of 2.4% thus far, but this is in contrast to an absolute 2x in pricing post covid. We fell the price drops should continue in the southern region as post covid euphoria buying has now ended and supply of homes is drastically higher in both existing and new components.
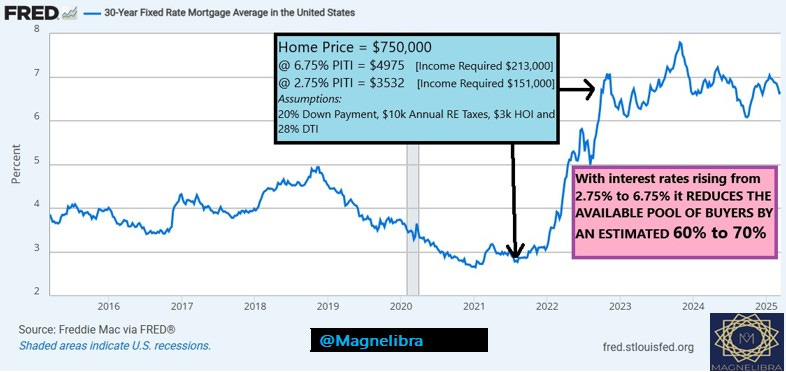
One thing we want our realtor readers to know and this is a chart we have shared before, your available pool of buyers given current rates and affordability segments have diminished the available pool dramatically:
Speaking of Tampa let’s look at a few home comparisons and see if you guys can spot which one offers better value! This is the top 5% crowd, however value is subjective and it doesn’t matter if the home is $300k or $3m their respective demand pool still has a general perception of value. In this picture we want to posit the fact that very similar homes are effectively priced at a 30% to 40% differential.
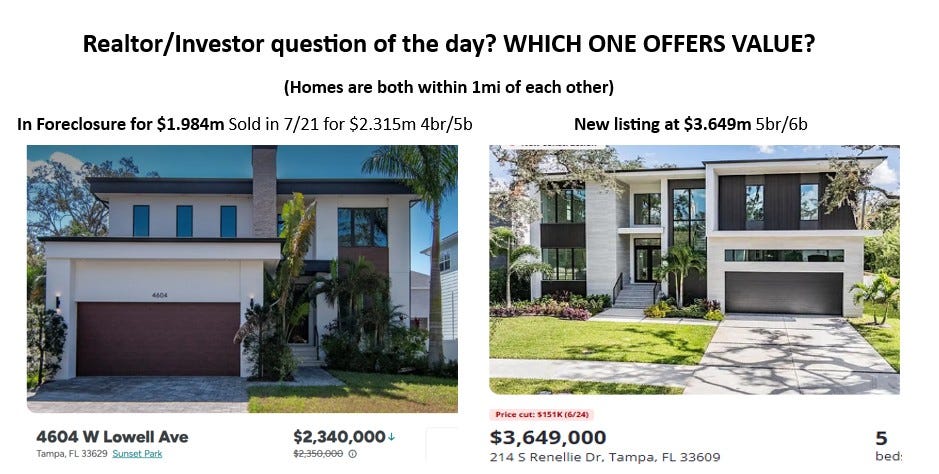
Considering the current demographics especially the fact that the average household has only 1.7kids, its strange to think that elite home builders still want to supply 4 and 5br homes…perhaps the tide is going to shift now to more realistic 3br/2.5bth, then again when you get into this upper echelon its hardly about price nor practicality and more about size and status, we get it.
That image above was done about a month or so ago and now the seller is down to $3.2m but we want to compare it now to another home just a block away or so:

So the lesson here is obviously the home on the top is worth way more in land value alone being more than half an acre (2.71x larger lot), the home is also older and has way more character and almost 1.5x more sq. ft., so there is a lot to decipher when it comes to actual “perceived value.” However we know when it comes to buying in this arena, its more about preference than value! Only a few have that luxury, but it is the reality of the situation none the less.
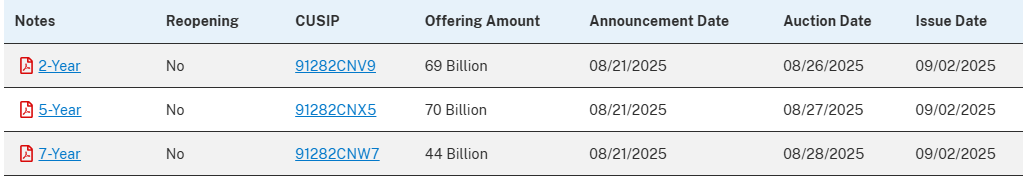
So lets move on, we have the U.S. Treasury auctioning off some new debt here this week in regards to the 2s,5s,7s with $183bn:
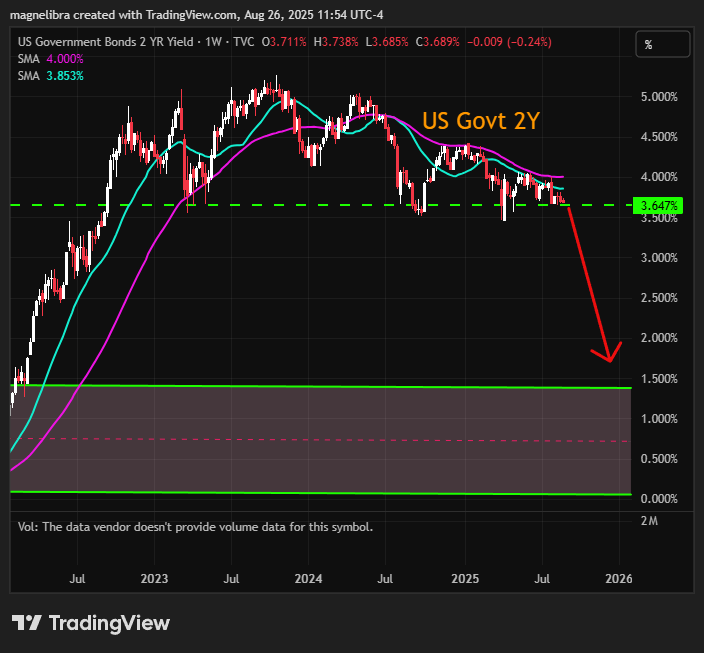
The 2y yields are nearing their breakdown point on the weekly, how exciting:
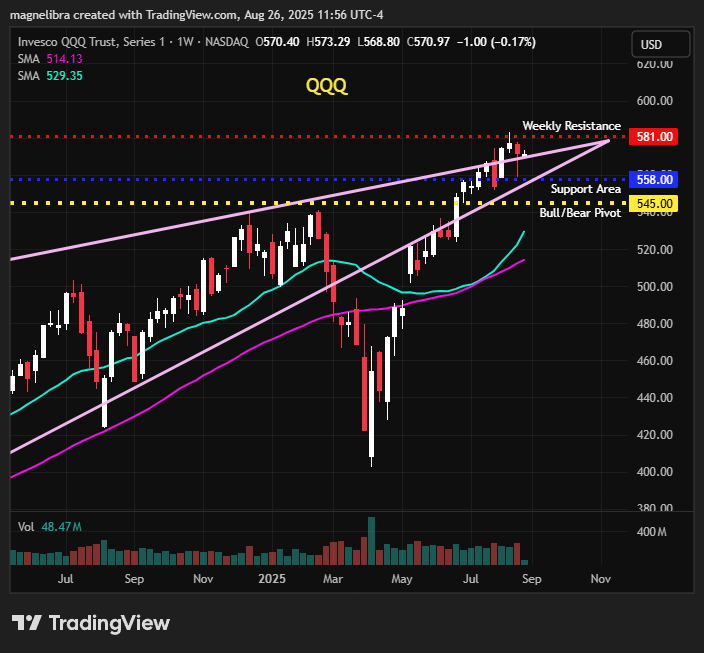
As far as the QQQ ETF its hanging on to the upper wedge trend line for now:
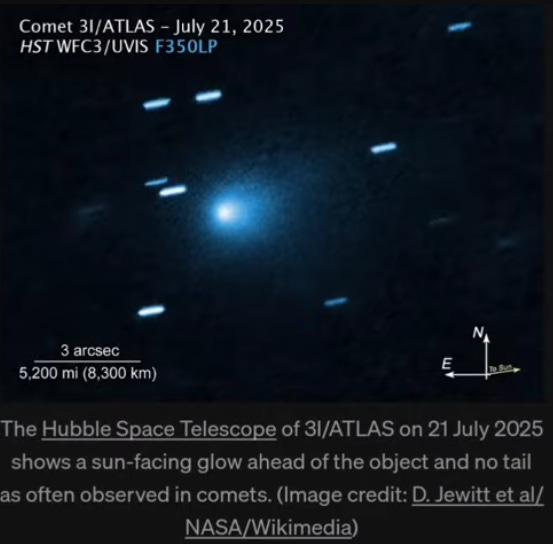
Moving from the markets, we wanted to switch gears and talk about 3iAtlas, if you haven’t heard this term, we are glad to be the first to bring it to your attention. We know the science community is both a buzz and concerned, because this object has some serious differentials than any other object the community has ever seen. We believe the world is going to hear a lot more about this object in the coming months because as far as we can tell, something like this has NEVER been observed. A couple of unique observations are:
Its massive, based upon albedo data (reflectivity) estimates its size at 46km in diameter. (larger than any other historically observed interstellar object!)
Its mass is estimated at 1m times larger than the comet 2iBorisov
It does not have an extended dust tail despite producing a large amount of gas
Its debris tail is not just a tail but actually is front running the object which is counter to any objects ever observed and its emitting massive amounts of CO2
Its trajectory is also odd, it is moving in retrograde motion (opposite of the planets
It also aligns to our orbital plane, which statistically is 1 in 500 or 0.2%
None the less this object is one to watch and we recommend watching Randal Carlson on the STC podcast to learn more, click the link here 3iAtlas included is the CNN interview with the scientist Avi Loeb

Also review the YouTube Channel The Angry Astronaut, he also does an excellent job covering this, 3iA Angry Astronaut
Fantastic and exciting stuff awaiting mankind! There is so much we don’t know about our realm and we love when these events happen, so much more to learn. So we hope we opened your eyes to something new today!
Ok we will now move onto our subscriber only section where we highlight all the daily data and trading trackers that we hope our investors use to compliment their own investment themes. We believe the way we structure our data, the way we present it to you, offers a unique advantage to follow along and learn how to trade and invest in a more global macro hedged format. We really put a lot of effort into trying to best convey the markets movements, the base case fundamentals that exist and then to extrapolate them into actionable processes. We believe that if you follow our work, start implementing some of the things that we present, you will not only improve your odds of winning but also gain an invaluable mindset to take through all facets of your life. So think about subscribing and becoming a supporting member, at the least share our work if you can!
The price is right and we hope you take advantage of our pricing tiers, we know you will gain exponentially more.
******************************SUBSCRIBER ONLY SECTION********************************
